Small scale Monte Carlo Test Estimate
Method:
I ran over the old mit004X filtered QCD endcap sample to get an idea of counts and make some proposed data comparison plots. I weighted samples properly when combining them - this is reflected in the fraction of events from that bin in the final distribution. I focus on photon candidate pT between 6 and 9 GeV. The number of events generated, photon candidates found, photon candidates found within the range, and fraction each partonic pT bin contributes is given in the table below.
| Sample Name | pT Range | # of Events Generated | # of Candidates Found | # of Candidates with pT>=6 and <= 9 | Fraction of final distribution |
| mit0040 | 2-3 | 14877 | 67 | 21 | 0.011 |
| mit0041 | 3-4 | 19569 | 52 | 12 | 0.006 |
| mit0042 | 4-6 | 50195 | 334 | 65 | 0.028 |
| mit0043 | 6-9 | 55750 | 1171 | 297 | 0.130 |
| mit0044 | 9-15 | 25970 | 2366 | 943 | 0.544 |
| mit0045 | 15-25 | 13406 | 3496 | 1853 | 0.281 |
Plots:
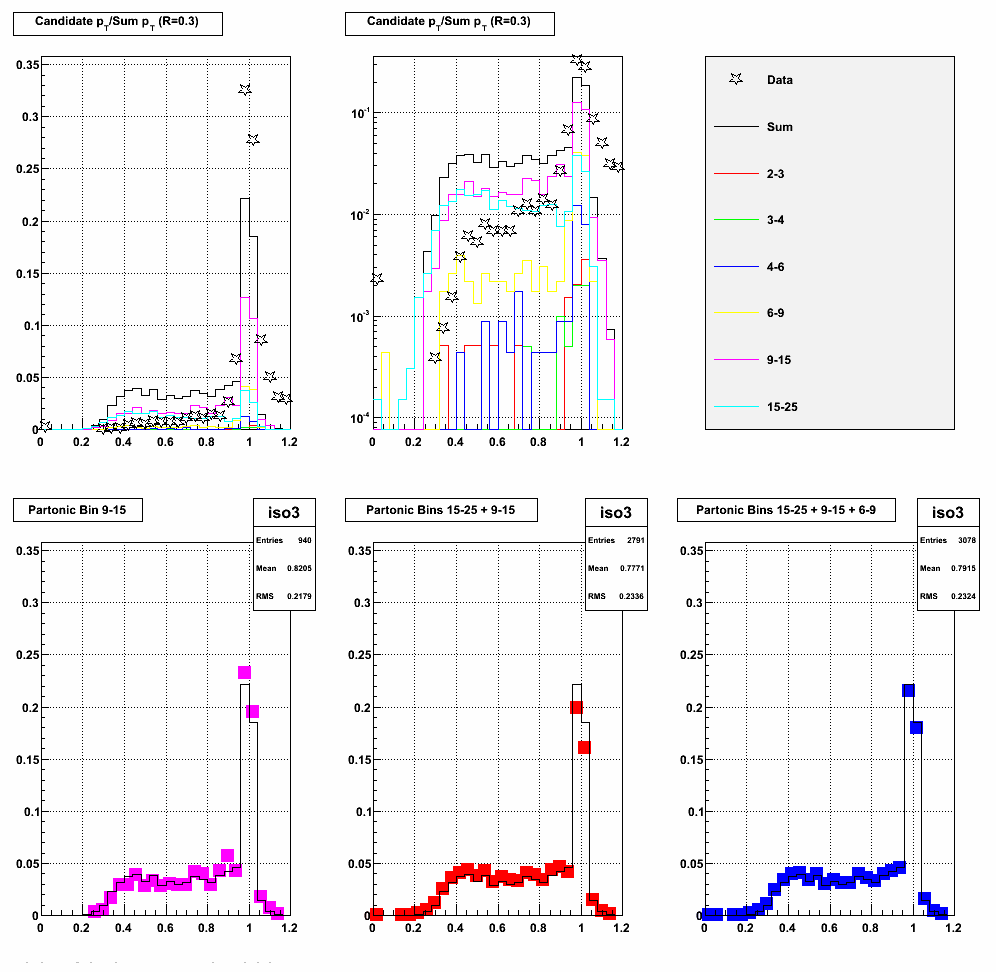
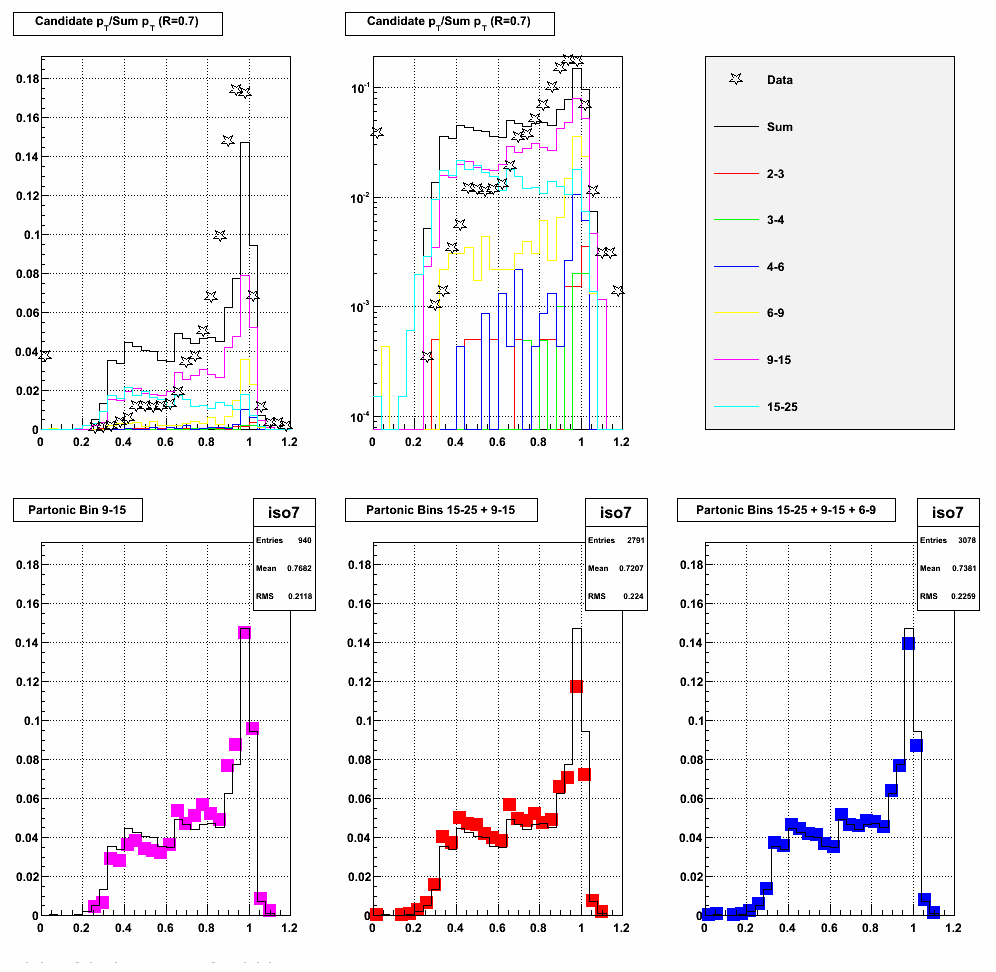
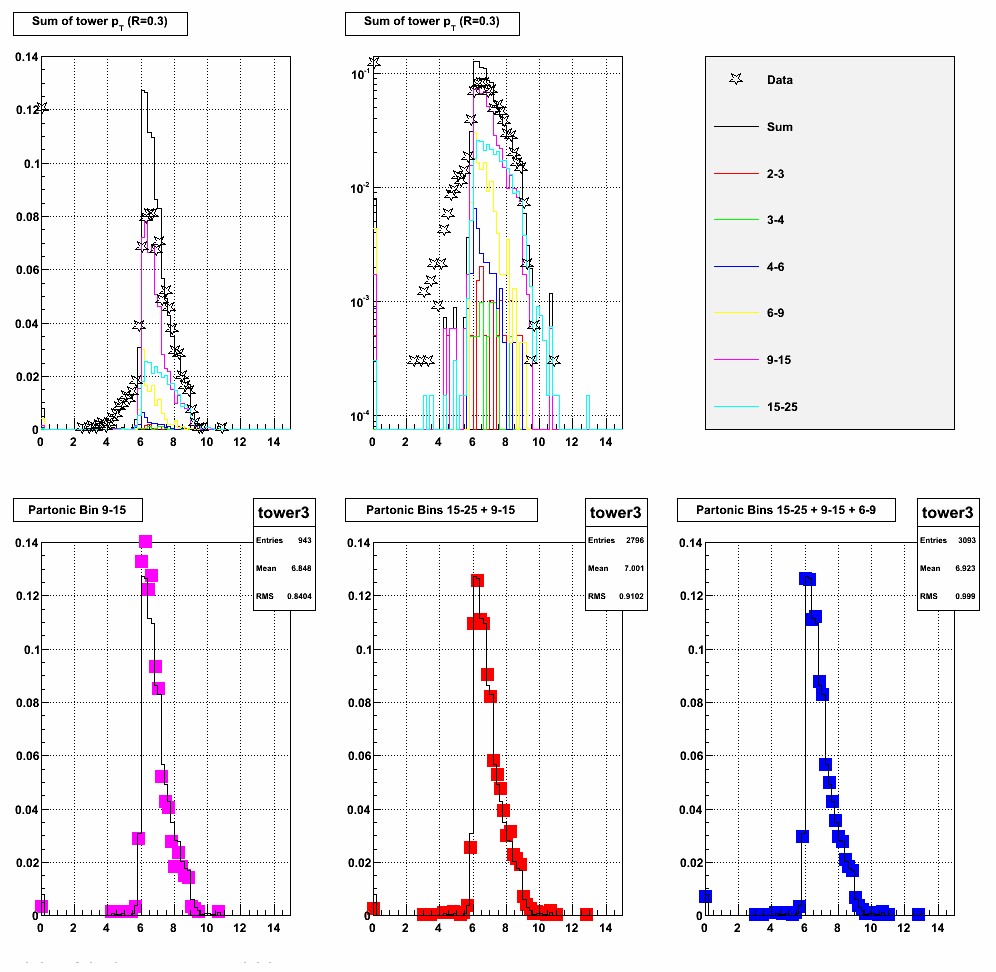
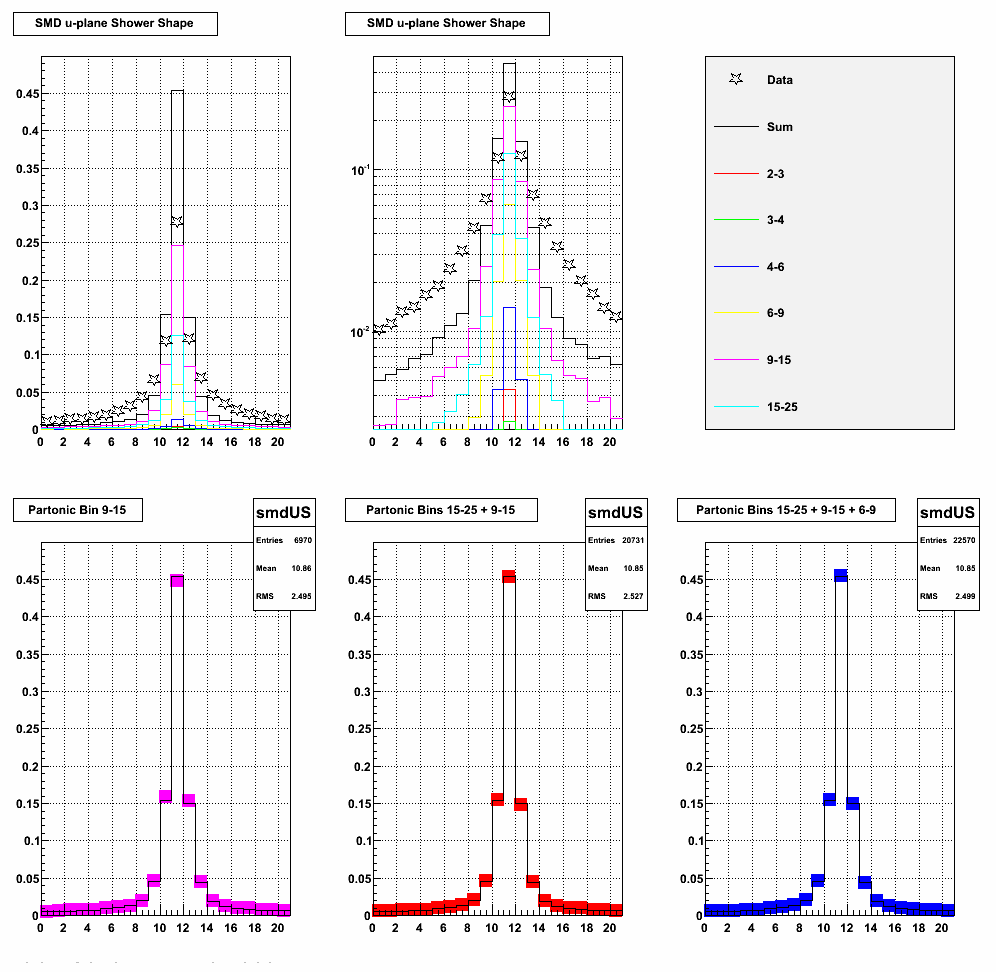
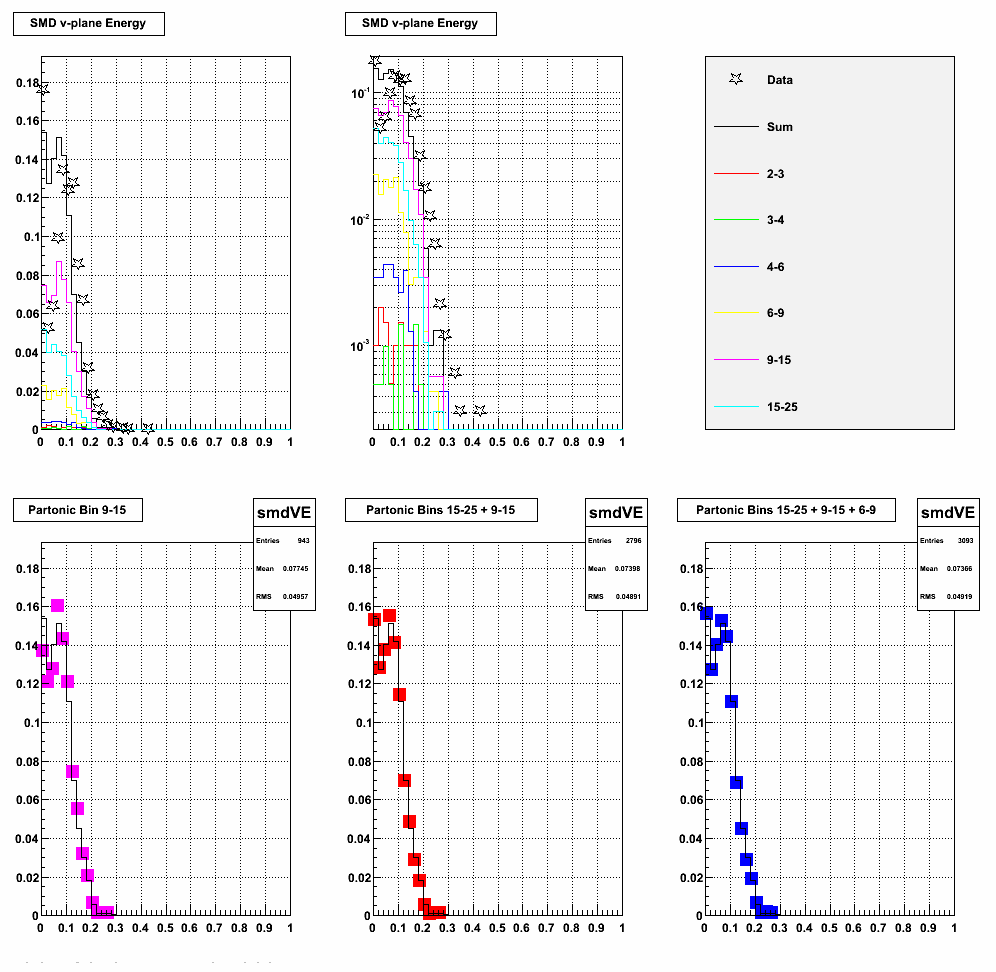
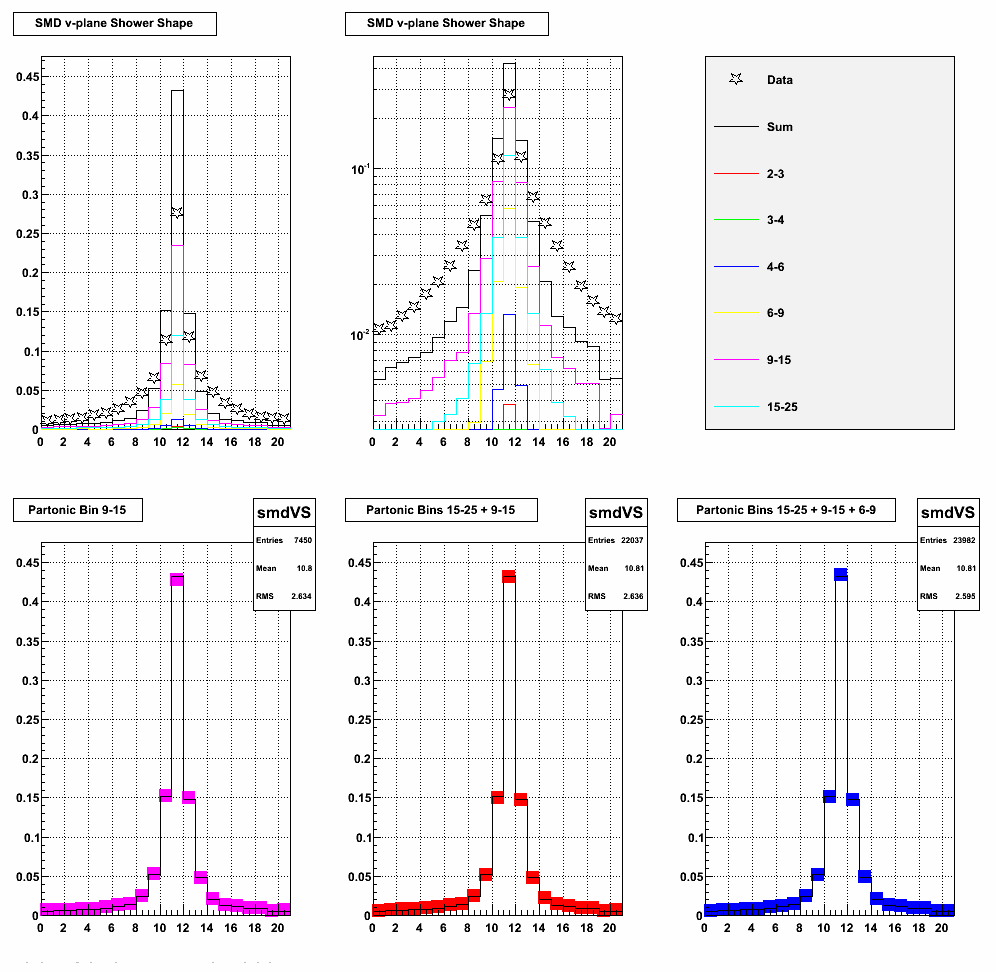
In each series of plots I show:
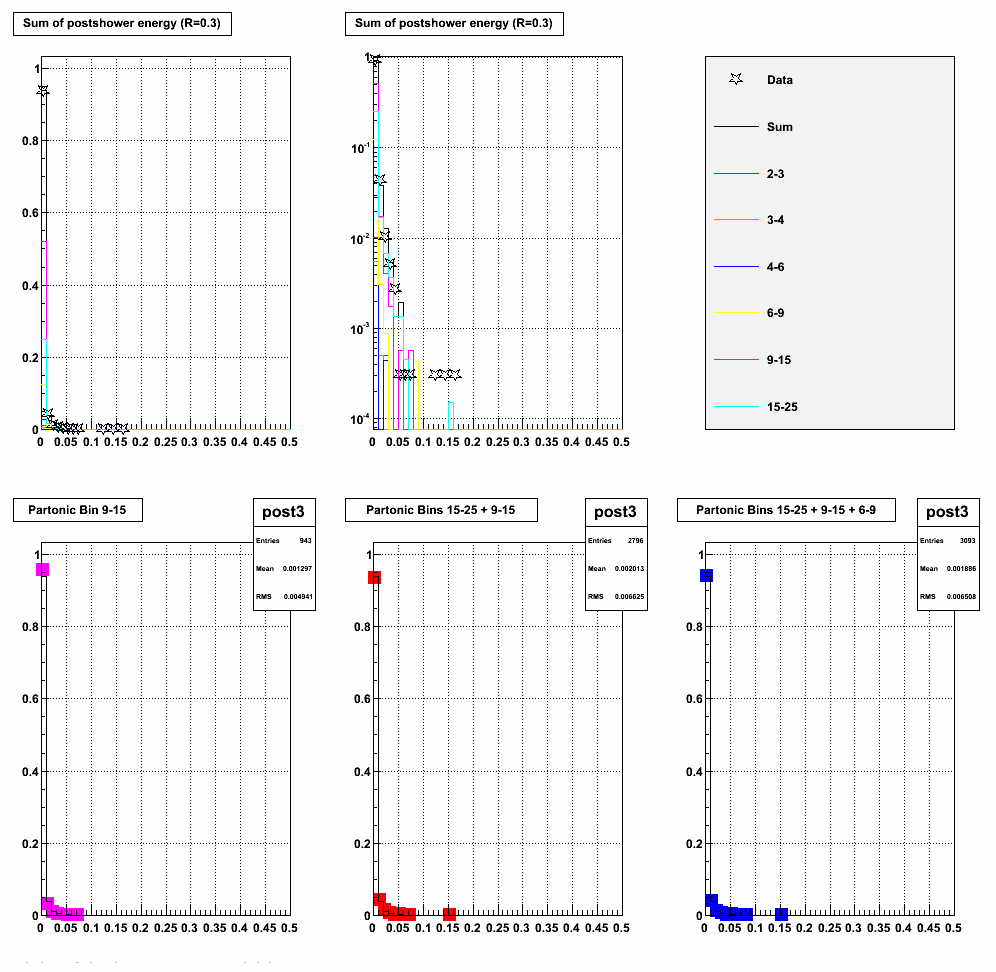
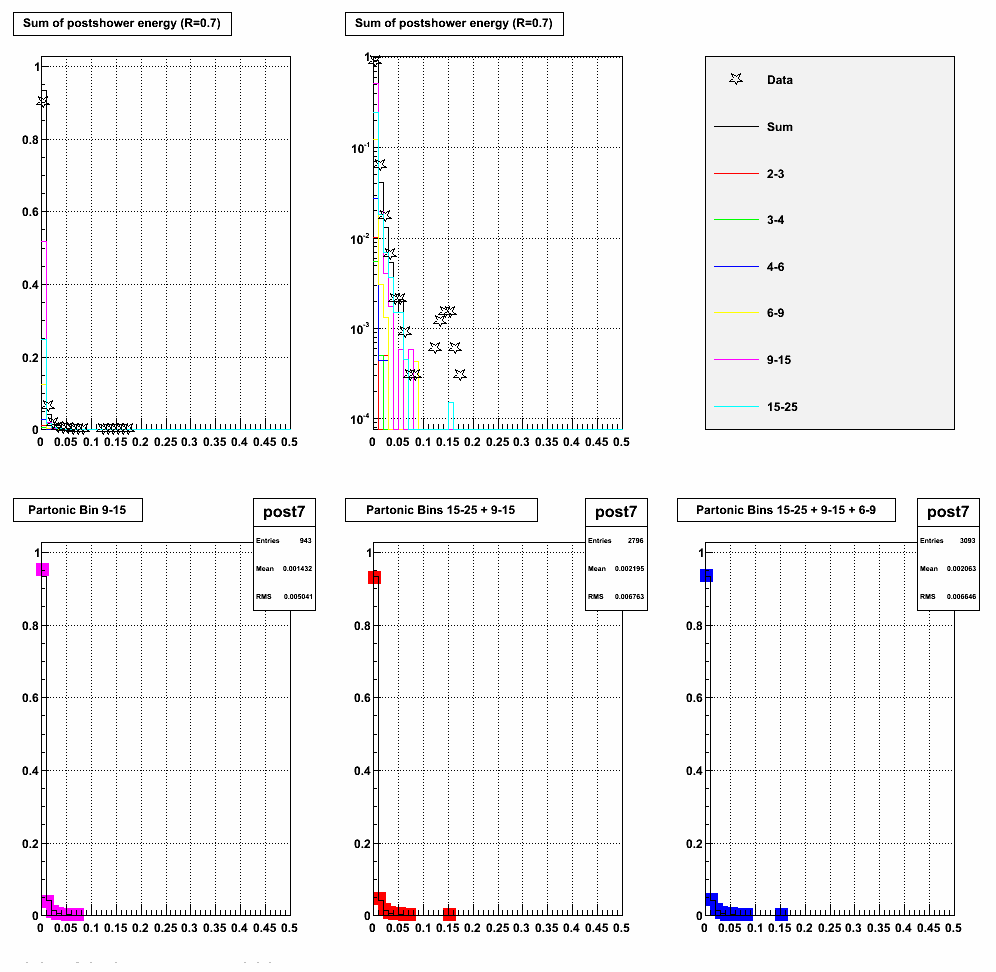
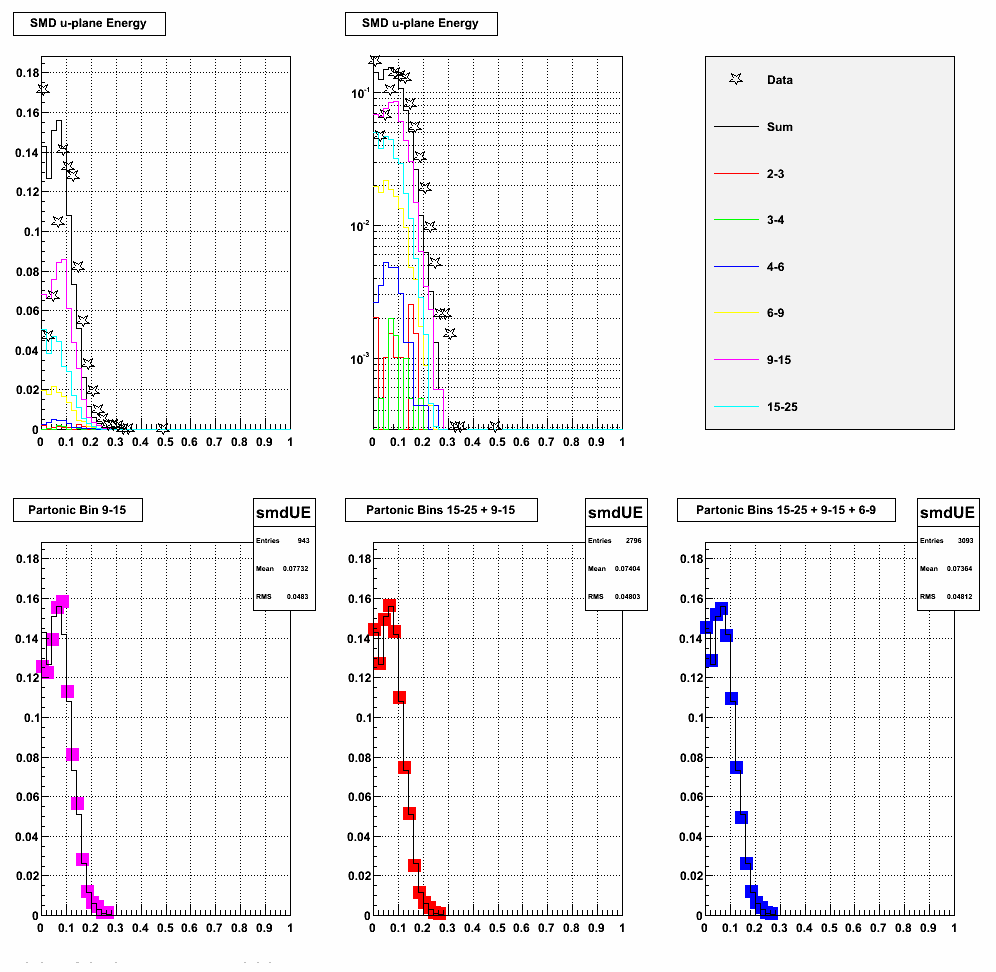
- upper left = sum of MC samples compared to 2006 data, along with contribution from each MC sample, on a linear scale
- upper middle = same as above on log scale
- lower left = sum of MC samples compared to just the 9-15 bin
- lower middle = sum of MC samples compared to 9-15+15-25 added together
- lower right = sum of MC samples compared to 6-9+9-15+15-25 added together
All plots are scaled to an integral of 1.
(1)Candidate pT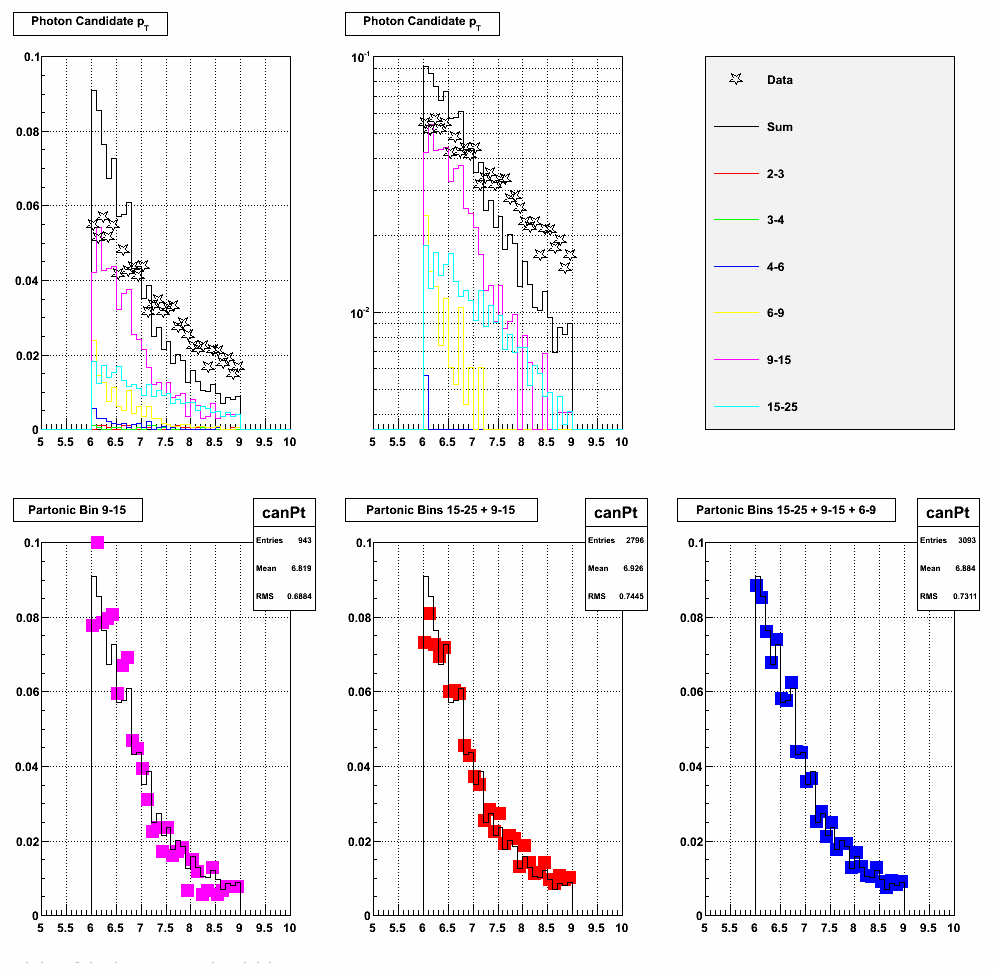
(2)Isolation ratio in a cone of R=0.3 around the candidate
(3)Isolation ratio in a cone of R=0.7 around the candidate:
(4)Tower pT in a cone of R=0.3 around the candidate
(5)Tower pT in a cone of R=0.7 around the candidate
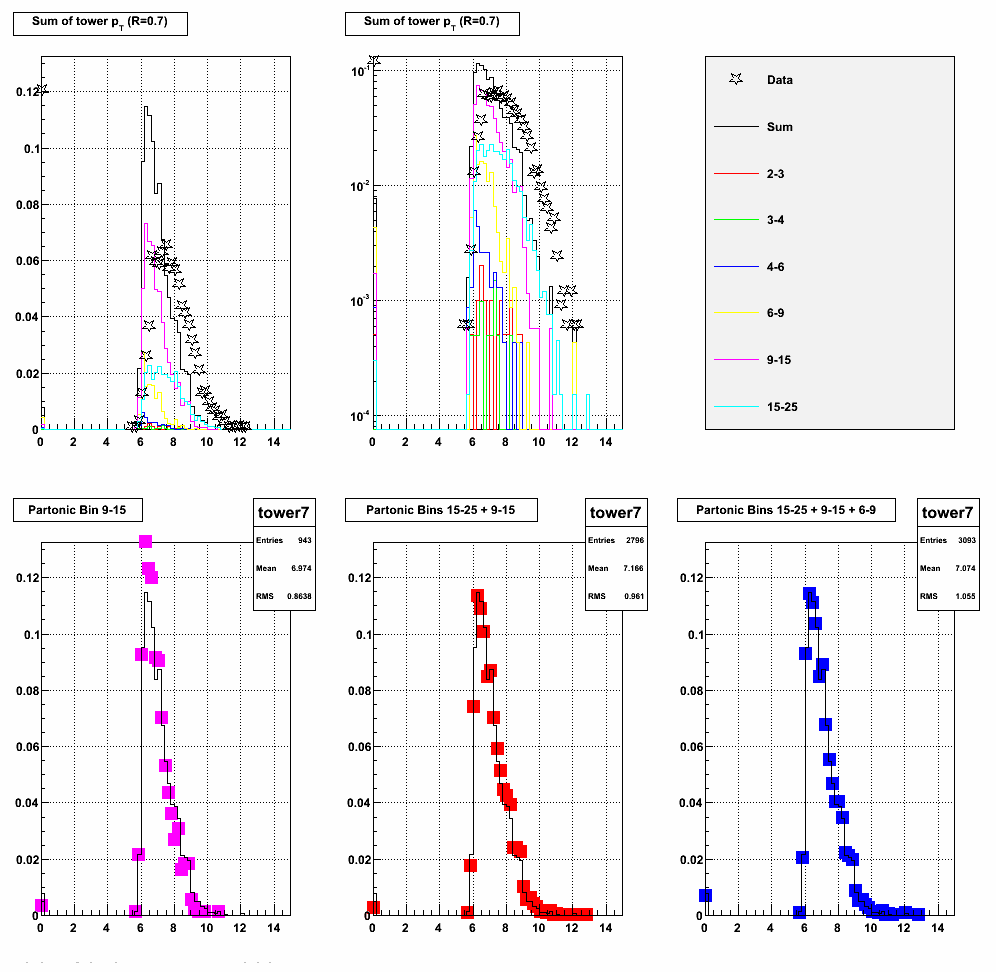
(6)preshower 1 energy in a cone of R=0.3 around the candidate
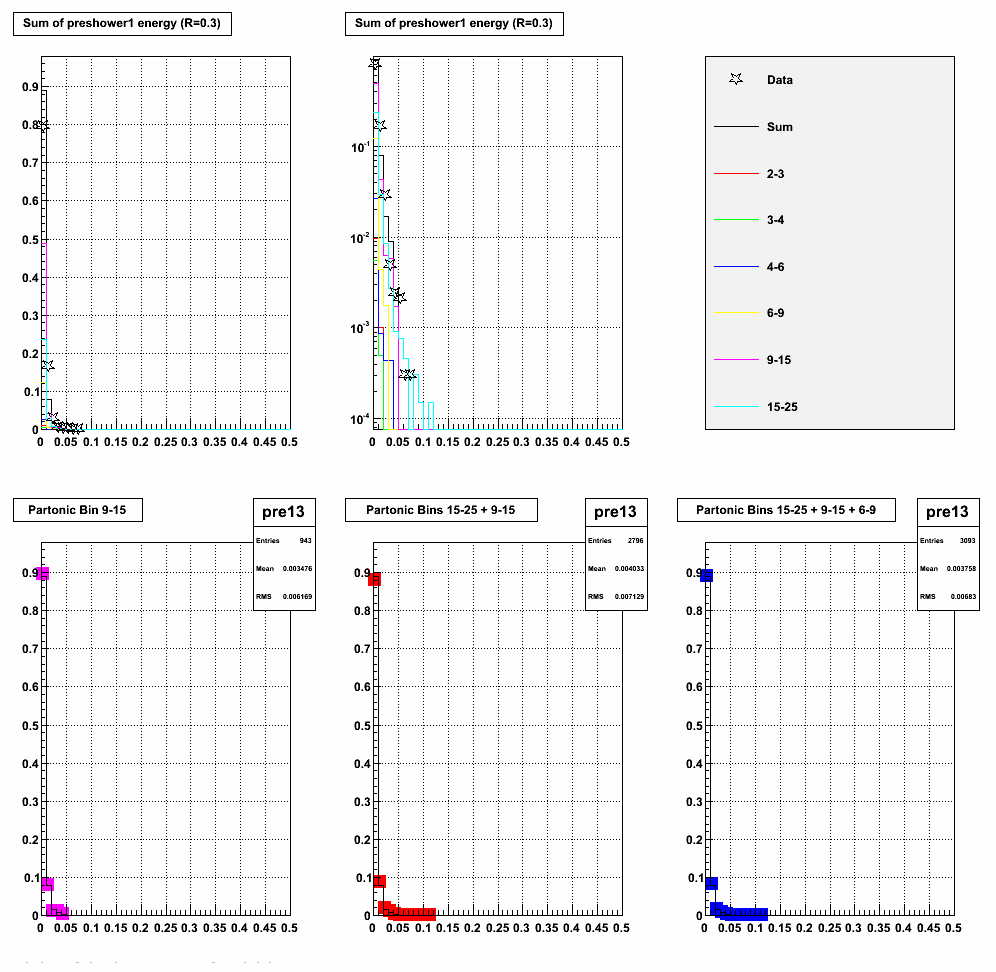
(7)Preshower 1 energy in a cone of R=0.7 around the candidate
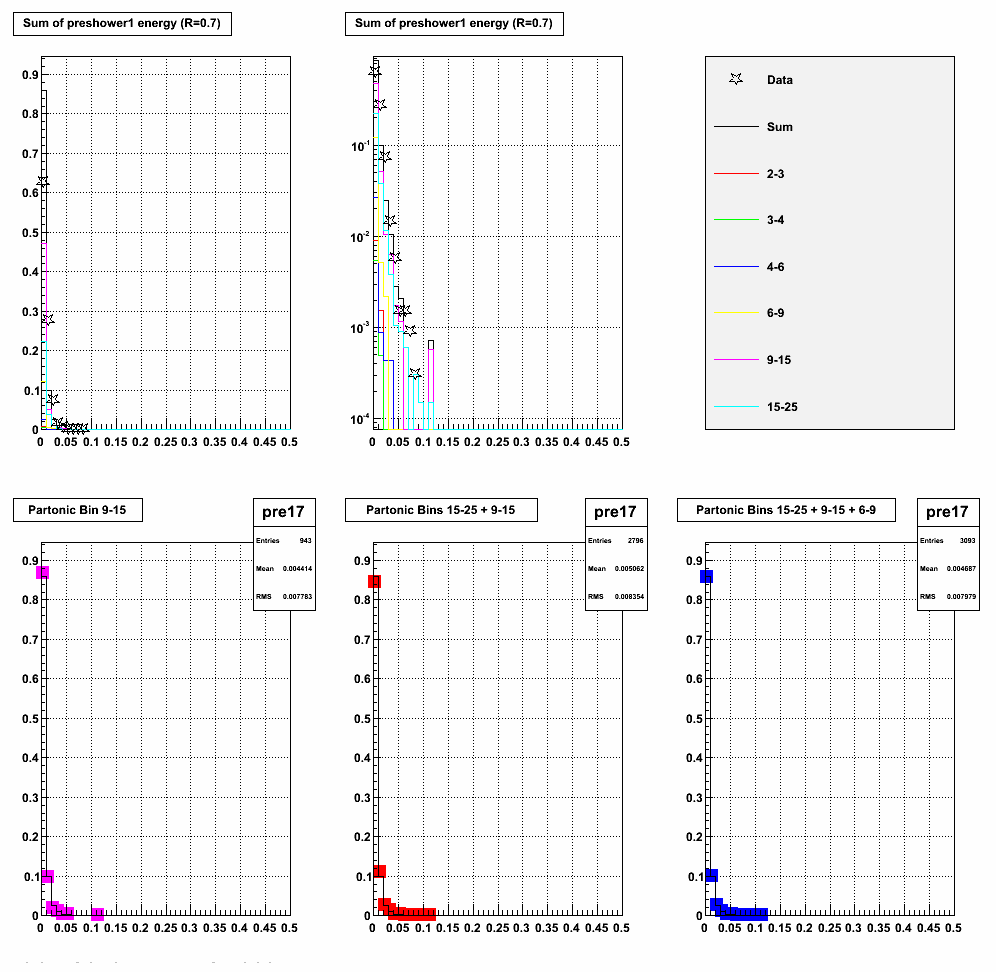
(8)Preshower 2 energy in a cone of R=0.3 around the candidate
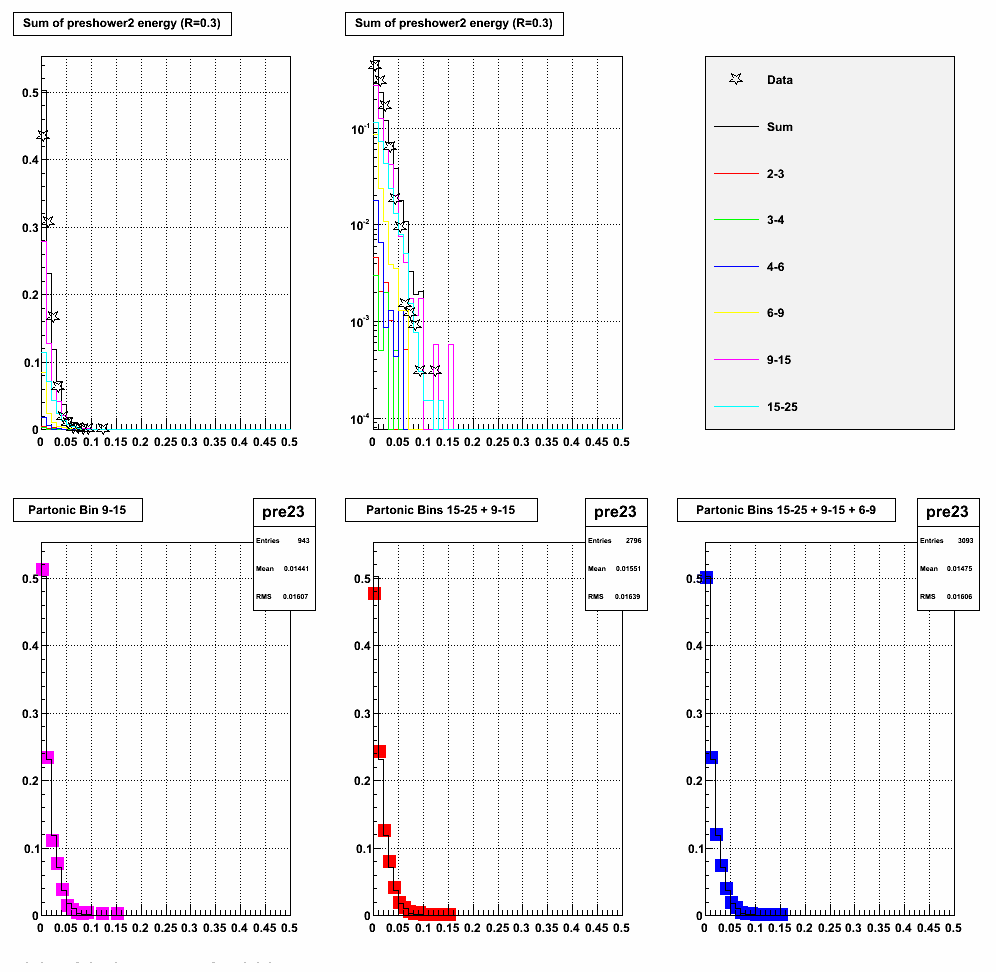
(9)Preshower 2 energy in a cone of R=0.7 around the candidate
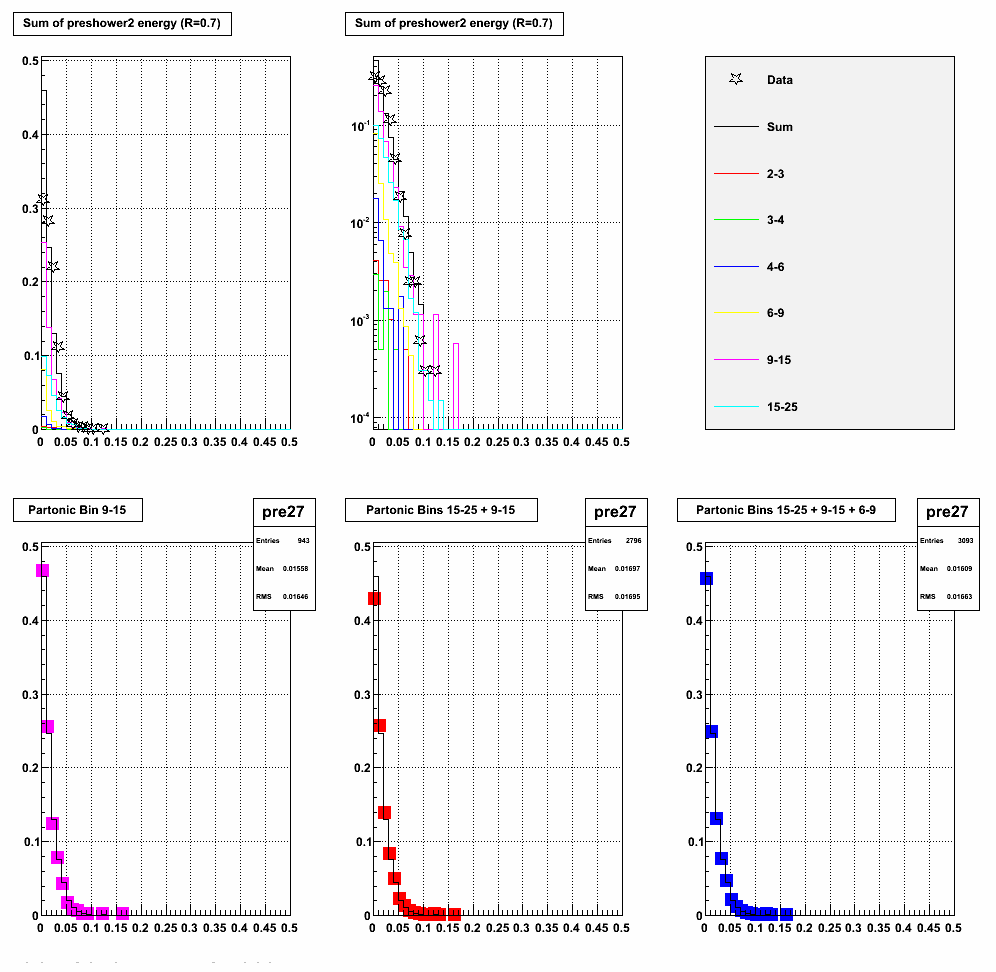
(10)Postshower energy in a cone of R=0.3 around the candidate
(11)Postshower energy in a cone of R=0.7 around the candidate
(12)Smd u-plane energy
(13)Smd u-plane shower shape. Uses a simple shower shape defintion = energy in strip/total smd u-plane energy.
(14)Smd v-plane energy
(15)Smd v-plane shower shape with simple shower shape defintion.
Comments
Based on these tests, it seems that a mimum we should request a sample in the pt range 9-15 with the sample statistics as above. If we can get the second pT range we could request 15-25, but probably with half of the statistics above to end up with comprable statistics for candidates in the 6-9 GeV range as the 9-15 sample.
- aliceb's blog
- Login or register to post comments
