Pt and Eta Dependent Correction form MC Response
Introduction
Jason found in a study described here that using a pT dependent correction for the response of the MC to thrown gammas improved agreement between data and MC. This was based on data that Hal presented at the analysis meeting. A copy of the talk can be found here. Hal found a strong eta dependence as well as pT dependence. Jason's correction was based on one set of eta points (believe eta=1.85). I wanted to check two things:
1)If a redefintion of the correction would help and
2)If an eta-dependent correction would help
Method
I got 3 sets of small MC samples from Hal: eta=1.16, 1.30 and 1.85. The first eta point had 4 pT points while the last 2 each had 7. At each point I made a histogram of:
Response = (pT_true -pT_reco)/pT_reco.
Then I fit the response histogram to find the MPV. I plot the MPV as a function of the mean pT_reco at that point for each eta sample.
The lower eta points show a turnover at low pT. This made finding a common fit function for the response difficult. I ignored this turn over and fit to :
F = p0/(pT_reco-p1)+p2
which fit pretty well over the range pT>3 GeV or so.
Next I looked at how the 3 fit parameters varied with eta and obtained fits of p0,p1,p2 as a function of eta. The result is:
P0 = -1.097*Eta + 3.069
P1 = 34.589*Eta + -68.742
P2 = -0.125*Eta + 0.393
The correction is then pT_corr = pT_reco*(1+F(pT_reco,eta))
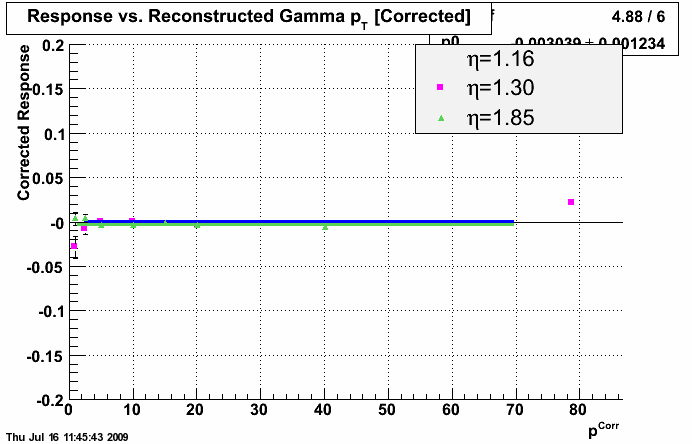
I applied this correction and repeated the study. Plots before and after are below. The correction does a good job for the higher pT range.
Plots
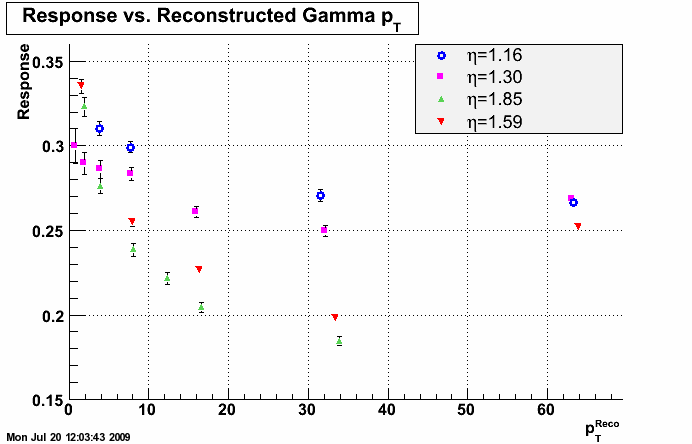
Response as a function of pT_reco before the correction is applied.

Response as a function of pT_reco after the correction is applied. The line is a straight line fit.

Comments
I think it would be useful to have more events at each of the points, and perhaps a range of points around eta=1.4-1.7, to see if the turnover is real. If it is might need to investiage a different fit function above and below some eta range.
Updated Plot
Keith generated more points at eta=1.59. Below I have the new Reponse vs. pT_reco curve. In this case I'm plotting the mean of the response instead of the MPV. This is why the turnover at low pT_reco in low eta bins went away - I think we need more stats to check this. But regardless of if I plot the mean or MPV, when we have a point out near pT_reco = 60, the response shoots up again. This is really weird.

- aliceb's blog
- Login or register to post comments
