A centroid method for ZDC SMD hits
Introduction
Phenix uses a "centroid method" for counting hits in the A_N azimuthal distribution. Their acceptance is shown in the figure below:
The Phenix SMD slats have slightly different dimensions than the STAR slats. Our detector is not quite as "fat." However, their detector still has 7 slats in the x direction and 8 slats in the y direction, with the SMD tilted 45 degrees from vertical.
I could not find a detailed explanation of how the centroid hits are calculated. However there is a PRL from IP12 that the Phenix analysis is based on. This paper states they use the "geometric mean" to find the (x,y) position. I interpret this as:
(1) Get (x,y) position of all hits in the SMD.
(2)Calculated adc-weighted average of the (x,y) position. Convert (x,y) to (r,phi).
The question then becomes "what is the (x,y) position of a slat?" I can come up with no better ideas than using the center of the slat. You have to also take into account that the SMD is tilted and project into a flat (x,y) plane. Given this, the cut that Phenix uses of 0.5<r<4.0 cm seems a bit odd. If I understand correctly, this only cuts out the very middle square of the grid - a cut which is asymmetric in x and y because the x and y slats do not have exactly the same width in the plane. Another issue is that in the figure above the z axis would be pointing out of the page. The STAR SMD on both the east and west sides are defined by a local coordinate system where "left" and "right" are defined by facing the outgoing beam. In that case I think want z to point into the page so that +z points in the direction of forward scattering. They calculate the phi-dependent A_N by using for left-right counts the counts at phi and the counts at phi+pi. Note that this is different than the way we have defined this distribution. Melissa's note used phi=0 in the transverse direction. In my current code I think I'm calculating A_N with counts at phi+pi and phi - i.e. had left and right reversed. I do not know how the Phenix SMD coordinate system is defined. If we continue to see a sign difference in our measured values of A_N it may be defined by a simple swap of what "left" and "right" are.
With all the above points in mind, my goal is to compare the phi distributions with (x,y) defined by the maximum hit and (x,y) defined by the adc-weighted mean. From (x,y) you get r and phi in the usual way - r=sqrt(x**2+y**2) and phi is the angle between them. I will apply a minimum r cut that is meant to cut out the innermost ring of slats in (x,y). I can store hits as both a function of r and phi and explore the radial and phi dependence using both schemes.
Studying the centroid method
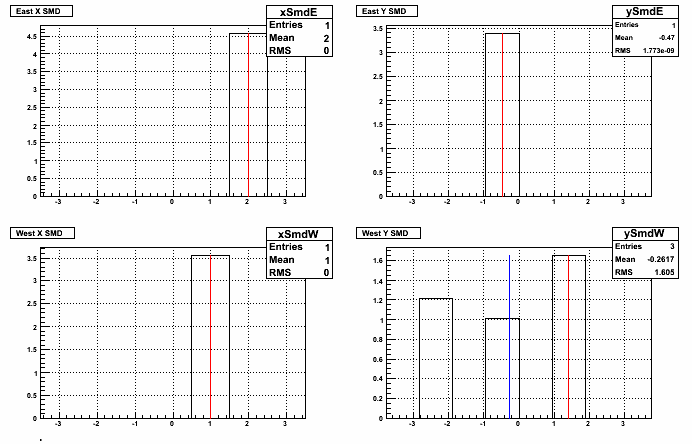
The centroid method assumes that there is only one neutron in the event. Some of us have worried about the validity of this assumption. So first I started looking at the distribution of hits and comparing the adc-weighted mean to the maximum slat for some random events. Shown are the adc values versus the x (or y) of the center of the X (or Y) slat. The red line shows the position of the maximum adc value and the blue line shows the position of the adc-weighted mean - if they are the same you will see only the red line. I ran over one trigger file (10,000) events for a run taken on day 71. Also, for the record, I'm using the pedestal- and gain-corrected adc values. I do not include in the summation strips which end up having an adc value<0 after the ped and gain corrections.
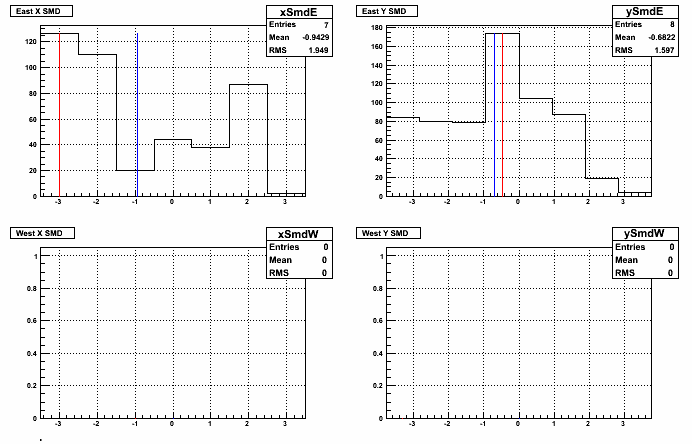
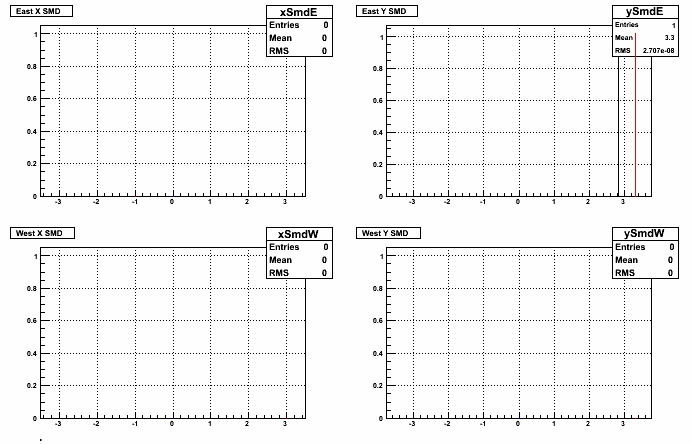
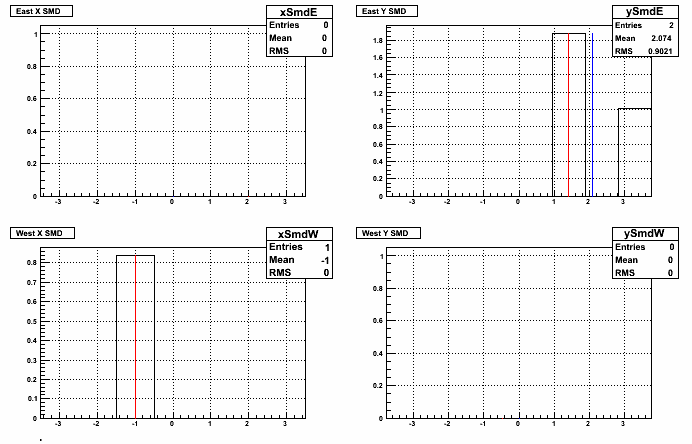
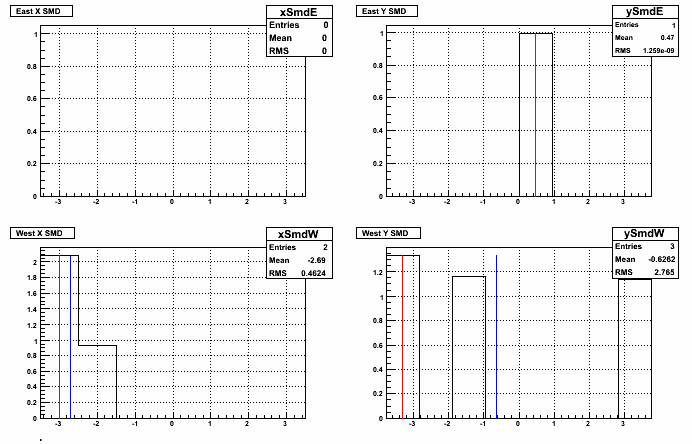
I also tried to make some "shower shapes" like we do in the endcap photon analyses. I plot (adc value)/(sum of adc value) for the maximum-adc slat and up to 4 slats on either side. In these plots the maximum is always at position 5.
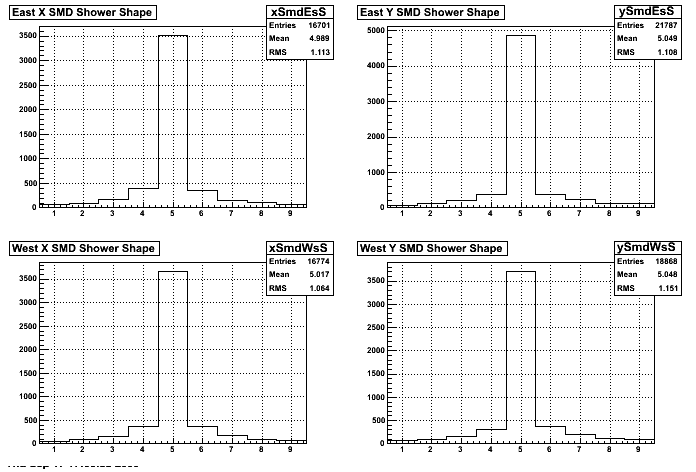
These are all strongly peaked and don't show any evidence for a second neutron hit occuring in a significant number of events. I conclude that the assumption of only one neutron per event is reasonable.
Modified Code
I modified by zdcAna_TrS to compute r,phi and then put in appropriate histograms. Also significantly cleaned this up. It's much closer to being like a maker now, which is what we probably want eventually. Also in case code gets archived for publication. Re-running day 71. Then what is left to do is modify ana_spinAsym to read in things in r,phi bins and make a bunch of plots that way.
Some Plots
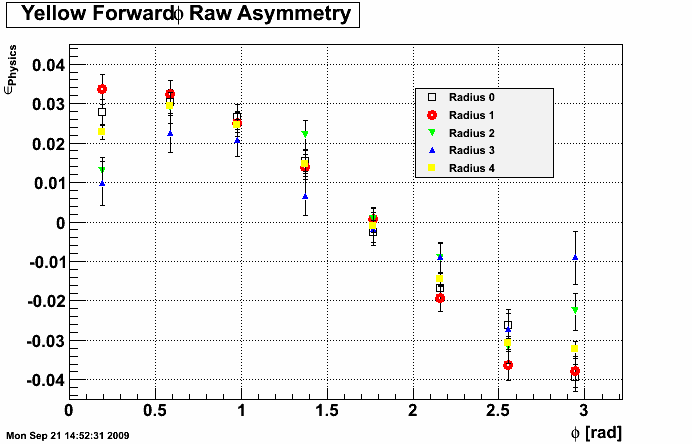
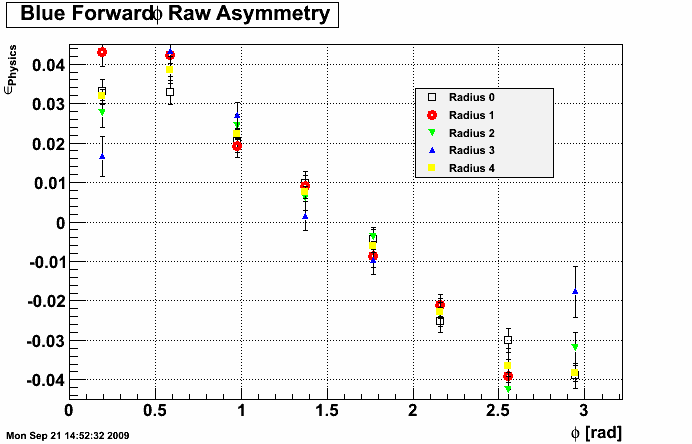
I ran over day 71 and made plots of the phi asymmetry in different radial bins. In the plots radius 0 is the innermost radius. Radii 1, 2, and 3 move outward and radius 4 is the sum of all together.
Yellow beam:
Blue Beam:
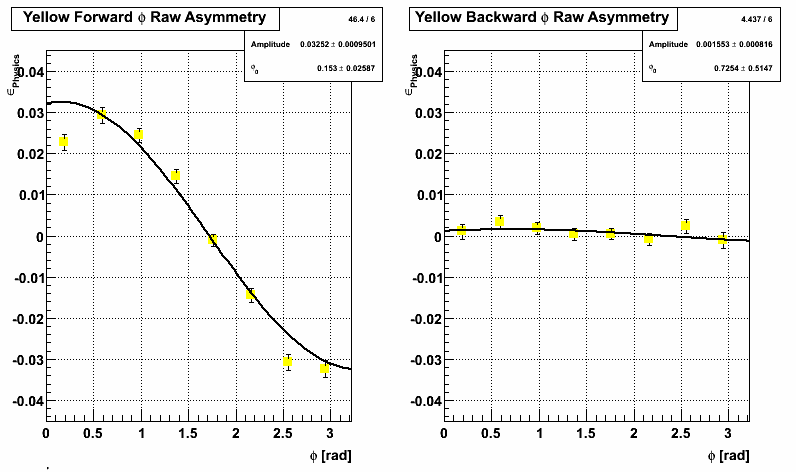
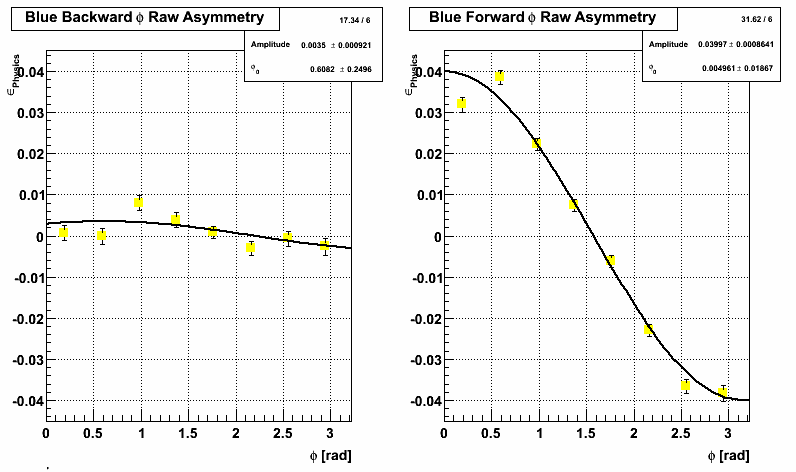
Now to compare, I fit for A_N using the sum of all radii (radius 4 in the pics above) points. Top plot with yellow points and black line is using the centroid method and bottom plot with black points and red line is using the old slat method.
Yellow Beam:

Blue Beam:

Conclusions
-Getting the acceptance in r and phi just right using this method is hard - I'm still not sure I have this correct.
-Highest analyzing power is seen in the innermost radii.
-Using the centroid method seems to result in a higher observed analyzing power.
- aliceb's blog
- Login or register to post comments
