- dilks's home page
- Posts
- 2019
- 2018
- December (1)
- November (1)
- October (1)
- August (2)
- July (4)
- June (3)
- May (1)
- April (2)
- March (2)
- February (1)
- January (5)
- 2017
- December (3)
- November (1)
- October (2)
- September (3)
- August (2)
- July (2)
- June (1)
- May (2)
- March (3)
- February (3)
- January (3)
- 2016
- November (2)
- September (4)
- August (2)
- July (6)
- June (2)
- May (3)
- April (1)
- March (2)
- February (3)
- January (2)
- 2015
- December (3)
- October (3)
- September (2)
- August (6)
- June (3)
- May (3)
- April (4)
- March (3)
- February (5)
- January (3)
- 2014
- December (1)
- November (1)
- October (3)
- September (4)
- August (3)
- July (3)
- June (2)
- May (2)
- April (2)
- March (1)
- 2013
- 2012
- 2011
- My blog
- Post new blog entry
- All blogs
Cherenkov Shower Studies
I have been looking at the development of the EM shower in a small FMS cell for normally incident photons.
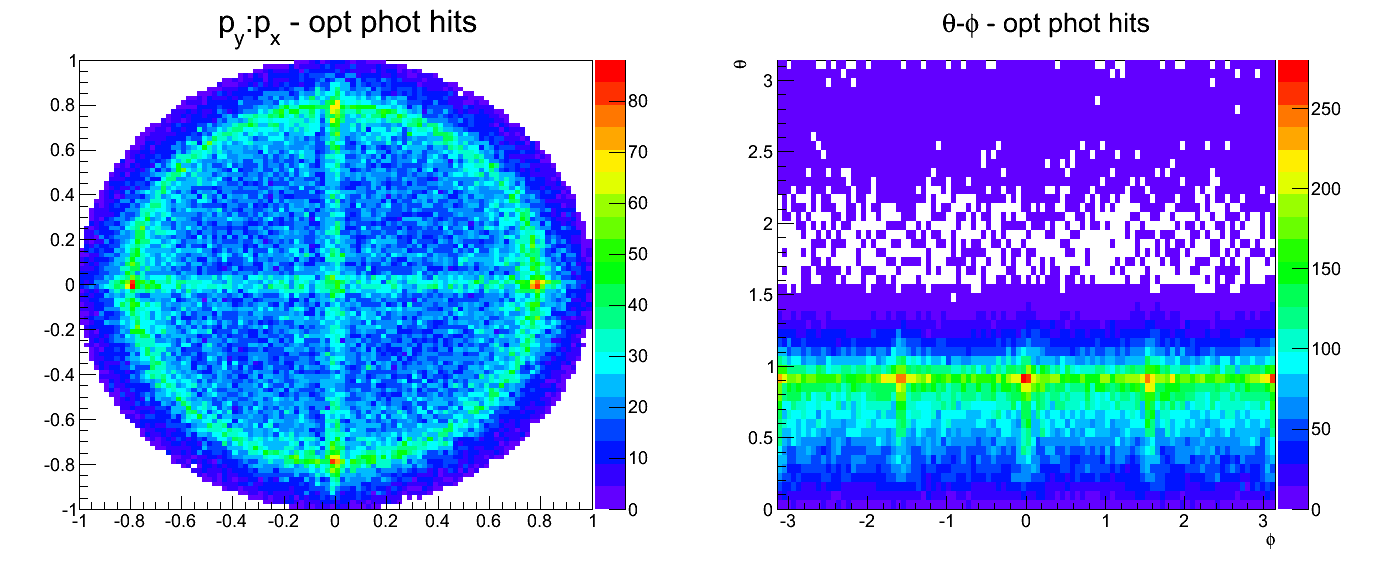
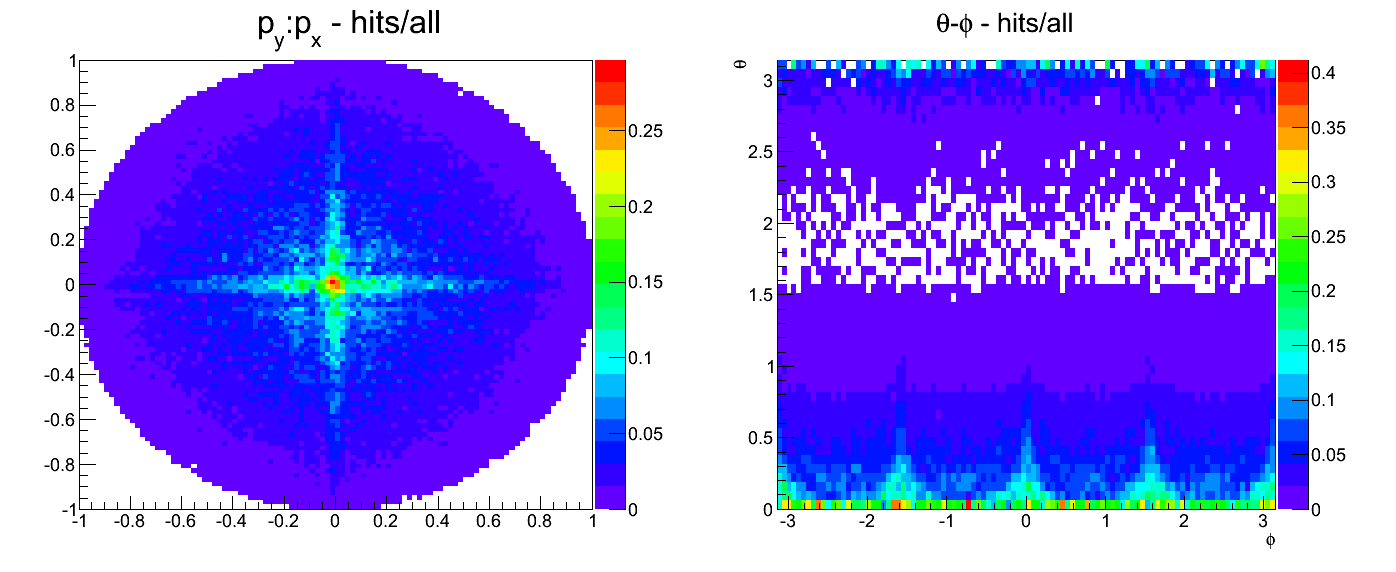
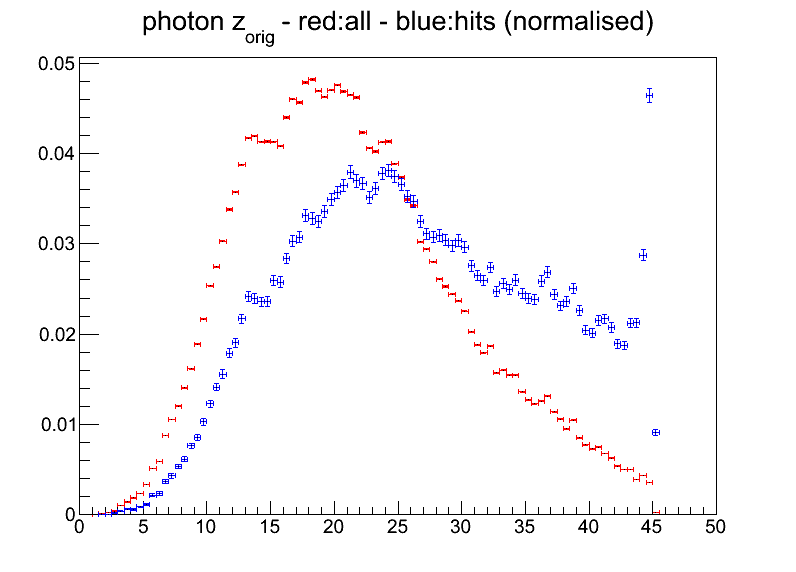
The following figures 1-3 show:
- Left: transverse components px and py of the normalised momentum direction vector of the optical photons at their production points
- Right: angular components θ and ϕ of this momentum vector
Figure 1 is for all optical photons, 2 for optical photons that hit the photocathode, and 3 for the ratio of optical photons that hit to all produced optical photons. The plots are for 10 successive normally incident photons with E=30 GeV.
In figure 1, There is a clear band at θ~0.9; this band corresponds directly to the Cherenkov angle (for n=1.65, θcer~0.92). In figure 2, there is some interesting structure in ϕ that reflects the geometry of the cell. Along the central vertical and horizontal axes of the cell, there are peaks in the Cherenkov band. Figure 3 shows additionally that photons produced along these central axes have a higher chance of hitting the photocathode. A lot less photons in the Cherenkov band reach the photocathode than I expected.
Figure 1:

Figure 2:

Figure 3:

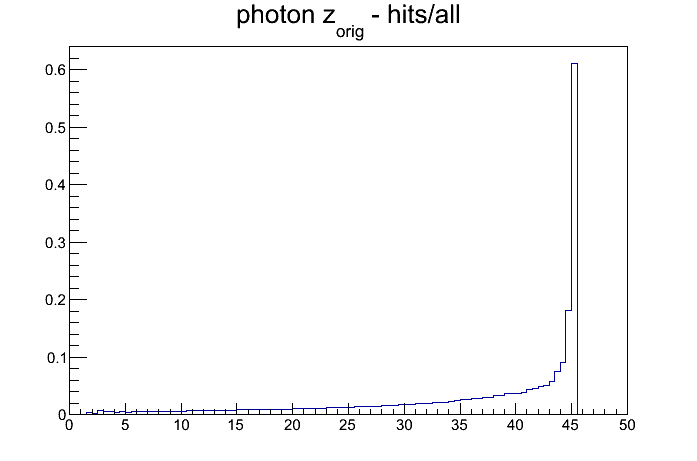
Figure 4 shows the production location of the photons in the z direction in cm (the distributions are normalised). Red is for all produced optical photons and blue is for hits. Figure 5 shows the ratio of hits to all produced opt. photons.
The photons that hit the photocathode admit a shower max peak that is shifted ~15% closer to the photocathode than the peak for all produced photons.
Up to 40 cm in the cell, only 4% of the produced photons are detected; this quickly rises to 60% at the end of the cell at 45 cm.
Figure 4:

Figure 5:

- dilks's blog
- Login or register to post comments
