- dilks's home page
- Posts
- 2019
- 2018
- December (1)
- November (1)
- October (1)
- August (2)
- July (4)
- June (3)
- May (1)
- April (2)
- March (2)
- February (1)
- January (5)
- 2017
- December (3)
- November (1)
- October (2)
- September (3)
- August (2)
- July (2)
- June (1)
- May (2)
- March (3)
- February (3)
- January (3)
- 2016
- November (2)
- September (4)
- August (2)
- July (6)
- June (2)
- May (3)
- April (1)
- March (2)
- February (3)
- January (2)
- 2015
- December (3)
- October (3)
- September (2)
- August (6)
- June (3)
- May (3)
- April (4)
- March (3)
- February (5)
- January (3)
- 2014
- December (1)
- November (1)
- October (3)
- September (4)
- August (3)
- July (3)
- June (2)
- May (2)
- April (2)
- March (1)
- 2013
- 2012
- 2011
- My blog
- Post new blog entry
- All blogs
Pb Glass Spectrometry
We have selected two radiation-damaged cells to test the extent to which solar ultraviolet radiation reverses the damage. One large and one small cell were tested and compared to a large and a small undamaged sample.
The transmittance is measured by passing collimated light generated from a ~100 μW deuterium source and a ~1.3 mW halogen source (both temperature-controlled) transversely through the cell and into a photospectrometer. The light is guided from the source to a collimator by a multimode optical fiber, into the cell, and then into another optical fiber leading to the spectrometer. The spectrometry was performed in the instrumentation division at BNL, with the assistance of Thomas Tsang.
For all the samples, the transmittance as a function of wavlength was measured through three positions: near the front of the cell, near the middle, and near the back (where back refers to the end closest to the PMT). For the large cell, the front and back transmittances were measured 3 inches from the cell ends; for the small cell, they were measured 1 inch from the cell ends.
The transmittance as a function of wavlength plots are normalised such that the average transmittance for wavelength>900nm (and less than max reported wavlength of 976nm) is unity.
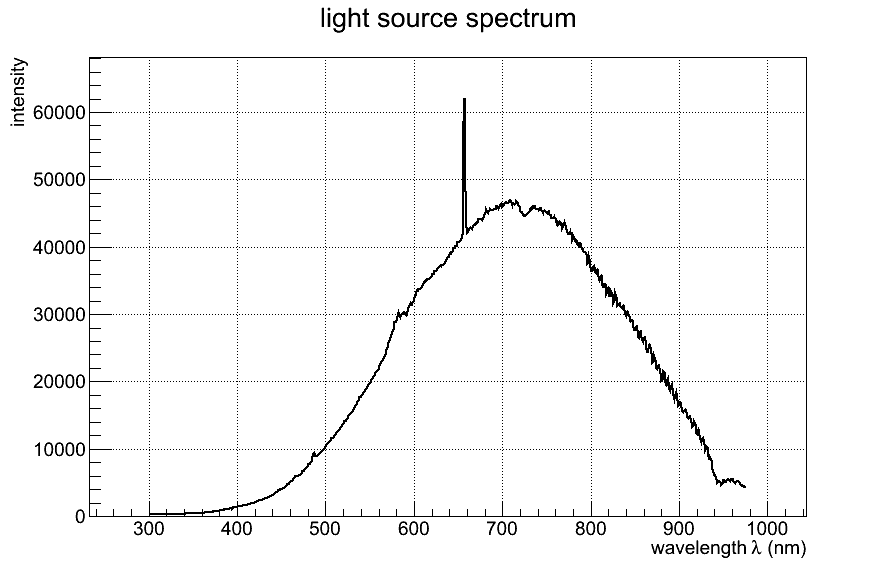
Figure 1: spectrum of light source, measured with no cell present (i.e. transmission of collimated beam through air). A deuterium emission spike is observed at ~656 nm; this spike is saturated in the spectrum and is observable in the transmittance vs. wavelength plots below. All other measured points are well beneath the saturation limit.
.
.
.
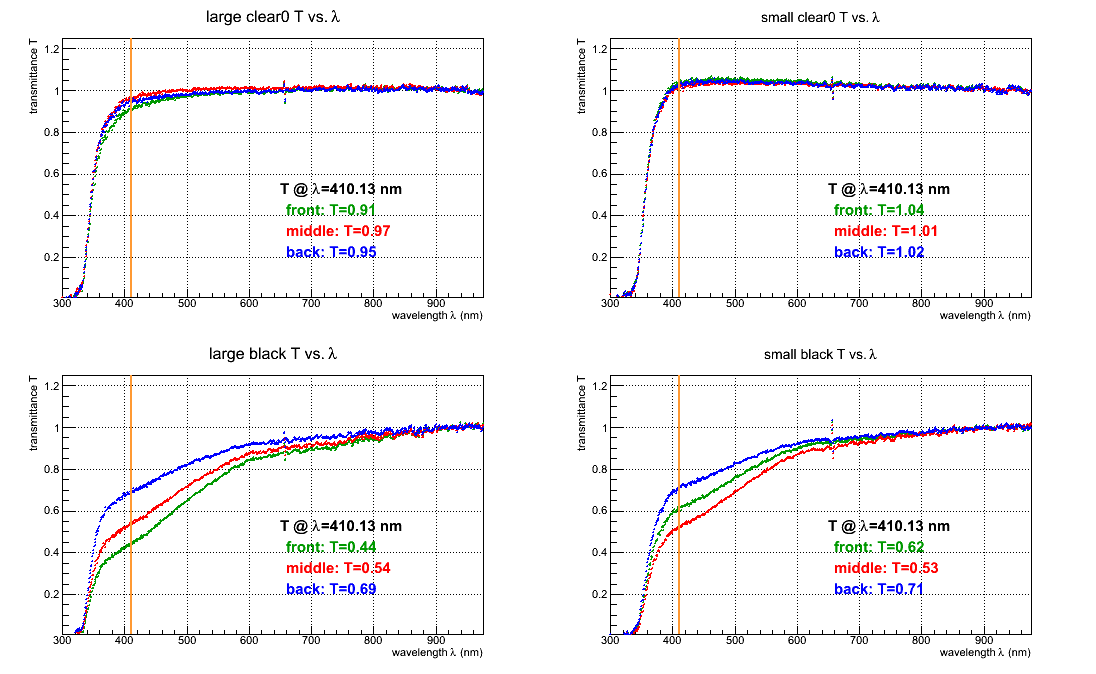
Figure 2: Radiation-damaged cells transmittance vs. wavelength for three measurements compared to clear sample measurement taken within the same hour. Top row is the clear sample, bottom row is the damaged sample; left column is large cell, right column is small cell. The three positions (front, middle, and back) are compared and the transmittances at wavelength 410nm for each position are reported; the vertical orange line is drawn at this wavelength.
.
.
.
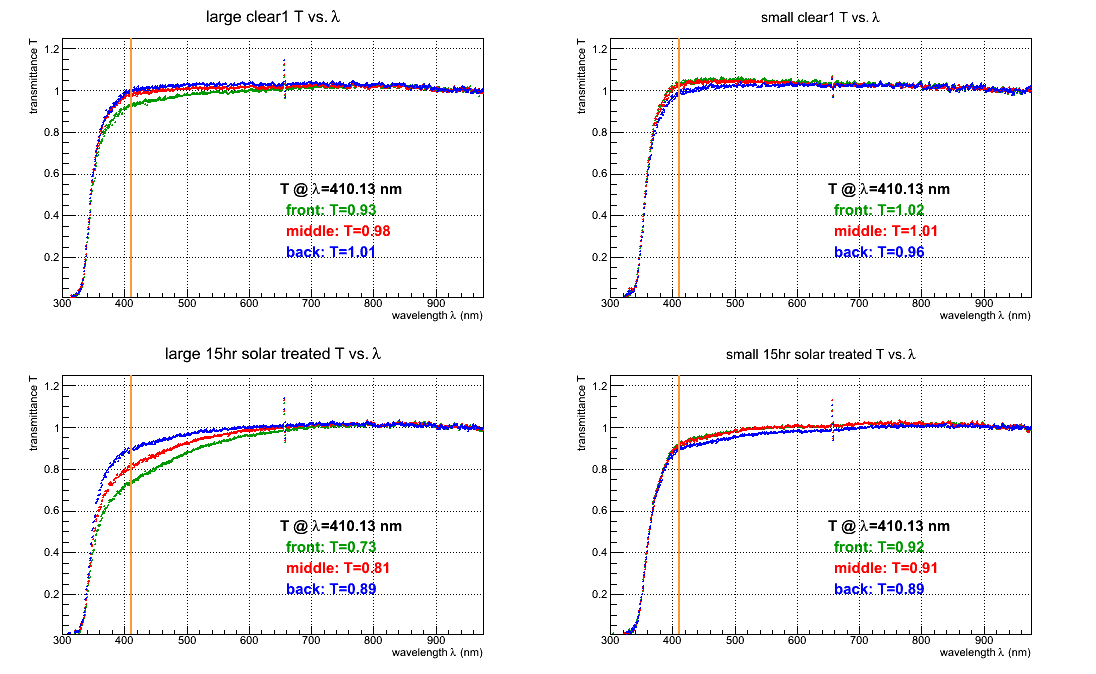
Figure 3: The damaged cells were then left in direct sunlight for ~15 hrs. This figure shows a comparison of the transmittance through the treated cells to the clear samples (all measured within the same hour).
.
.
.
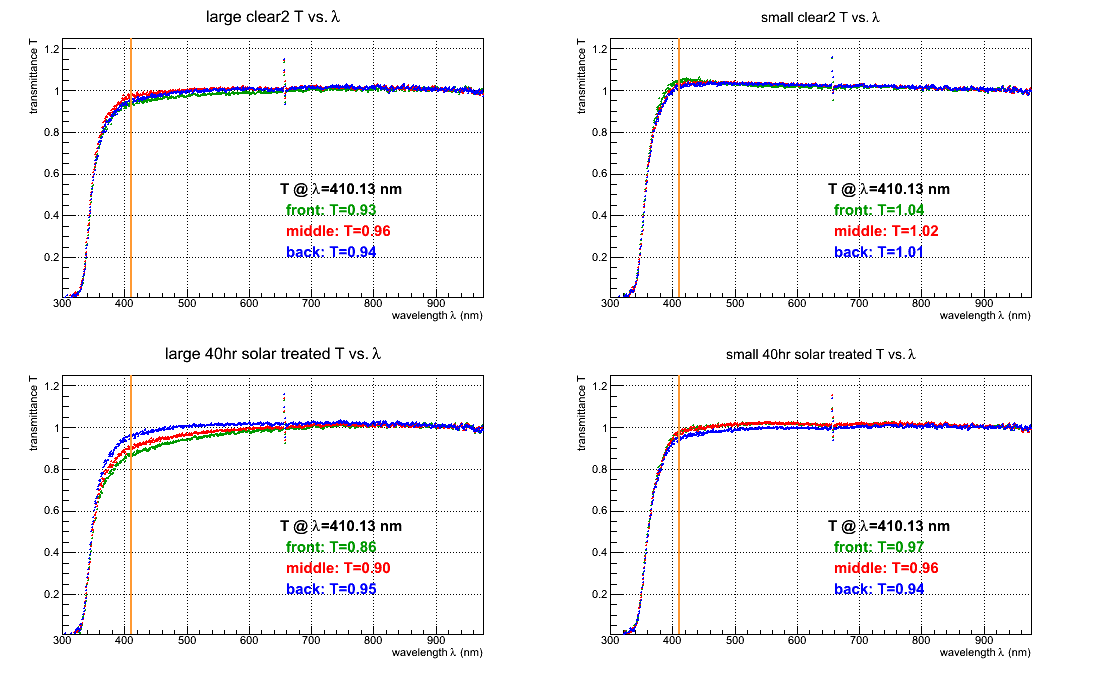
Figure 4: The damaged cells were then left in direct sunlight for ~40 hrs. This figure shows a comparison of the transmittance through the treated cells to the clear samples (all measured within the same hour).
.
.
.

Figure 5: Ratio of radiation-damaged cell transmittance to clear cell transmittance as a function of wavelength, with ratios at 410nm reported.
.
.
.

Figure 6: Ratio of 15hr solar-treated cell transmittance to clear cell transmittance as a function of wavelength, with ratios at 410nm reported.
.
.
.

Figure 7: Ratio of 40hr solar-treated cell transmittance to clear cell transmittance as a function of wavelength, with ratios at 410nm reported.
.
.
.
.png)
Figure 8: A rearrangement of the data shown in figures 2-4 to show the the overall progress of the radiation damage reversal. Top row is front position measurement, middle row is middle position, and bottom row is back position. Two clear cell measurements are shown since two were performed (one within the same hour as the radiation-damaged cell measurement (black) and the other as the 15hr treated cell measurement (treat1))
.
.
.
.
.
Photographs
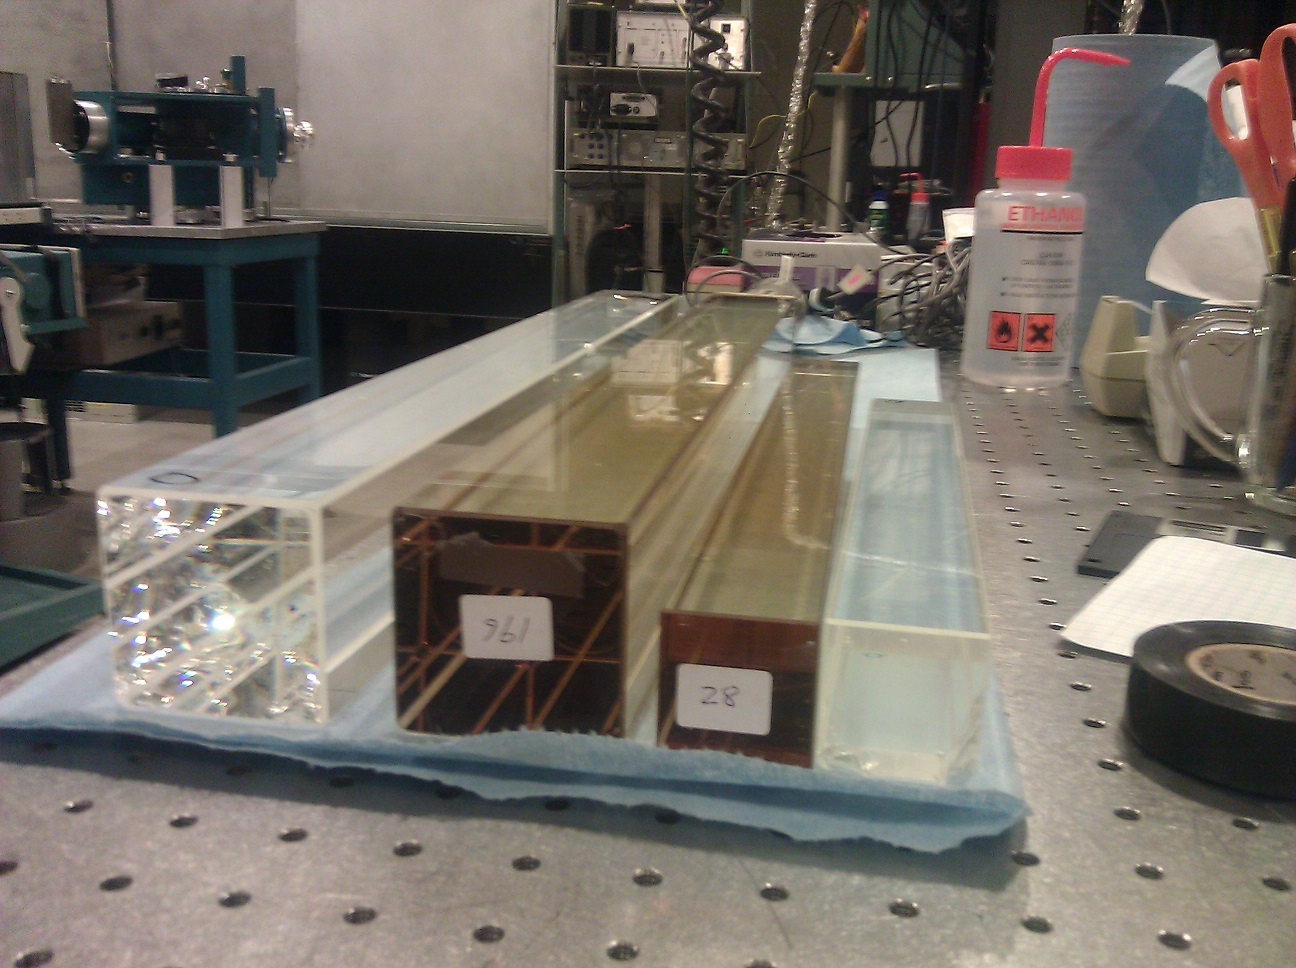
Photo 1: Radiation damaged samples (labelled 196 (upside-down) and 28) compared to clear reference samples; no solar treatment has been done yet
.
.
.
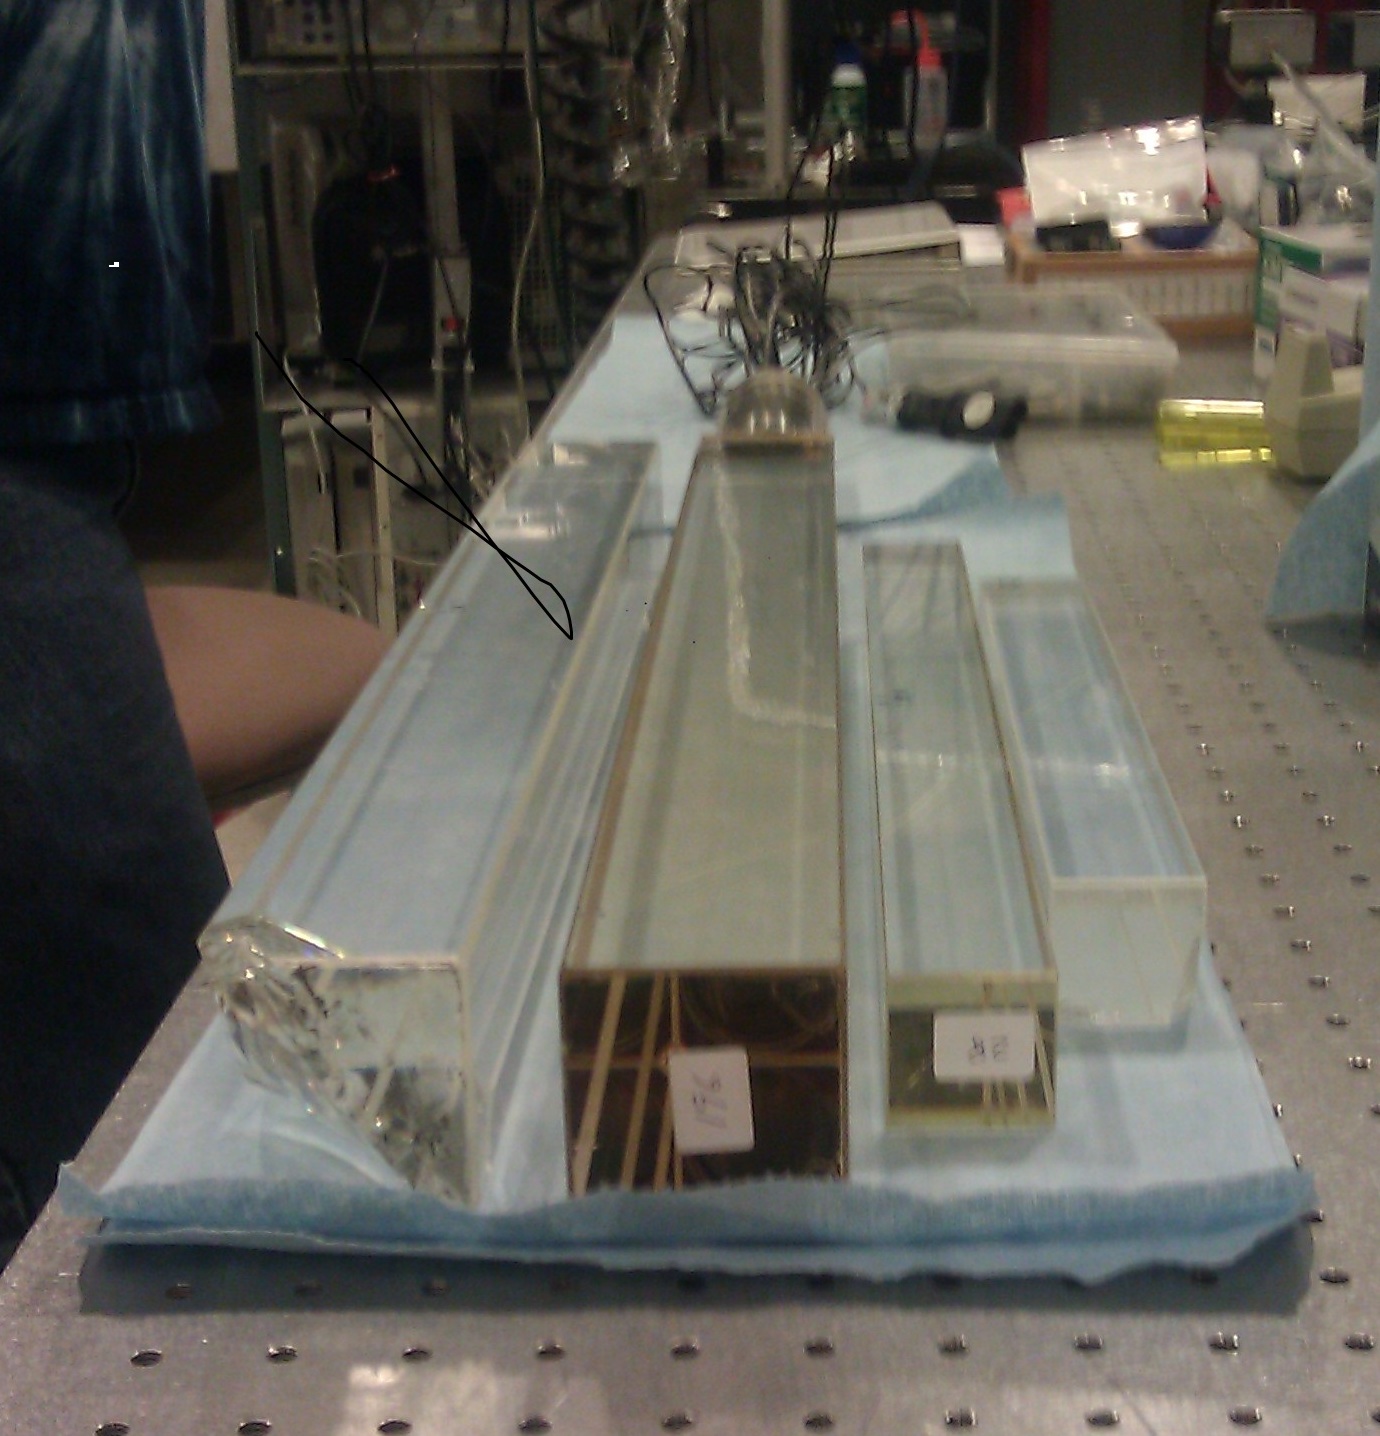
Photo 2: Samples after ~15 hrs exposure to sunlight
.
.
.
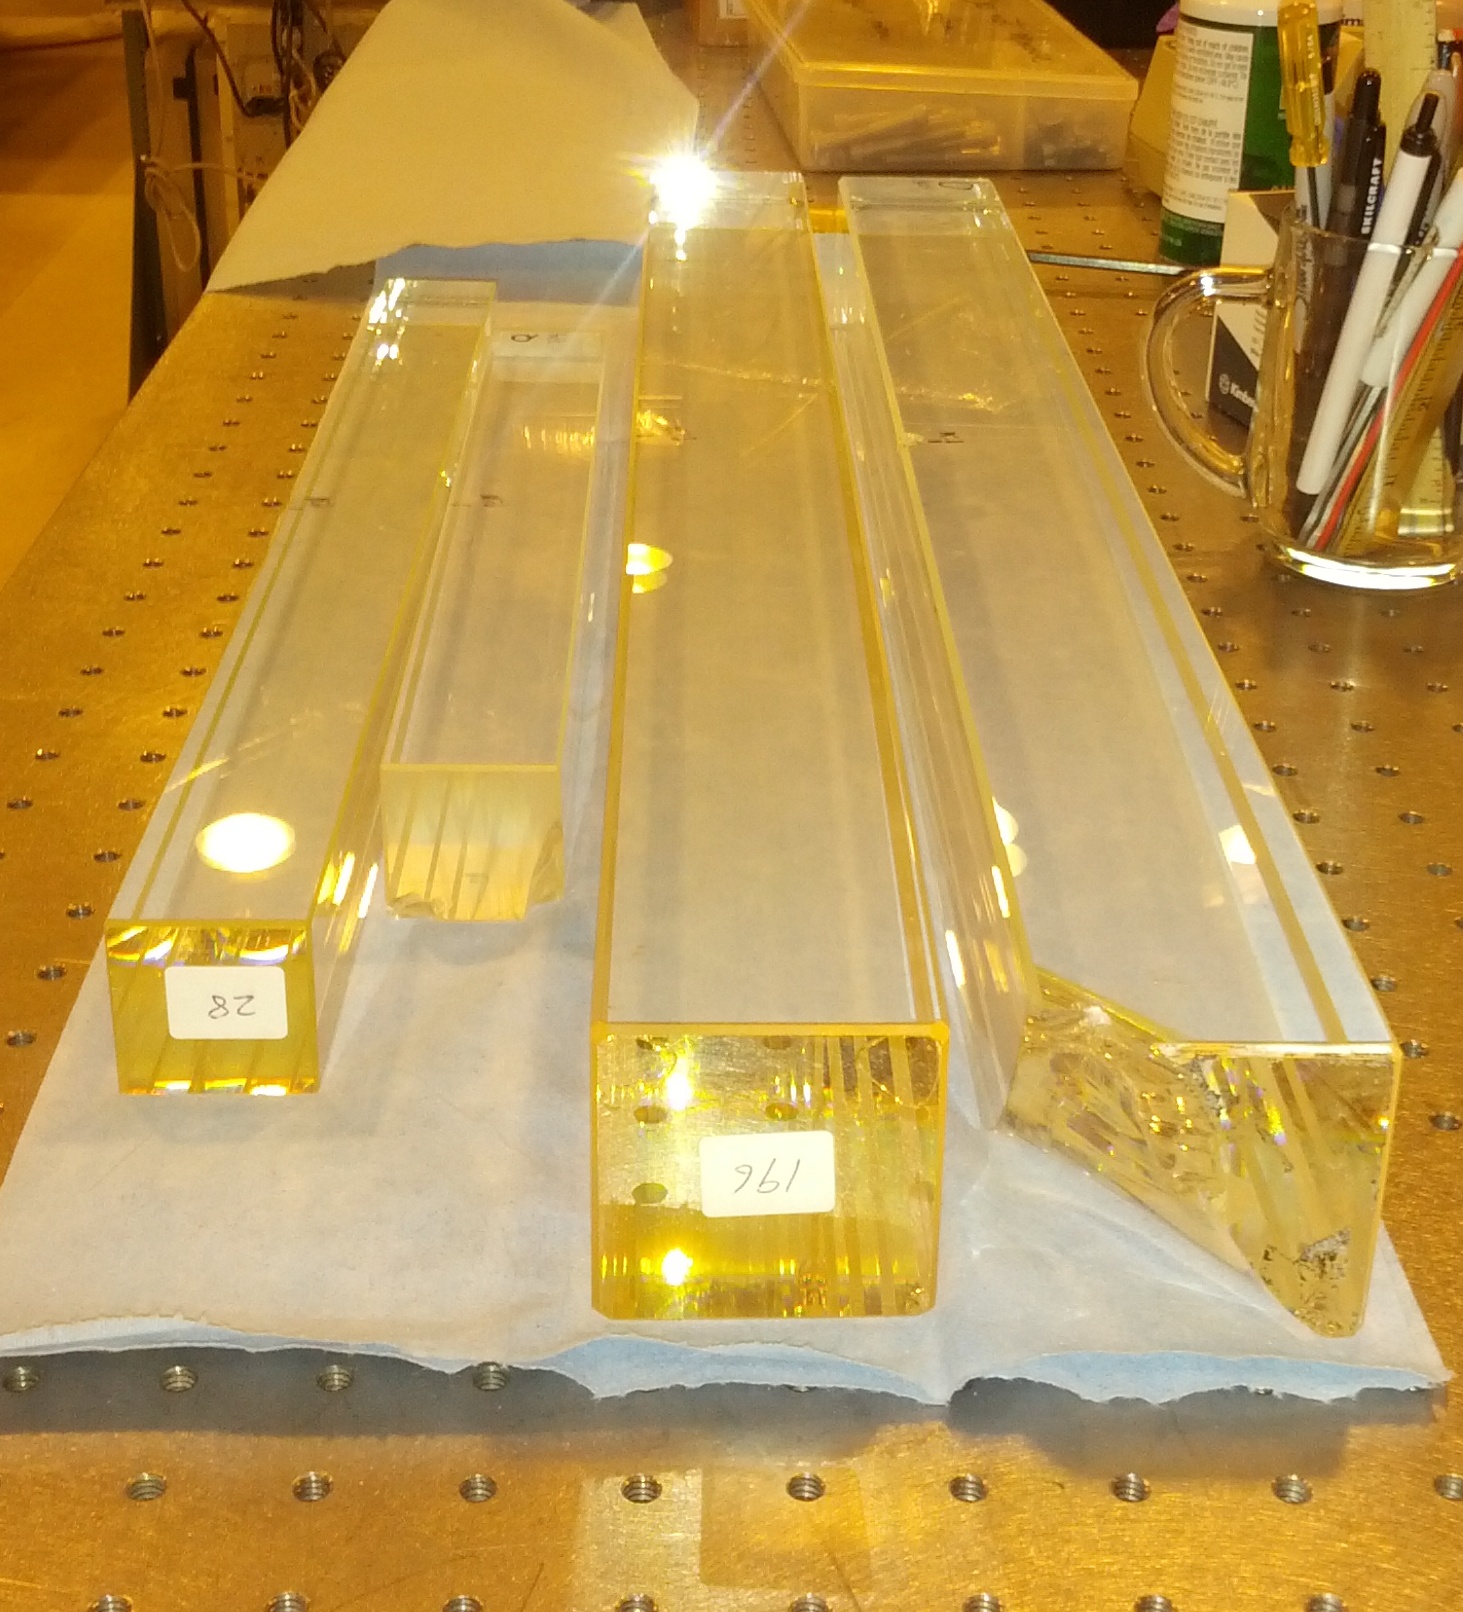
Photo 3: Samples after ~40 hrs exposure to sunlight (the ones with labels are the radiation-damaged samples)
- dilks's blog
- Login or register to post comments
