- dilks's home page
- Posts
- 2019
- 2018
- December (1)
- November (1)
- October (1)
- August (2)
- July (4)
- June (3)
- May (1)
- April (2)
- March (2)
- February (1)
- January (5)
- 2017
- December (3)
- November (1)
- October (2)
- September (3)
- August (2)
- July (2)
- June (1)
- May (2)
- March (3)
- February (3)
- January (3)
- 2016
- November (2)
- September (4)
- August (2)
- July (6)
- June (2)
- May (3)
- April (1)
- March (2)
- February (3)
- January (2)
- 2015
- December (3)
- October (3)
- September (2)
- August (6)
- June (3)
- May (3)
- April (4)
- March (3)
- February (5)
- January (3)
- 2014
- December (1)
- November (1)
- October (3)
- September (4)
- August (3)
- July (3)
- June (2)
- May (2)
- April (2)
- March (1)
- 2013
- 2012
- 2011
- My blog
- Post new blog entry
- All blogs
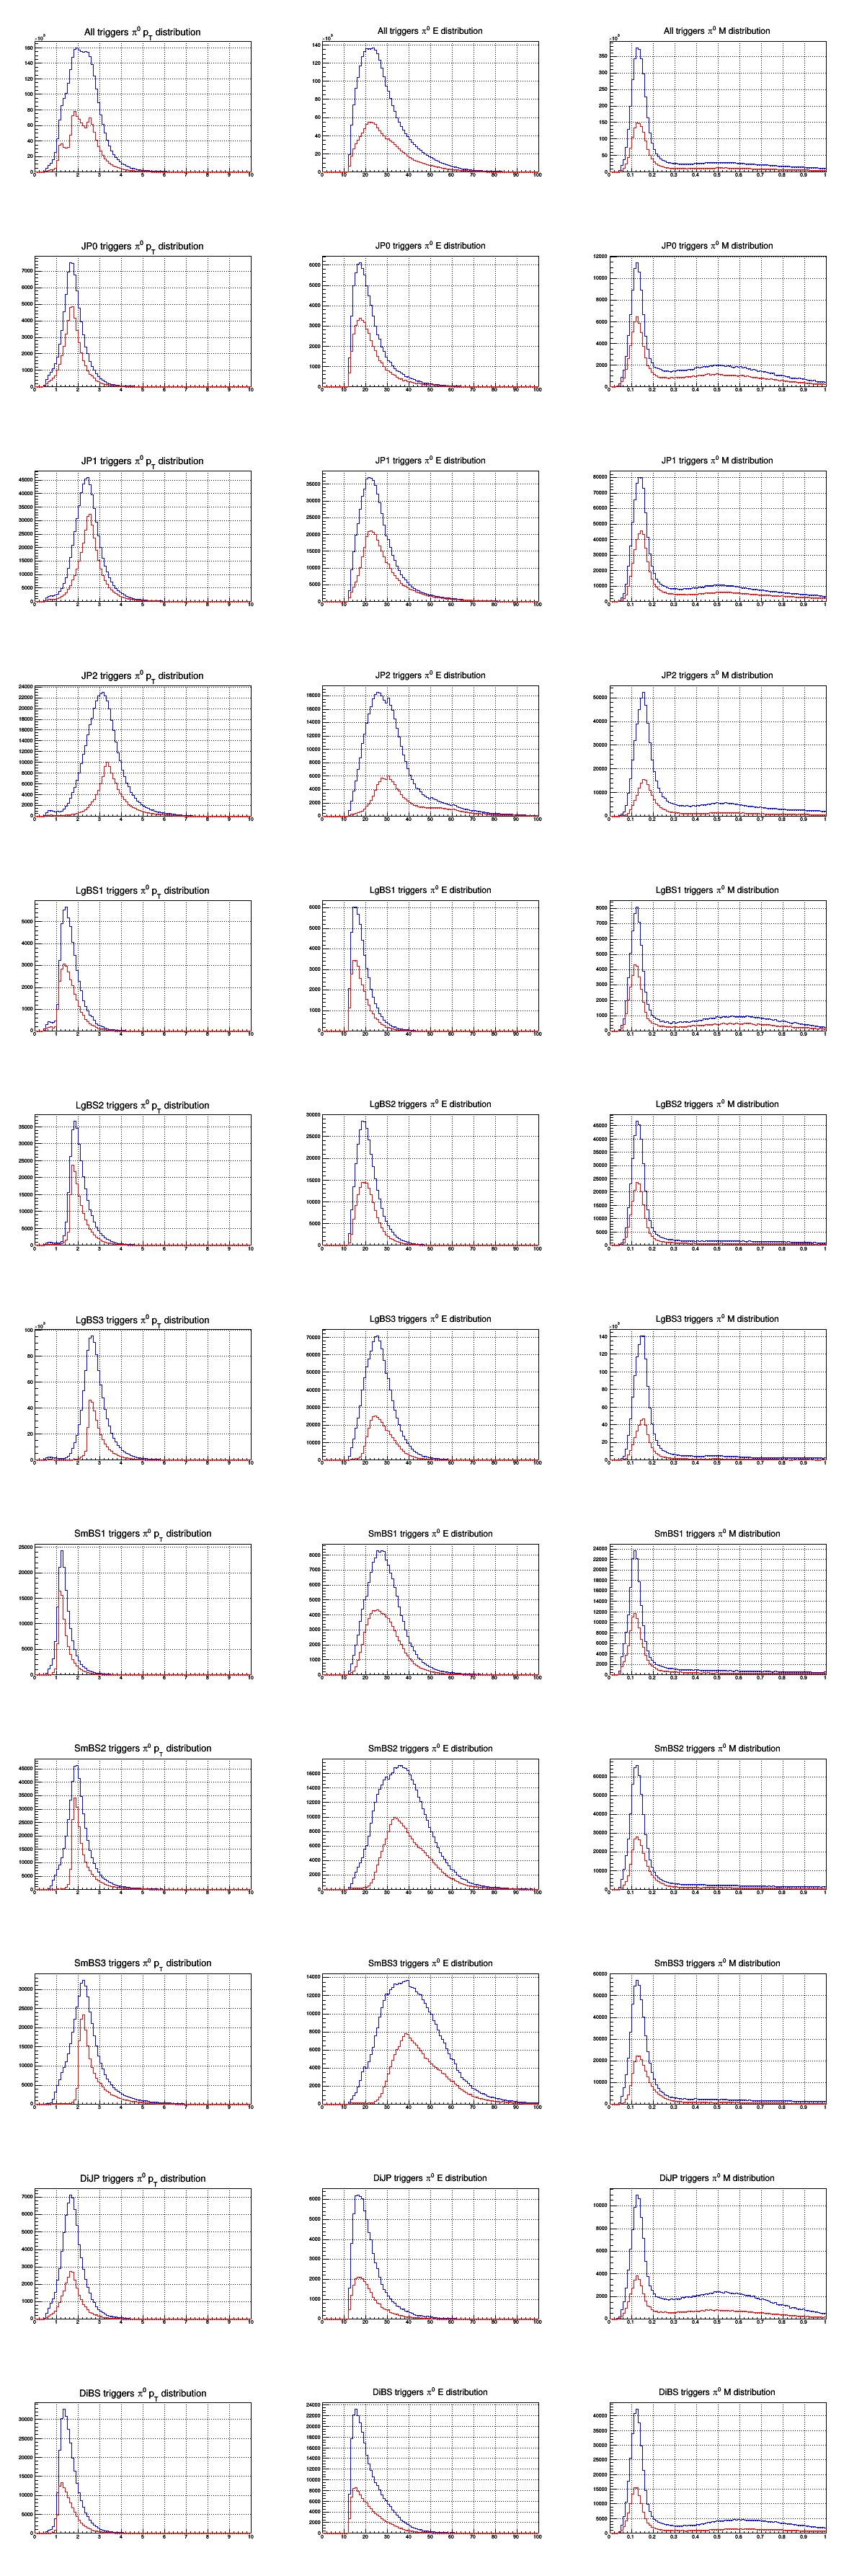
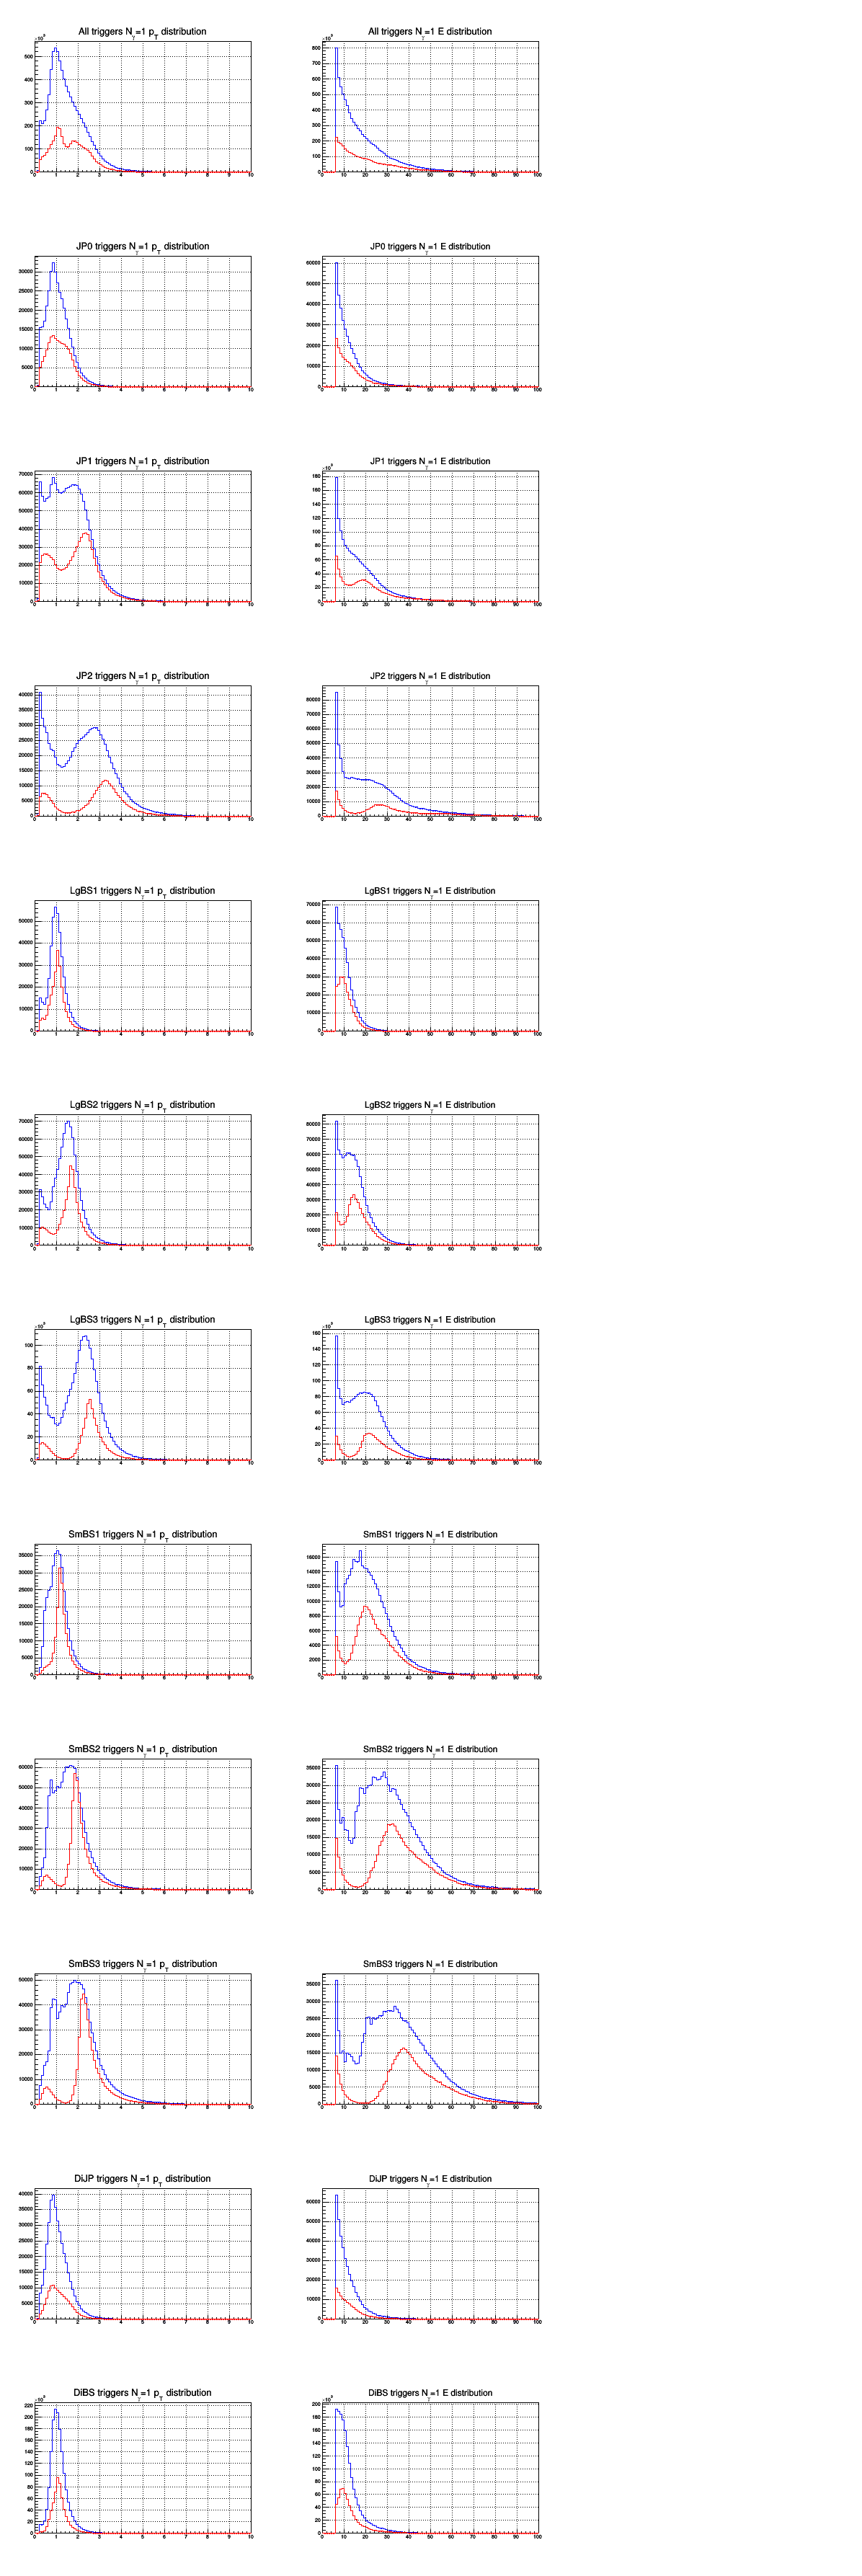
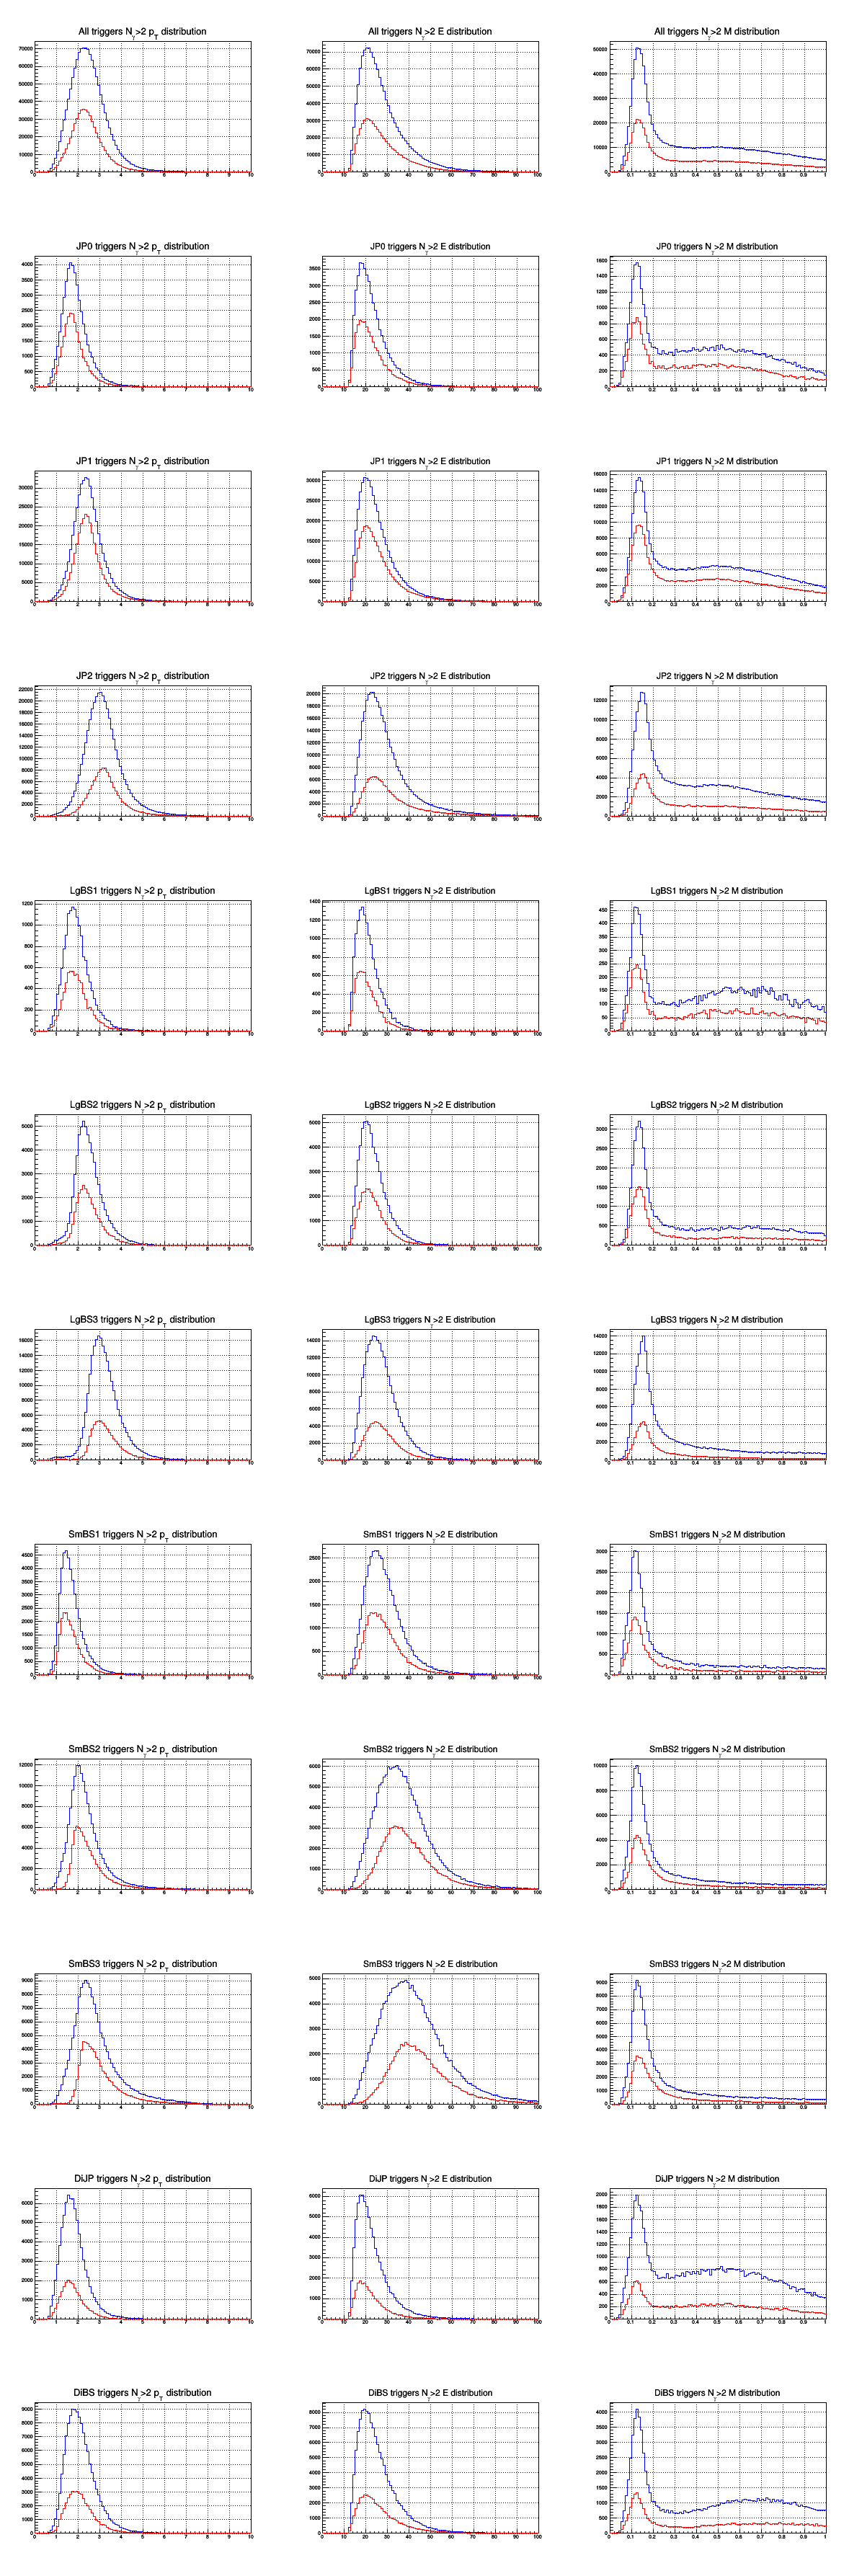
Kinematic Distributions before and i8
There was a noticeable change in kinematic distributions after i8, the last iteration. Some of the differences are attributed to prescale changes.
For all plots below:
- blue: before i8
- red: after i8
The data set that I analyzed before and after i8 are different sizes (less events in the "after" than the "before"), so the vertical scales do not match
pi0 events are shown first, followed by single photons and multiphotons (>2)
Note: E and pT distributions have hard low-end cutoffs

-----------------------------------------------------------------------------------------------------------------------------------------------------------------------------

-----------------------------------------------------------------------------------------------------------------------------------------------------------------------------

- dilks's blog
- Login or register to post comments
