- dilks's home page
- Posts
- 2019
- 2018
- December (1)
- November (1)
- October (1)
- August (2)
- July (4)
- June (3)
- May (1)
- April (2)
- March (2)
- February (1)
- January (5)
- 2017
- December (3)
- November (1)
- October (2)
- September (3)
- August (2)
- July (2)
- June (1)
- May (2)
- March (3)
- February (3)
- January (3)
- 2016
- November (2)
- September (4)
- August (2)
- July (6)
- June (2)
- May (3)
- April (1)
- March (2)
- February (3)
- January (2)
- 2015
- December (3)
- October (3)
- September (2)
- August (6)
- June (3)
- May (3)
- April (4)
- March (3)
- February (5)
- January (3)
- 2014
- December (1)
- November (1)
- October (3)
- September (4)
- August (3)
- July (3)
- June (2)
- May (2)
- April (2)
- March (1)
- 2013
- 2012
- 2011
- My blog
- Post new blog entry
- All blogs
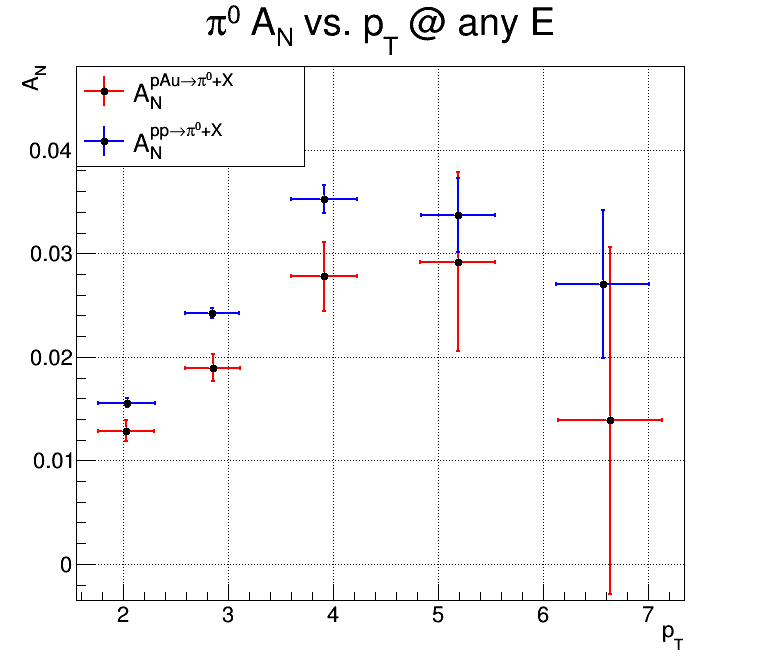
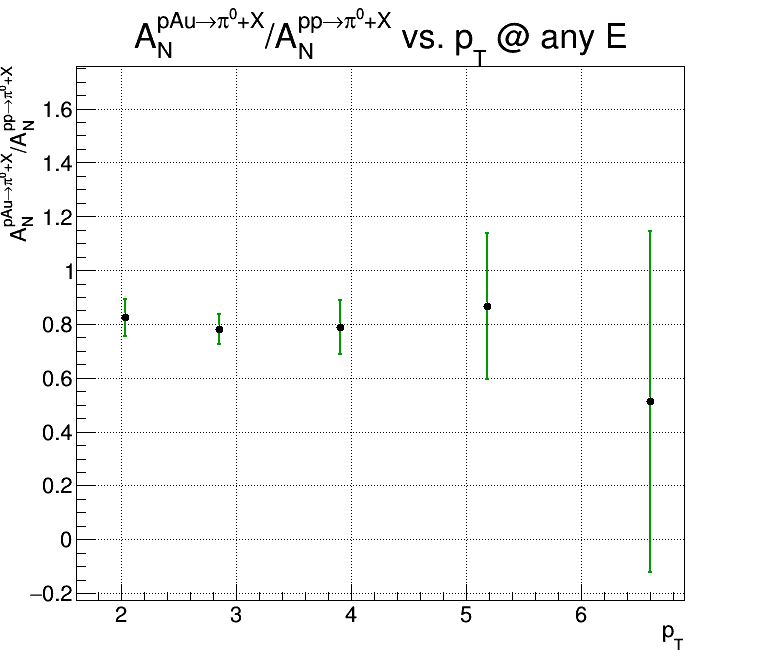
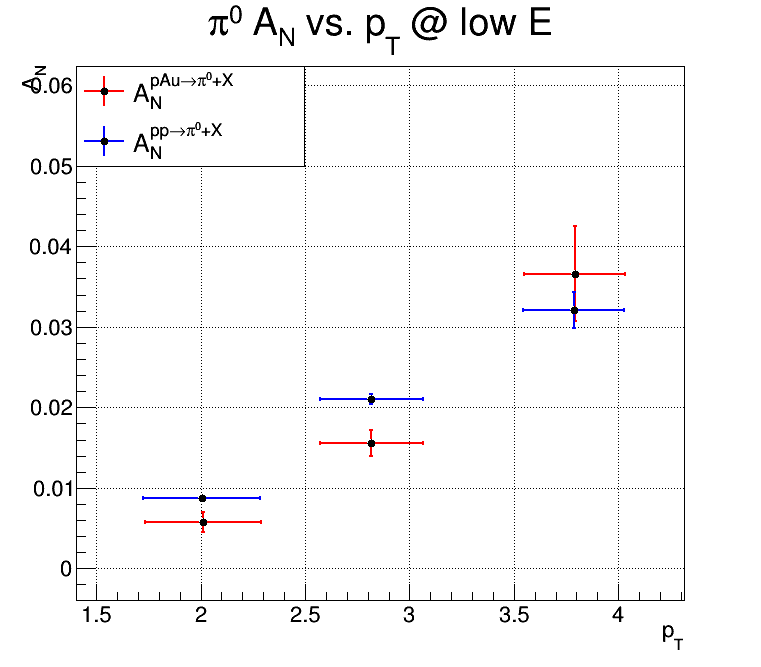
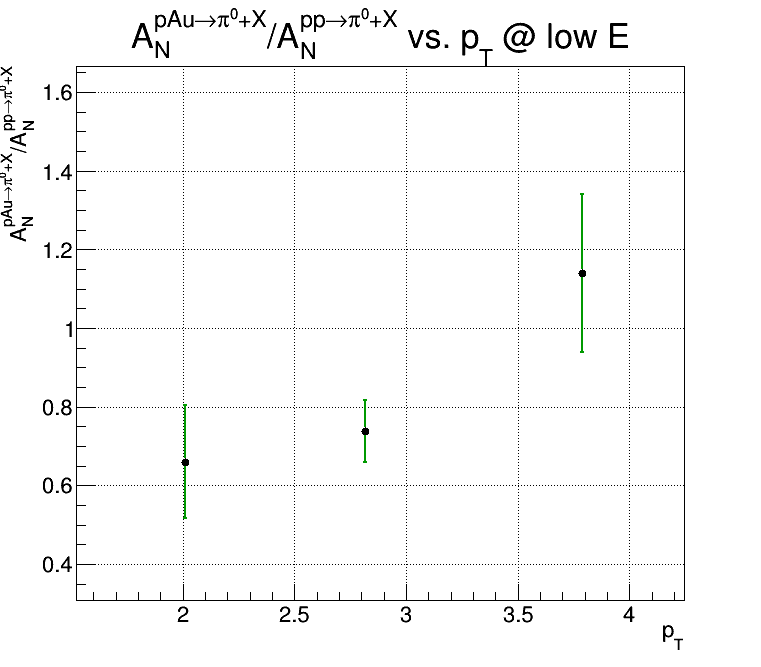
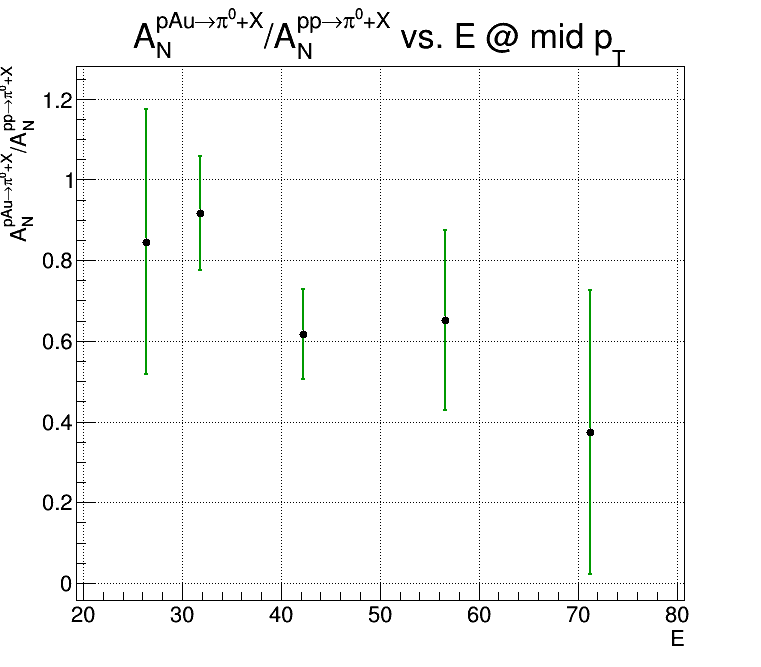
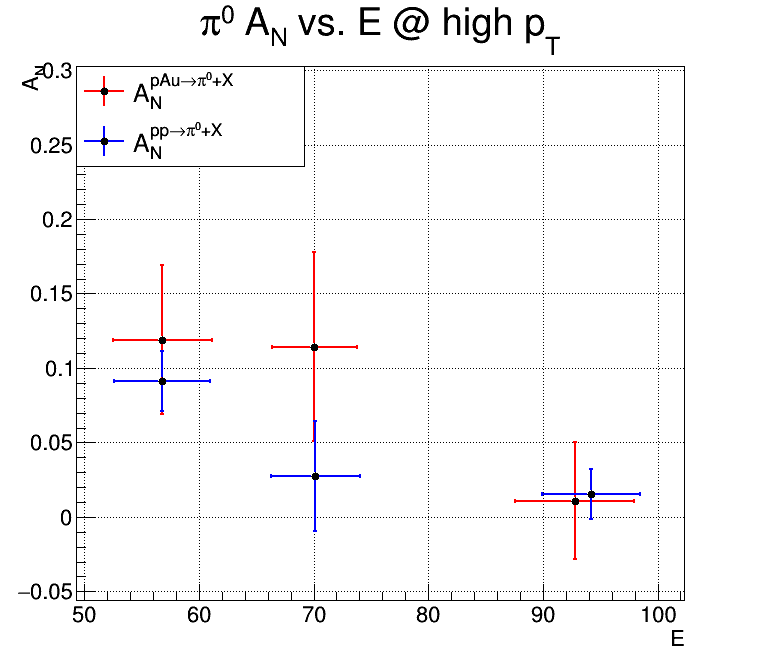
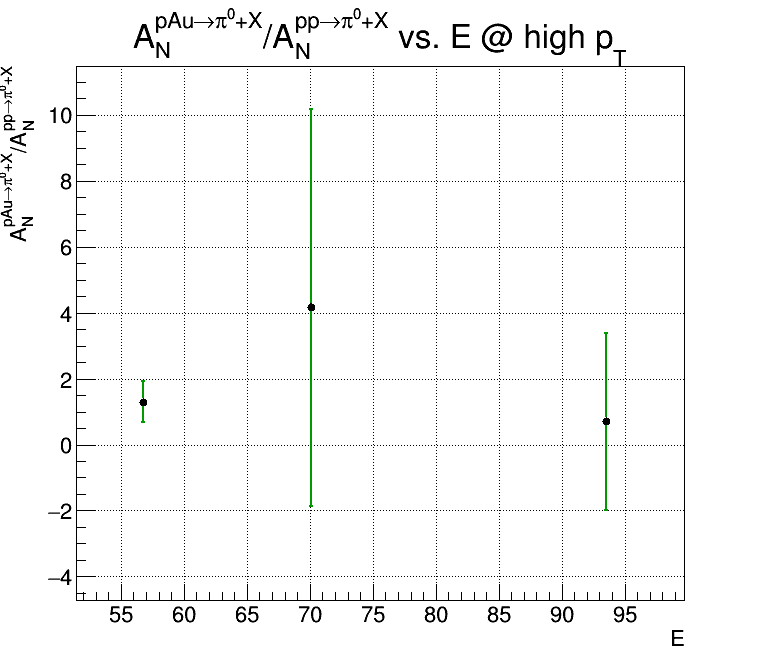
pAu/pp A_N ratio
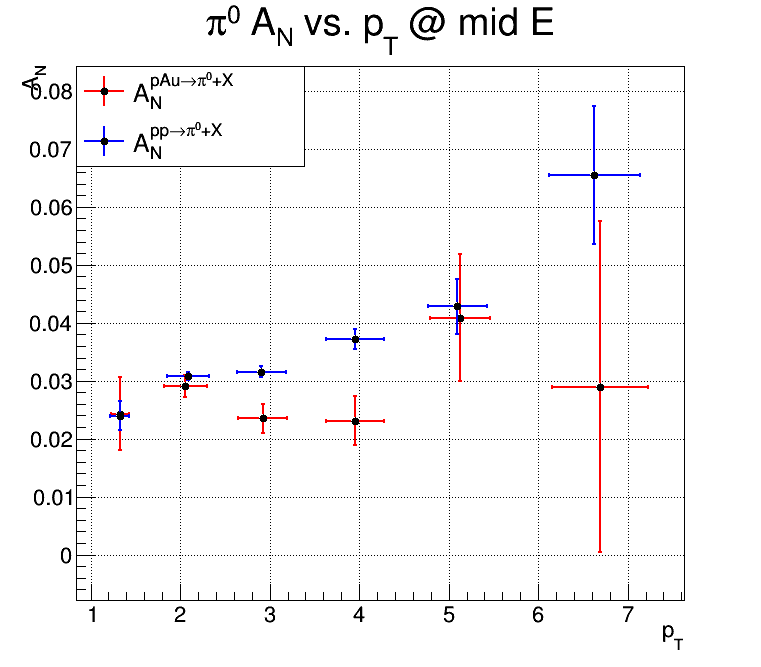
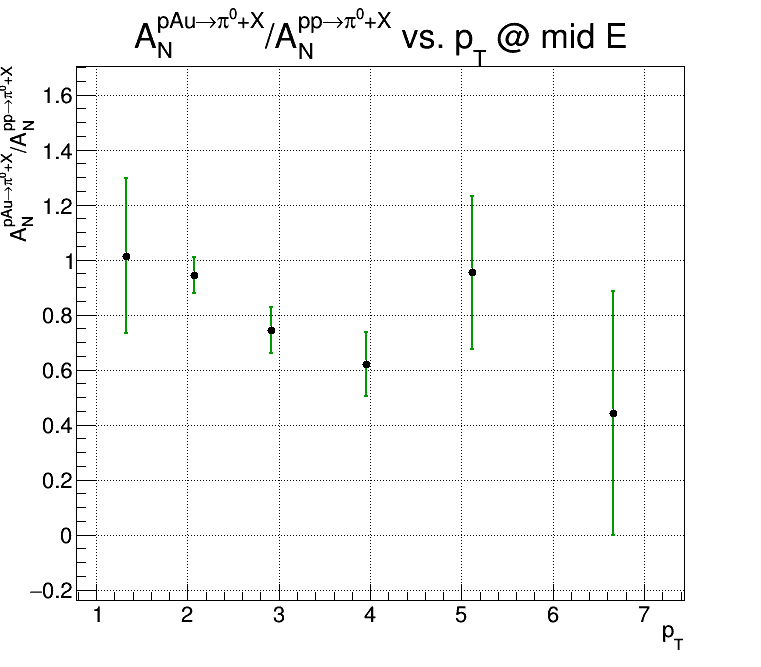
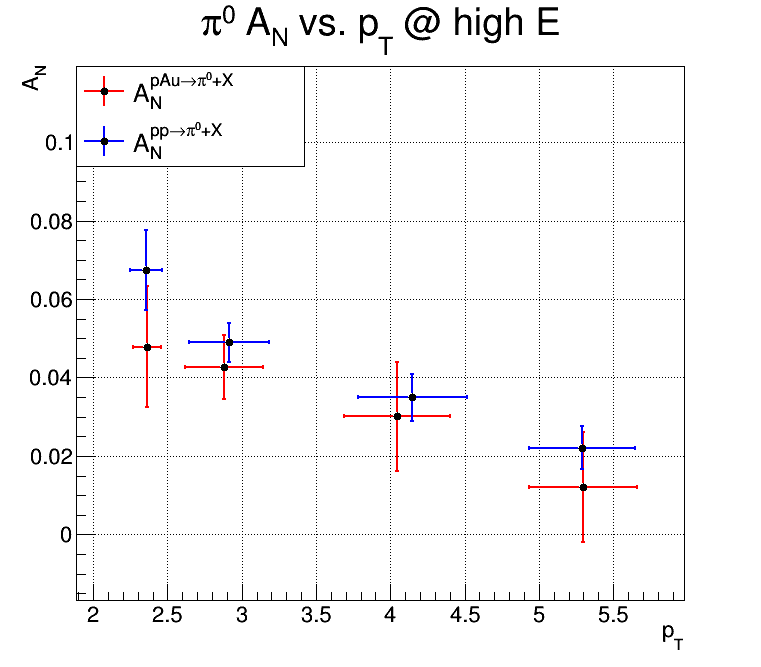
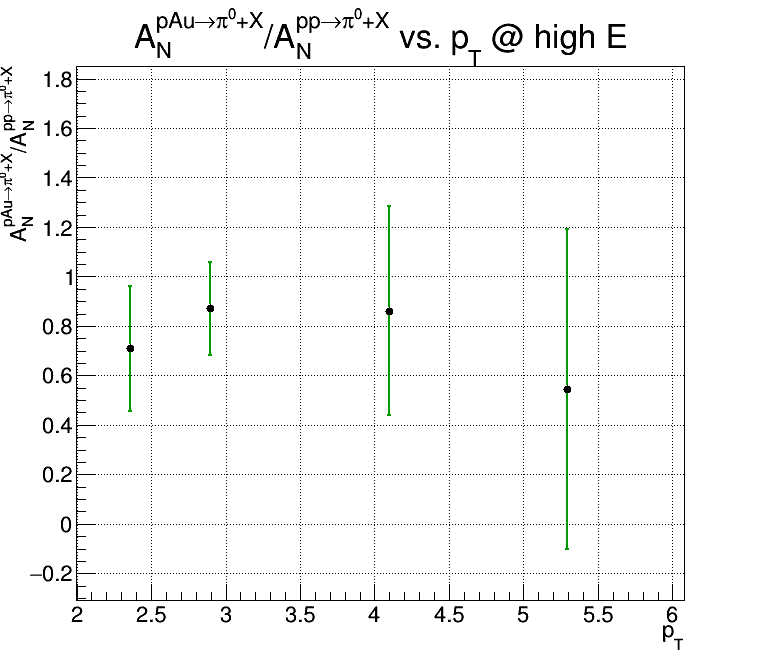
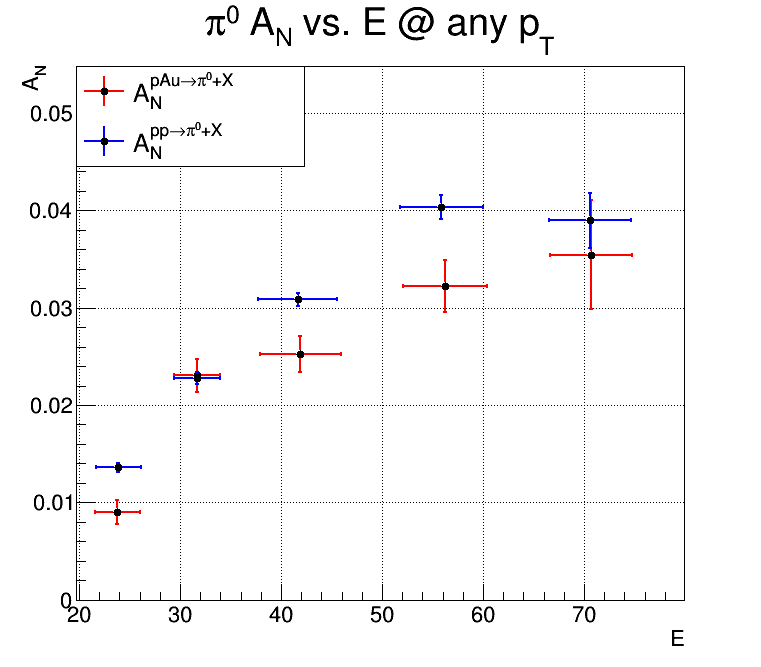
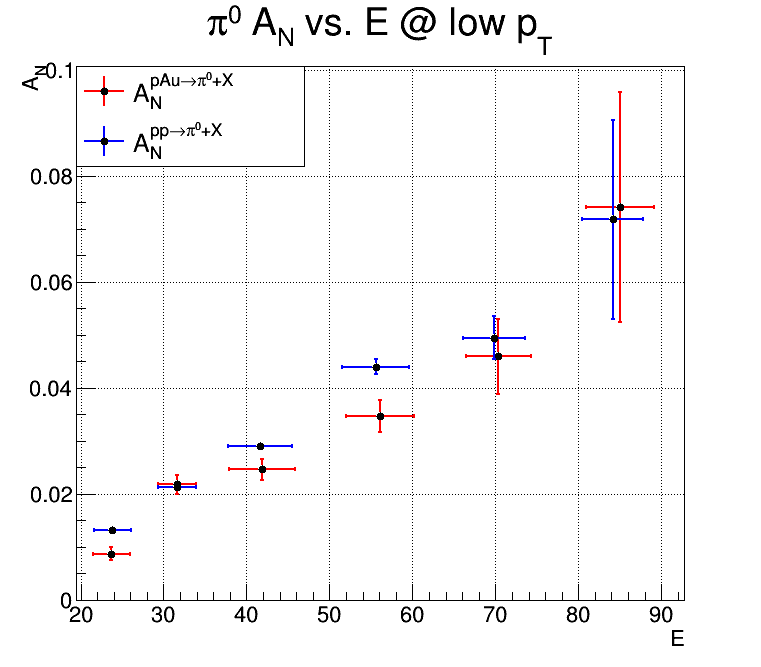
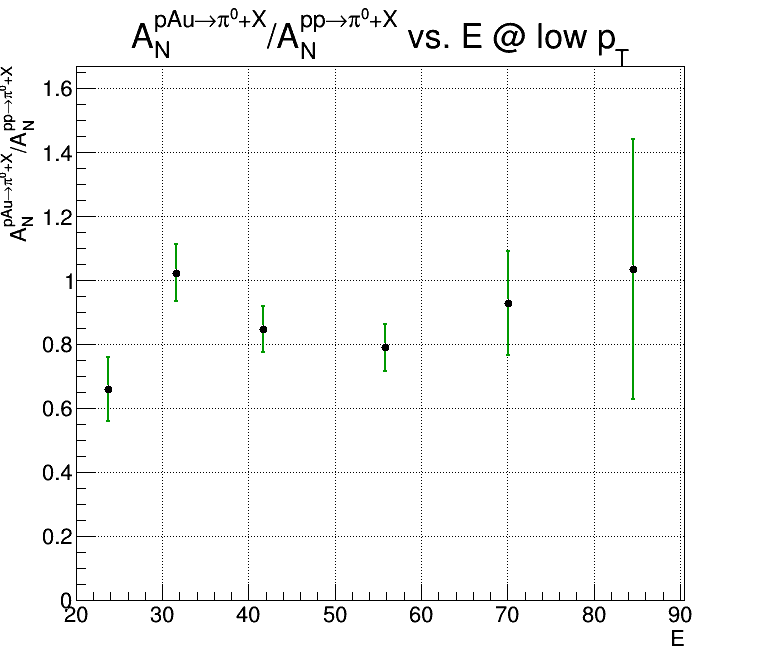
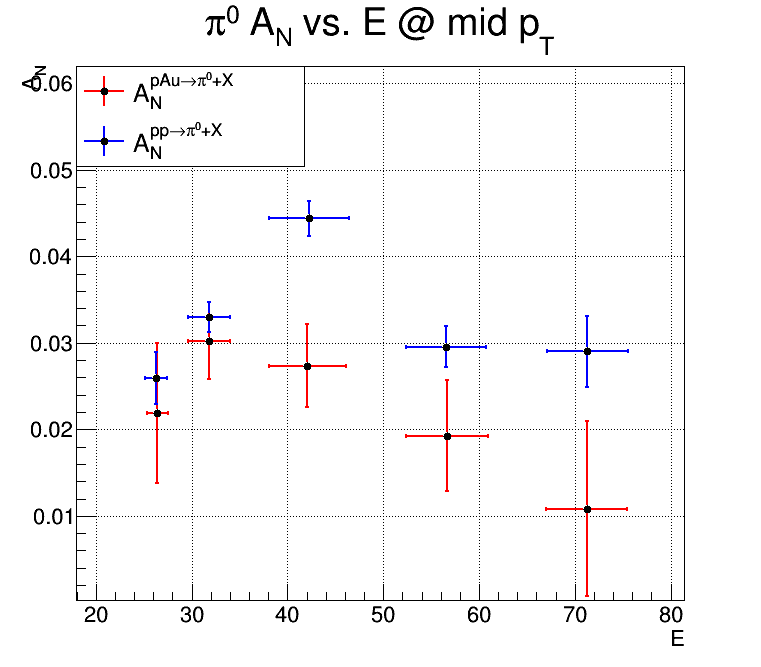
This is an analysis of ~211 million pAu STAR triggers compared to ~52% of the pp transverse data (82% of the data beyond iteration 8);
Plotted on the left are the pi0 A_N for pp in blue and pAu in red; on the right in green is the ratio of A_N for pAu to pp
The data are shown vs E and pT; when plotted vs. E, the data are binned in 4 different regions in pT and vice versa, where the ranges are defined as:
- any pT: 0 < pT < 10
- low pT: 0 < pT < 3.33
- mid pT: 3.33 < pT < 6.66
- high pT: 6.66 < pT < 10
- any E: 0 < xF < 1
- low E: 0 < xF < 1/3
- mid E: 1/3 < xF < 2/3
- high E: 2/3 < xF < 1
** there is also a minimum E and pT cut of 10 and 1 GeV, respectively, for all bins and events considered
** polarisation measurements were obtained from http://www.phy.bnl.gov/cnipol/fills/?rp=15&fn=&ft=&be=&mode=11&sb=Select
These are for pi0 events with the usual cuts with 100mr isolation
.
.
.
.
.

Groups:
- dilks's blog
- Login or register to post comments
