JetCorr Follow-Up [09.11.2018] -- SVD Unfolding: Singular Values and Kreg
In response to slide 13 of the presentation below, it was suggested that I take a look into the so-called "d" vector and singular values of the SVD unfolding when it comes to selecting a solution.
https://drupal.star.bnl.gov/STAR/blog/dmawxc/jetcorr-update-september-11th-2018
Typically, the way I select a solution using the SVD method goes like so:
- Unfold the data using SVD for kReg between 1 and the no. of bins.
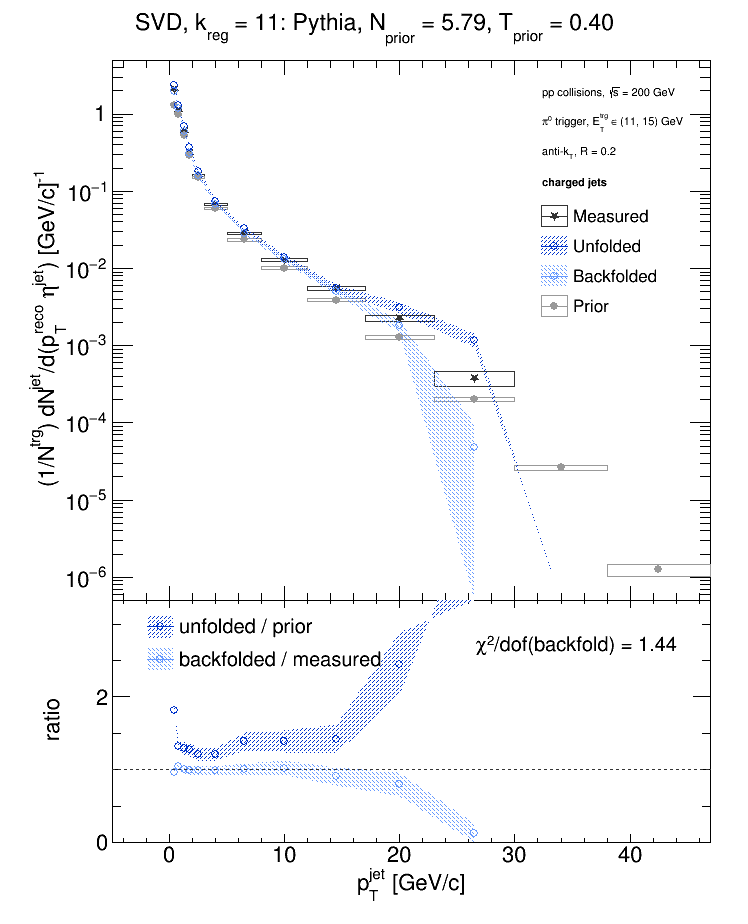
- For each kReg, re-apply the response matrix and efficiency to create a "backfolded" distribution.
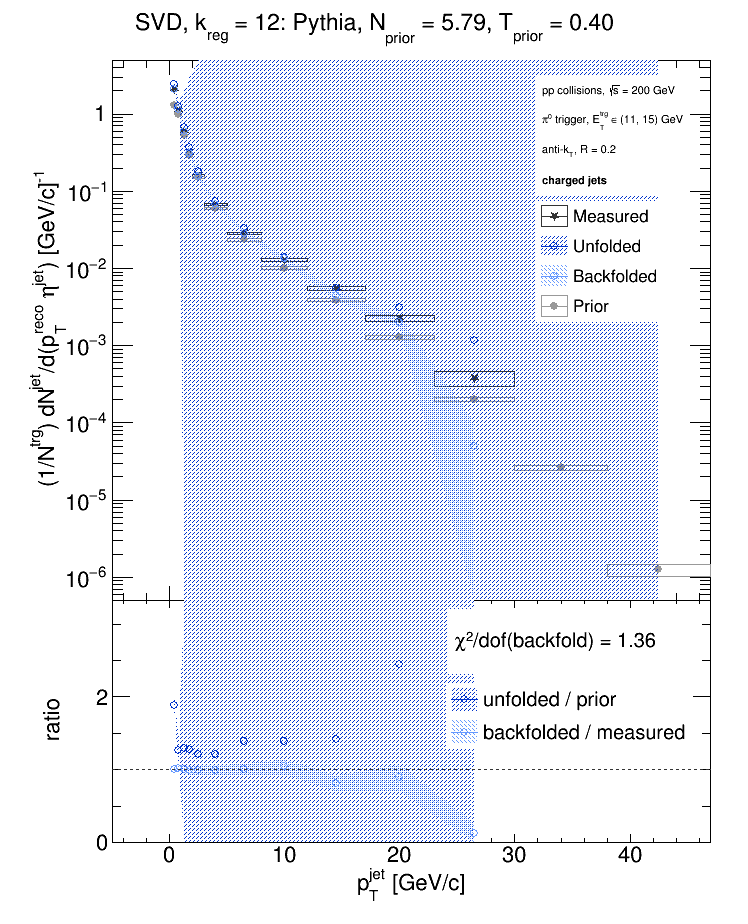
- Select the solution with reasonable error bars that has the chi2 closest to one between the backfolded distribution and data.
Typically, the calculated chi2 between the data and backfolded solutions looks like so as a function of kReg:
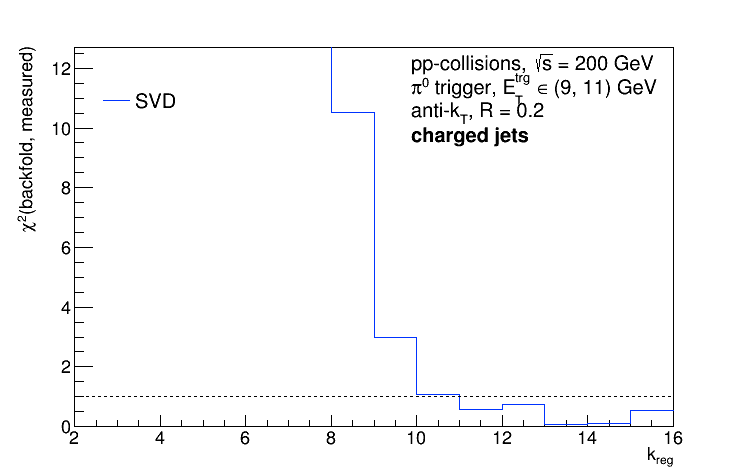
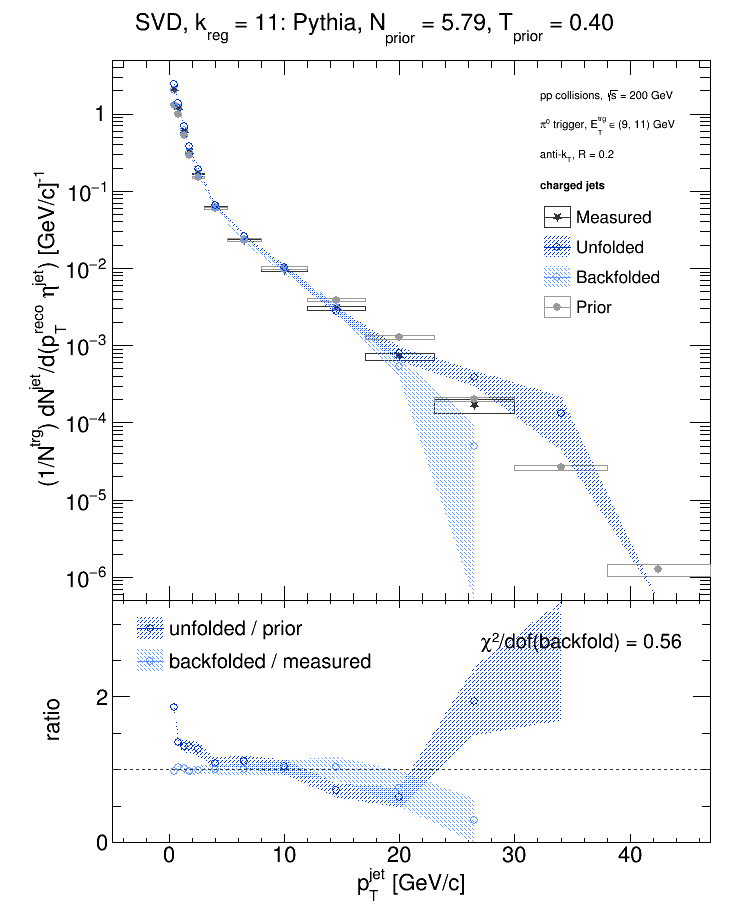
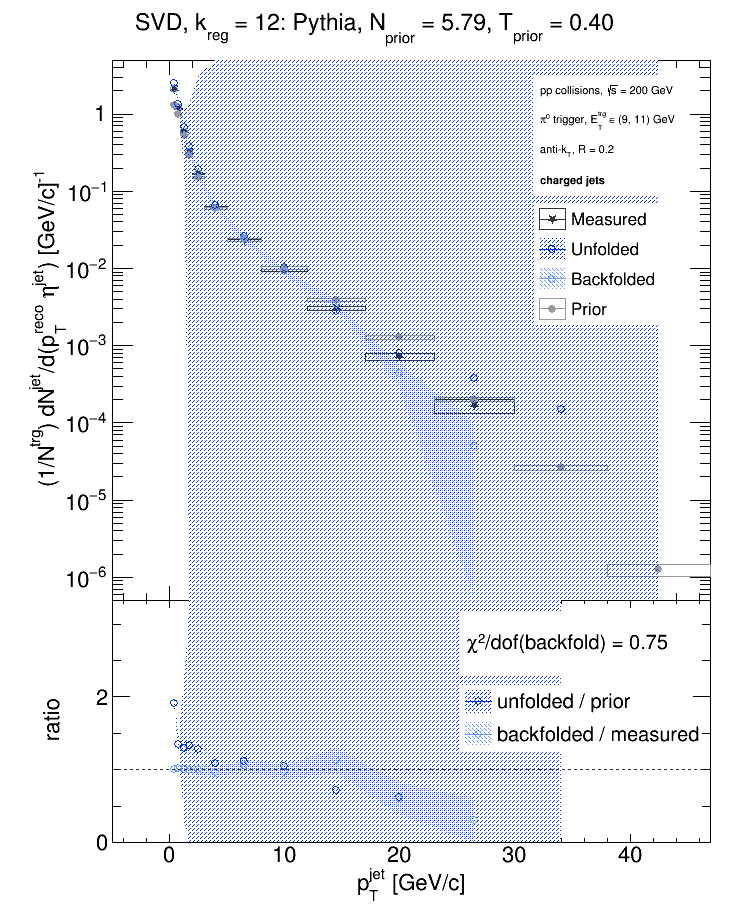
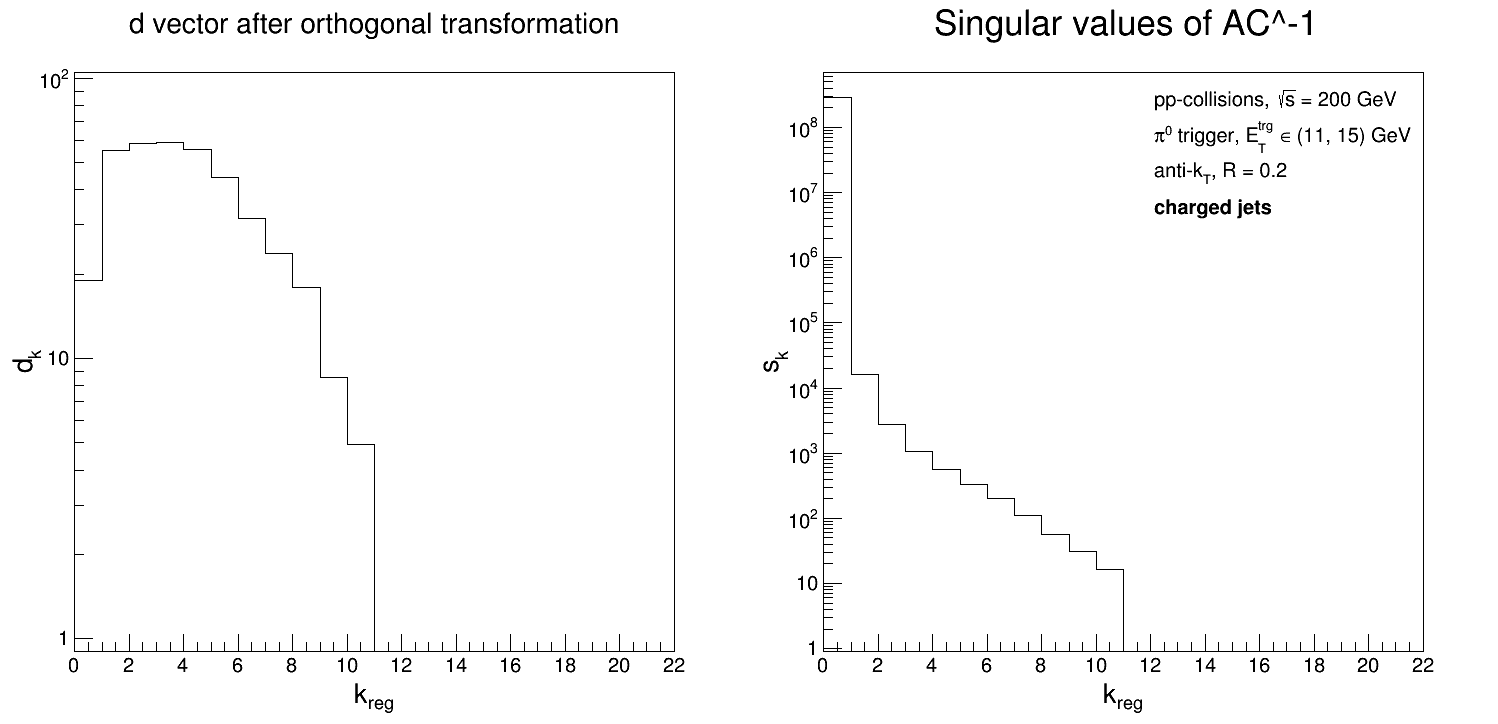
So my algorithm would select kReg = 10 (the error bars explode at kReg = 12). But what do the plots of the "d" vector and the singular values look like?

[Note, the x-axis should read 'kReg - 1', not just kReg.] So at kReg = 12 (again, the x-axis is actually 'kReg - 1'), both d(k) and the singular values drop to 0; this appears in the solutions as the error bars exploding...
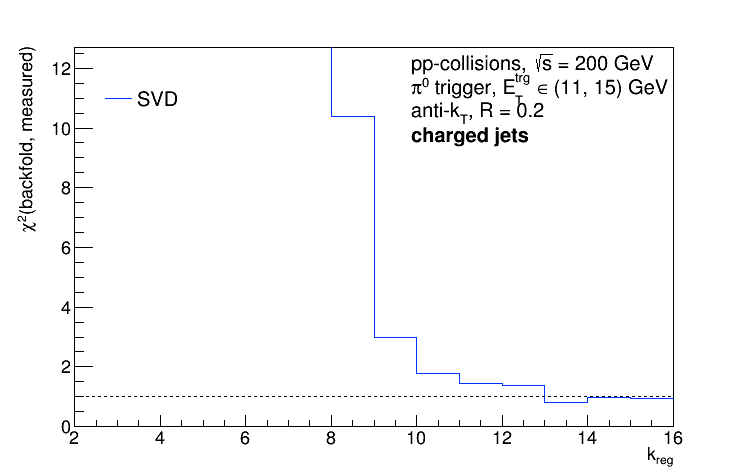
It's worth noting that I have 11 nonzero bins of measured data... And the story is the same for the corresponding 'eTtrg = 11 - 15' GeV data.
- dmawxc's blog
- Login or register to post comments