- drach09's home page
- Posts
- 2022
- 2020
- June (1)
- 2019
- 2018
- 2017
- 2016
- 2015
- 2014
- December (13)
- November (2)
- October (5)
- September (2)
- August (8)
- July (9)
- June (7)
- May (5)
- April (4)
- March (4)
- February (1)
- January (2)
- 2013
- December (2)
- November (8)
- October (5)
- September (12)
- August (5)
- July (2)
- June (3)
- May (4)
- April (8)
- March (10)
- February (9)
- January (11)
- 2012
- 2011
- October (1)
- My blog
- Post new blog entry
- All blogs
2006 EEMC Neutral Pions: Systematics (Method of Calculation)
There are multiple ways to calculate AN. I prefer the cross-ratio method as it takes relative luminosity as well as detector acceptance out of the picture. However, given some of the odd behavior we're seeing it is probably a good idea to examine the asymmetries using another procedure. This could provide a nice sanity check of the methodology, as well as perhaps illuminate some methodology-dependent systematics.
For this study, I have chose to examine the traditional way to calculate AN. Namely, I look at
AN = (1/Pbeam)×(N↑-N↓)/(N↑+N↓).
All this requires is to separate the yields into spin states as a function of φγγ (where φγγ = π/2 - φS). The sum over the difference should reveal, in this case, a cos(φγγ)-dependence. By leaving the histograms in terms of φγγ it also proves a check on my calculation of φS.
Figure 1: AN vs. xF (xF > 0)
| Traditional Method |
|---|
 |
| Cross-ratio Method |
| xF Bin 1 |
 |
| xF Bin 2 |
 |
| xF Bin 3 |
 |
In Fig. 1, I show a comparison of the traditional method to the cross-ratio method for the asymmetries as a function of xF for xF > 0. One can see that the methods provide completely consistent answers. Additionally, one sees that the p0's from the traditional method are equivalent to the luminosity asymmetries from the cross-ratio method. This is indeed as it should be and provides another vote of confidence for our methodology.
Figure 2: AN vs. xF (xF < 0)
| Traditional Method |
|---|
 |
| Cross-ratio Method |
| xF Bin 1 |
 |
| xF Bin 2 |
 |
| xF Bin 3 |
 |
In Fig. 2, I show a comparison of the traditional method to the cross-ratio method for the asymmetries as a function of xF for xF < 0. Again the methods provide completely consistent answers for both the physics and luminosity asymmetries.
At this point, I will revert back to calculating the asymmetries in terms of φS. As I stated earlier, they are simply offset from each other by π/2. Having established that we have calculated φS robustly, it should be less confusing, now, to have consistent notation.
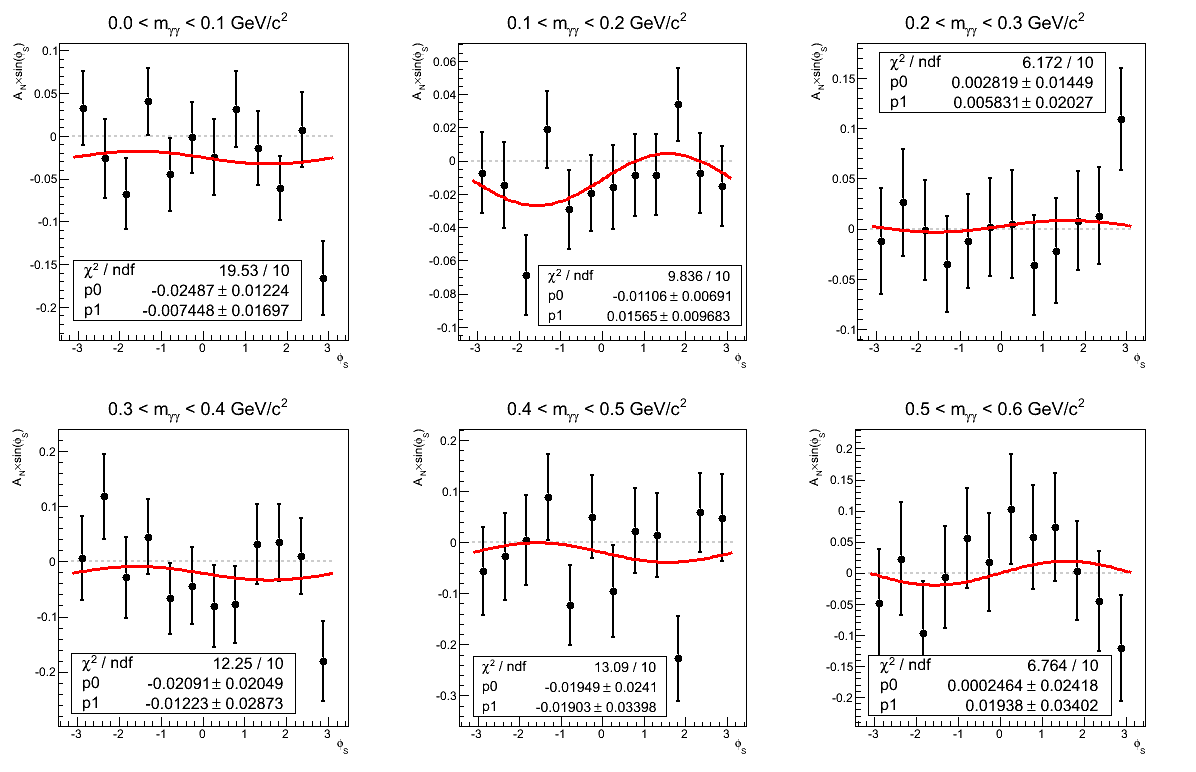
Figure 3: AN vs. mγγ (xF > 0)
| Traditional Method |
|---|
 |
| Cross-ratio Method |
| 0.0 < mγγ < 0.1 GeV/c2 |
 |
| 0.1 < mγγ < 0.2 GeV/c2 |
 |
| 0.2 < mγγ < 0.3 GeV/c2 |
 |
| 0.3 < mγγ < 0.4 GeV/c2 |
 |
| 0.4 < mγγ < 0.5 GeV/c2 |
 |
| 0.5 < mγγ < 0.6 GeV/c2 |
 |
Figure 3 shows the asymmetries as a function of invariant mass for xF > 0. Again, the methods are consistent. Note that in the mass bin corresponding to the π0 the methods are entirely equivalent within statistics and differ numerically by only 3.1% (0.035σ).
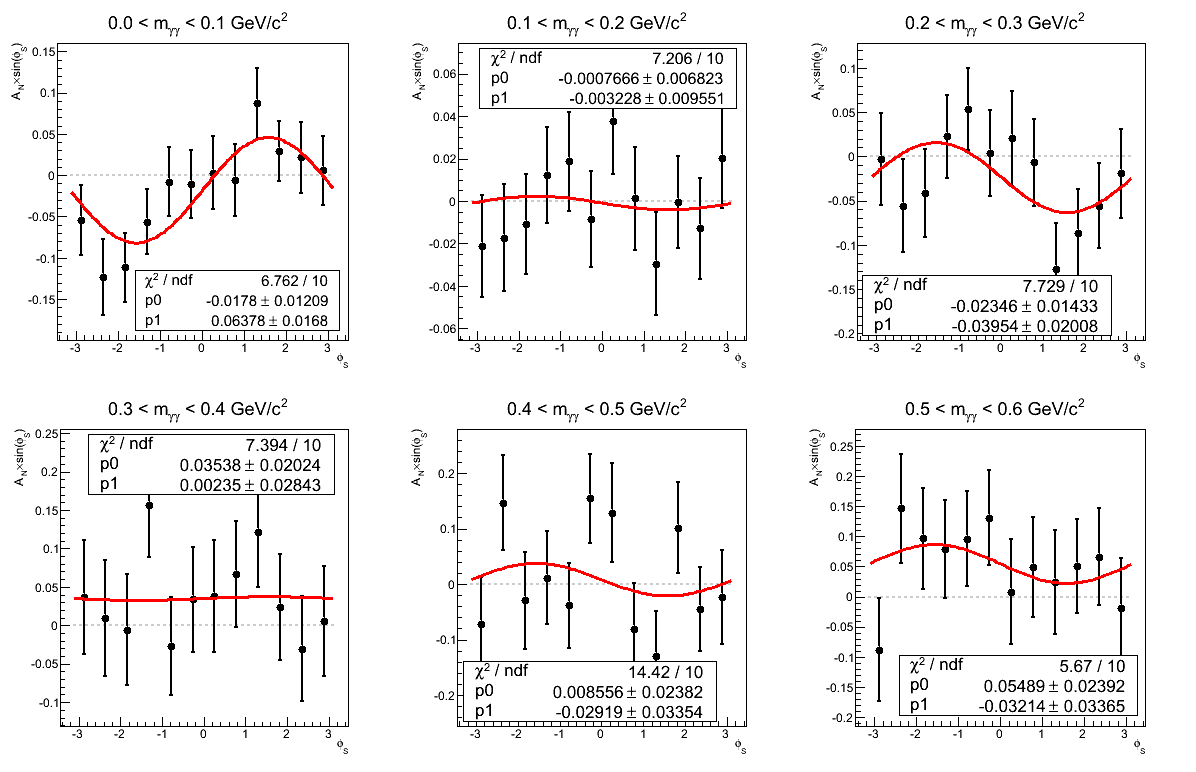
Figure 4: AN vs. mγγ (xF < 0)
| Traditional Method |
|---|
 |
| Cross-ratio Method |
| 0.0 < mγγ < 0.1 GeV/c2 |
 |
| 0.1 < mγγ < 0.2 GeV/c2 |
 |
| 0.2 < mγγ < 0.3 GeV/c2 |
 |
| 0.3 < mγγ < 0.4 GeV/c2 |
 |
| 0.4 < mγγ < 0.5 GeV/c2 |
 |
| 0.5 < mγγ < 0.6 GeV/c2 |
 |
In Figure 4 I show the asymmetry as a function of invariant mass for xF < 0. Again, the methods yield consistent results, even for the lowest mass bin. Thus, I cannot conclude at this point that the odd behavior in that bin is due to the methodology. It still may be the result of something stupid on my part, however, I can't conclude that based on this study.
- drach09's blog
- Login or register to post comments
