- drach09's home page
- Posts
- 2022
- 2020
- June (1)
- 2019
- 2018
- 2017
- 2016
- 2015
- 2014
- December (13)
- November (2)
- October (5)
- September (2)
- August (8)
- July (9)
- June (7)
- May (5)
- April (4)
- March (4)
- February (1)
- January (2)
- 2013
- December (2)
- November (8)
- October (5)
- September (12)
- August (5)
- July (2)
- June (3)
- May (4)
- April (8)
- March (10)
- February (9)
- January (11)
- 2012
- 2011
- October (1)
- My blog
- Post new blog entry
- All blogs
2006 EEMC Neutral Pions: Figures and Data Table
Every STAR paper is required to keep a data table for each figure. In this blog, I will keep the final numbers for the data table as well as the most updated figures. At some point, the tables may need to move off of Drupal to a public site; but for now they will rest, here.
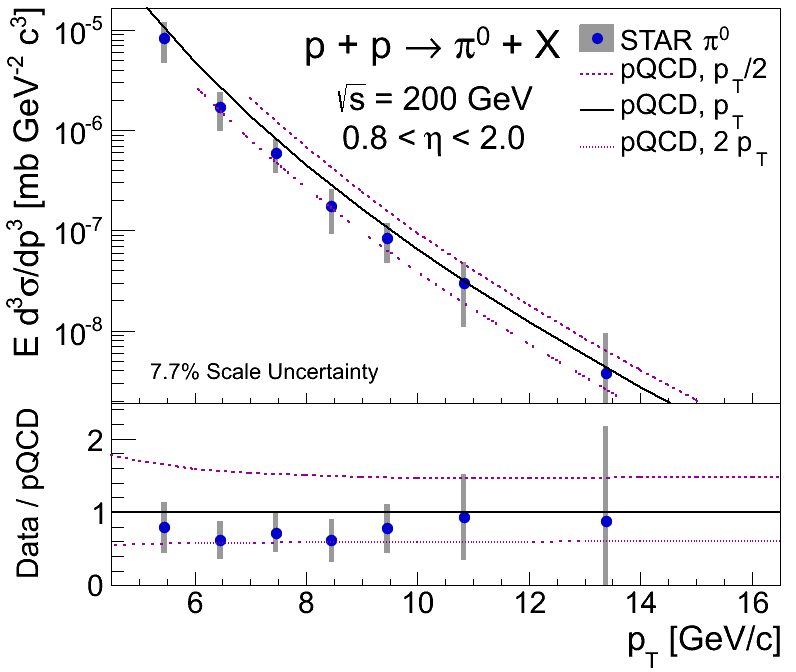
Figures 5: Cross-section as a Function of pT

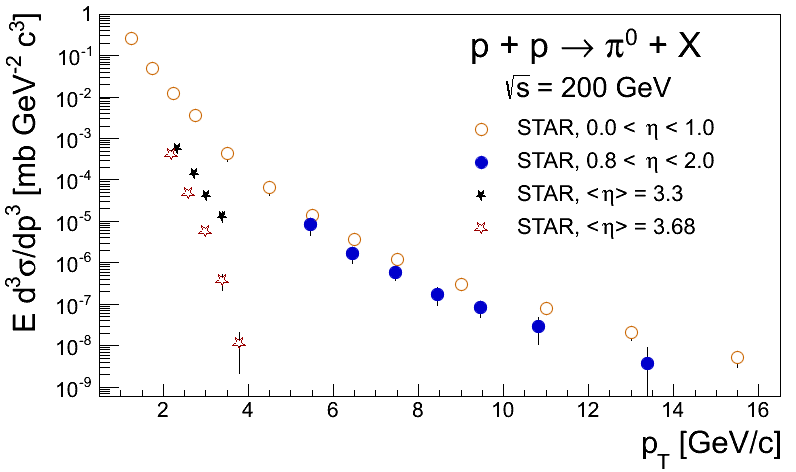
Figures 6: Cross-section as a Function of pT in Comparison to Previous STAR Results

Figures 5 and 6 (EEMC Data)
| Bin | pT [GeV/c] | Edσ3/dp3 [mb×c3/GeV2] | Error (stat) [mb×c3/GeV2] | Error (syst) [mb×c3/GeV2] | (Edσ3/dp3)/pQCD | (Edσ3/dp3)/pQCD Error (stat.) | (Edσ3/dp3)/pQCD Error (syst.) |
|---|---|---|---|---|---|---|---|
| 1 | 5.456e+00 | 8.332e-06 | 3.688e-08 | 3.671e-06 | 7.904e-01 | 3.498e-03 | 3.482e-01 |
| 2 | 6.456e+00 | 1.692e-06 | 1.236e-08 | 7.042e-07 | 6.237e-01 | 4.557e-03 | 2.595e-01 |
| 3 | 7.456e+00 | 5.947e-07 | 5.456e-09 | 2.211e-07 | 7.216e-01 | 6.621e-03 | 2.683e-01 |
| 4 | 8.456e+00 | 1.742e-07 | 2.741e-09 | 8.201e-08 | 6.143e-01 | 9.666e-03 | 2.892e-01 |
| 5 | 9.456e+00 | 8.338e-08 | 1.830e-09 | 3.623e-08 | 7.777e-01 | 1.707e-02 | 3.379e-01 |
| 6 | 1.083e+01 | 2.949e-08 | 6.417e-10 | 1.859e-08 | 9.289e-01 | 2.021e-02 | 5.856e-01 |
| 7 | 1.338e+01 | 3.813e-09 | 1.369e-10 | 5.539e-09 | 8.835e-01 | 3.172e-02 | 1.283e+00 |
Figure 6 data for BEMC and FPD available on STAR publication page: BEMC, FPD (⟨η⟩ = 3.3), and FPD (⟨η⟩ = 3.68).
Figures 5 (Theory)
| Bin | pT [GeV/c] | Edσ3/dp3 (pT-scale) [mb×c3/GeV2] | Edσ3/dp3 (2pT-scale) [mb×c3/GeV2] | Edσ3/dp3 (pT/2-scale) [mb×c3/GeV2] |
|---|---|---|---|---|
| 1 | 4.000000E+00 | 0.000114853 | 6.23379e-05 | 0.000212785 |
| 2 | 5.000000E+00 | 2.03654e-05 | 1.14826e-05 | 3.44042e-05 |
| 3 | 6.000000E+00 | 4.81227e-06 | 2.77125e-06 | 7.66353e-06 |
| 4 | 7.000000E+00 | 1.3717e-06 | 7.98726e-07 | 2.1042e-06 |
| 5 | 8.000000E+00 | 4.49195e-07 | 2.65263e-07 | 6.73088e-07 |
| 6 | 9.000000E+00 | 1.63943e-07 | 9.69951e-08 | 2.41838e-07 |
| 7 | 1.000000E+01 | 6.4661e-08 | 3.86118e-08 | 9.48211e-08 |
| 8 | 1.100000E+01 | 2.74535e-08 | 1.63931e-08 | 4.0269e-08 |
| 9 | 1.200000E+01 | 1.21978e-08 | 7.29108e-09 | 1.78143e-08 |
| 10 | 1.300000E+01 | 5.67941e-09 | 3.40877e-09 | 8.32988e-09 |
| 11 | 1.400000E+01 | 2.75107e-09 | 1.65369e-09 | 4.05225e-09 |
| 12 | 1.500000E+01 | 1.37578e-09 | 8.25846e-10 | 2.02825e-09 |
| 13 | 1.600000E+01 | 7.07441e-10 | 4.24146e-10 | 1.04472e-09 |
| 14 | 1.700000E+01 | 3.73523e-10 | 2.24181e-10 | 5.55672e-10 |
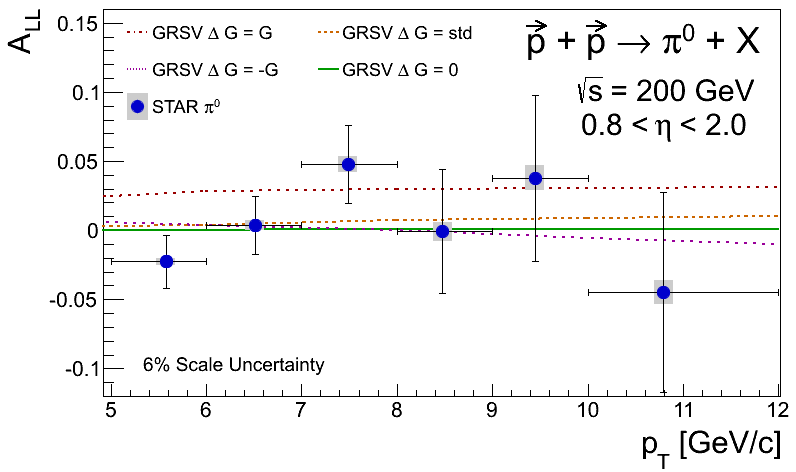
Figure 7: ALL as a Function of pT

Figure 7 (EEMC Data)
| Bin | pT [GeV/c] | ALL | Error (stat.) | Error (syst.) |
|---|---|---|---|---|
| 1 | 5.57692 | -0.023 | 0.019 | 0.002 |
| 2 | 6.51397 | 0.004 | 0.021 | 0.004 |
| 3 | 7.48737 | 0.048 | 0.028 | 0.006 |
| 4 | 8.4765 | -0.001 | 0.045 | 0.007 |
| 5 | 9.44489 | 0.038 | 0.060 | 0.009 |
| 6 | 10.7949 | -0.045 | 0.072 | 0.009 |
Figure 7 (Theory)
| Bin | pT [GeV/c] | ALL (DSSV) | ALL (GRSV-std) |
|---|---|---|---|
| 1 | 4.500000E+00 | 5.650877E-05 | 3.916591E-03 |
| 2 | 5.576920E+00 | 3.092593E-04 | 5.532119E-03 |
| 3 | 6.513970E+00 | 6.453725E-04 | 6.911833E-03 |
| 4 | 7.487370E+00 | 1.085918E-03 | 8.324280E-03 |
| 5 | 8.476500E+00 | 1.612128E-03 | 9.622134E-03 |
| 6 | 9.444890E+00 | 2.194204E-03 | 1.083375E-02 |
| 7 | 1.079490E+01 | 3.090195E-03 | 1.241513E-02 |
| 8 | 1.200000E+01 | 3.955730E-03 | 1.371001E-02 |
Figure 7 (Theory cont'd.)
| Bin | pT [GeV/c] | ALL (GRSV-min) | ALL (GRSV-max) |
|---|---|---|---|
| 1 | 0.5 | 0.003 | 0.005 |
| 2 | 2.0 | 0.002 | 0.009 |
| 3 | 3.0 | 0.0075 | 0.0145 |
| 4 | 4.0 | 0.008 | 0.02 |
| 5 | 6.0 | 0.004 | 0.025 |
| 6 | 8.0 | 0.0 | 0.028 |
| 7 | 10.0 | -0.0055 | 0.03 |
| 8 | 12.0 | -0.01 | 0.031 |
Figure 8: AN as a Function of xF and pT
.png)
Figure 9: AN as a Function of xF in Comparison to Previous Results

Figures 8 and 9 (EEMC Data)
| Bin | |⟨xF⟩| | AN (xF > 0) | Stat. Error AN (xF > 0) | Syst. Error AN (xF > 0) | AN (xF < 0) | Stat. Error AN (xF > 0) | Syst. Error AN (xF > 0) | ⟨pT⟩ [GeV/c] | Error ⟨pT⟩ (stat.) [GeV/c] |
|---|---|---|---|---|---|---|---|---|---|
| 1 | 1.085e-01 | -2.869e-03 | 1.663e-02 | 2.968e-03 | 1.446e-02 | 1.636e-02 | 2.995e-03 | 6.257e+00 | 4.816e-02 |
| 2 | 1.589e-01 | -6.307e-03 | 1.734e-02 | 4.273e-03 | 1.205e-02 | 1.706e-02 | 4.222e-03 | 6.881e+00 | 5.047e-02 |
| 3 | 2.227e-01 | 4.558e-02 | 6.950e-02 | 1.961e-02 | -1.144e-02 | 6.833e-02 | 1.601e-02 | 7.865e+00 | 1.302e-01 |
Figure 9 data for FPD available at the STAR publication page. Figure 9 data for E704 available on the Phys. Lett. B server.
Figure 8 (EEMC Data cont'd')
| Bin | ⟨pT⟩ [GeV/c] | AN (xF > 0) | Stat. Error AN (xF > 0) | Syst. Error AN (xF > 0) | AN (xF < 0) | Stat. Error AN (xF > 0) | Syst. Error AN (xF > 0) |
|---|---|---|---|---|---|---|---|
| 1 | 5.512e+00 | 2.749e-03 | 1.744e-02 | 2.647e-03 | 3.755e-03 | 1.716e-02 | 2.627e-03 |
| 2 | 6.466e+00 | -1.258e-02 | 2.197e-02 | 4.493e-03 | 1.503e-02 | 2.162e-02 | 4.355e-03 |
| 3 | 7.443e+00 | 1.388e-02 | 3.108e-02 | 5.387e-03 | 2.802e-02 | 3.061e-02 | 5.762e-03 |
| 4 | 8.432e+00 | -7.111e-03 | 4.788e-02 | 6.988e-03 | 3.542e-02 | 4.705e-02 | 8.133e-03 |
| 5 | 9.439e+00 | 4.598e-02 | 7.275e-02 | 1.477e-02 | -7.144e-02 | 7.162e-02 | 2.609e-02 |
| 6 | 1.077e+01 | -1.462e-01 | 9.371e-02 | 4.341e-02 | 4.808e-02 | 9.218e-02 | 1.574e-02 |
Figure 8 (Theory)
| Bin | |xF| | AN (xF > 0) | AN (xF < 0) |
|---|---|---|---|
| 1 | 0.100 | -0.001480995 | 0.000708402 |
| 2 | 0.120 | -0.000784550 | 0.001027488 |
| 3 | 0.140 | 0.000290942 | 0.001388570 |
| 4 | 0.160 | 0.001760548 | 0.001788182 |
| 5 | 0.180 | 0.003545622 | 0.002219747 |
| 6 | 0.200 | 0.005492168 | 0.002667756 |
| 7 | 0.220 | 0.007515253 | 0.003130529 |
| 8 | 0.240 | 0.009441482 | 0.003590954 |
| 9 | 0.260 | 0.011264799 | 0.004053143 |
| 10 | 0.280 | 0.012896453 | 0.004509509 |
| 11 | 0.300 | 0.014316179 | 0.004956318 |
Figure 8 (Theory cont'd)
| Bin | pT [GeV/c] | AN (xF > 0) | AN (xF < 0) |
|---|---|---|---|
| 1 | 5.000 | -0.001480032 | 0.001029543 |
| 2 | 5.500 | -0.001178579 | 0.001223078 |
| 3 | 6.000 | -0.000786187 | 0.001436097 |
| 4 | 6.500 | -0.000333658 | 0.001661594 |
| 5 | 7.000 | 0.000135195 | 0.001889531 |
| 6 | 7.500 | 0.000653427 | 0.002131397 |
| 7 | 8.000 | 0.001213272 | 0.002386493 |
| 8 | 8.500 | 0.001734081 | 0.002634077 |
| 9 | 9.000 | 0.002270101 | 0.002890115 |
| 10 | 9.500 | 0.002816907 | 0.003153685 |
| 11 | 10.000 | 0.003369524 | 0.003423928 |
| 12 | 10.500 | 0.003858628 | 0.003681999 |
| 13 | 11.000 | 0.004342199 | 0.003943610 |
| 14 | 11.500 | 0.004818551 | 0.004208158 |
| 15 | 12.000 | 0.005287046 | 0.004474980 |
Groups:
- drach09's blog
- Login or register to post comments
