- drach09's home page
- Posts
- 2022
- 2020
- June (1)
- 2019
- 2018
- 2017
- 2016
- 2015
- 2014
- December (13)
- November (2)
- October (5)
- September (2)
- August (8)
- July (9)
- June (7)
- May (5)
- April (4)
- March (4)
- February (1)
- January (2)
- 2013
- December (2)
- November (8)
- October (5)
- September (12)
- August (5)
- July (2)
- June (3)
- May (4)
- April (8)
- March (10)
- February (9)
- January (11)
- 2012
- 2011
- October (1)
- My blog
- Post new blog entry
- All blogs
Run-12 Transverse Jets: Cross-check with Kevin
Now that the xF < 0 issue appears to be resolved, it is useful to make one more apples-to-apples comparison with Kevin. For this comparison, I have removed the geometric trigger and edited the Nhits cut to require a miminum of 21 hits rather than the minimum of 6 applied to Nhits, dE/dx. Also, I have added additional z-bins to correspond to Kevin's definitions. Our polarization corrections are still a bit different, but he will implement the fill-by-fill corrections, soon. Also, I still implement my high-pT cut at 9.9 GeV/c to correspond with my jet-pT binning.
pT > 9.9 GeV/c
Figure 1: Total Range of Pseudorapidity
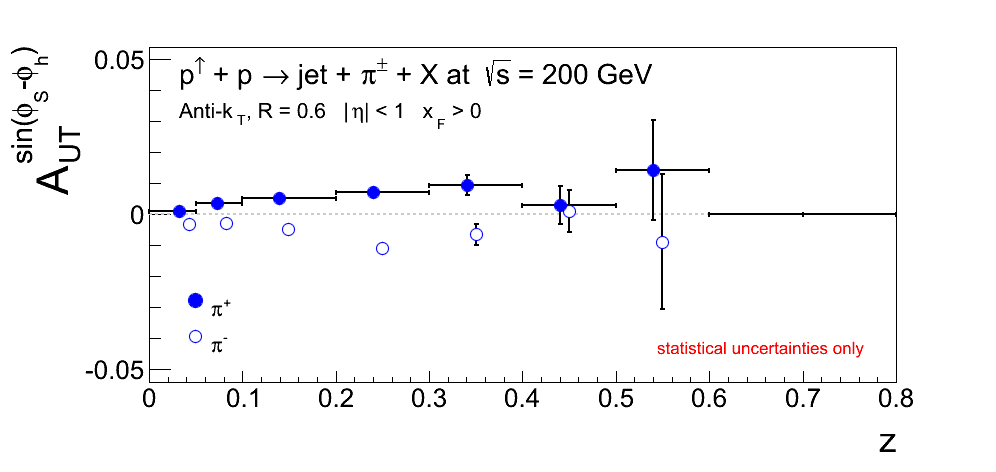
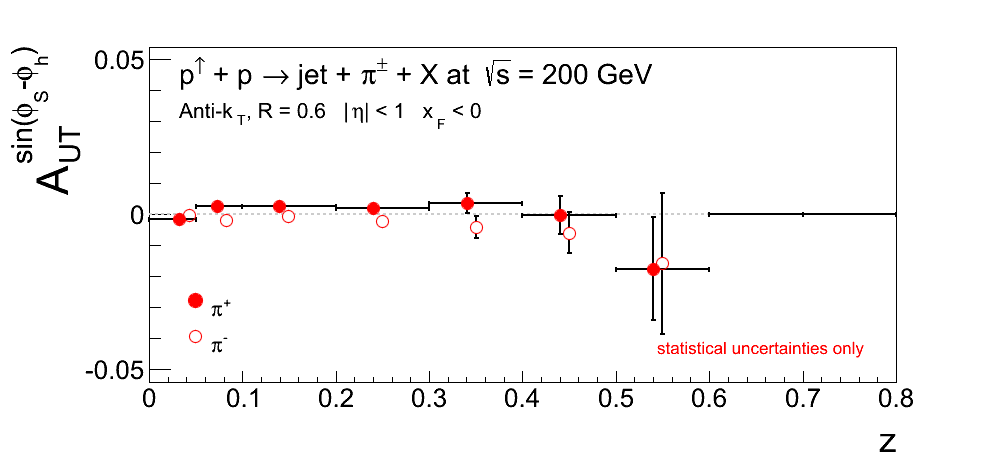
Figure 2: |η| < 0.5
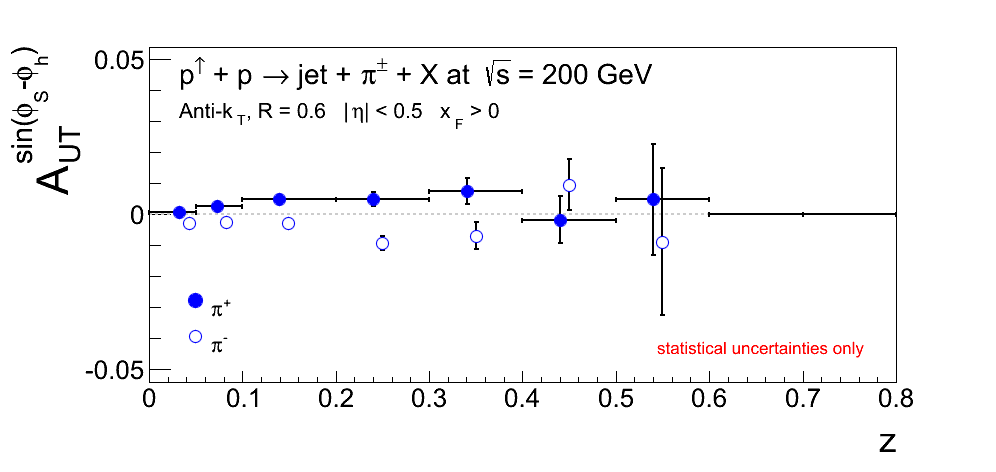
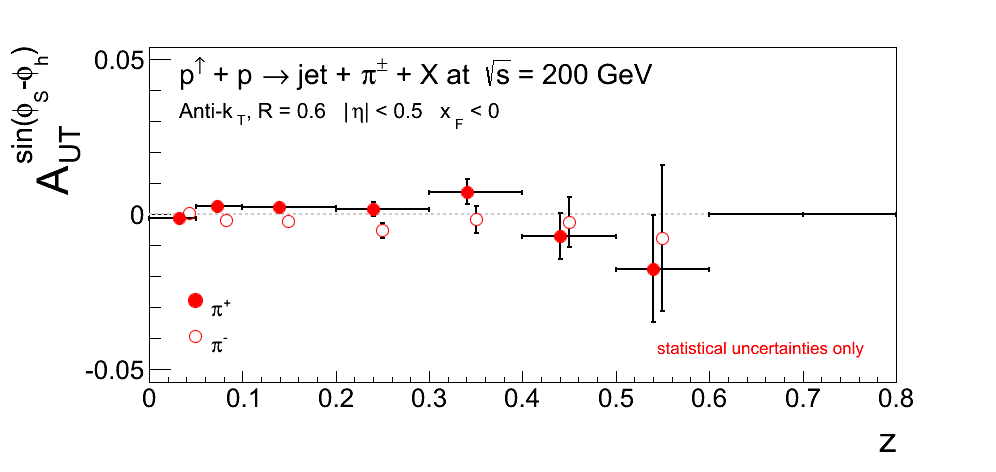
Figure 3: 0.5 < |η| < 1
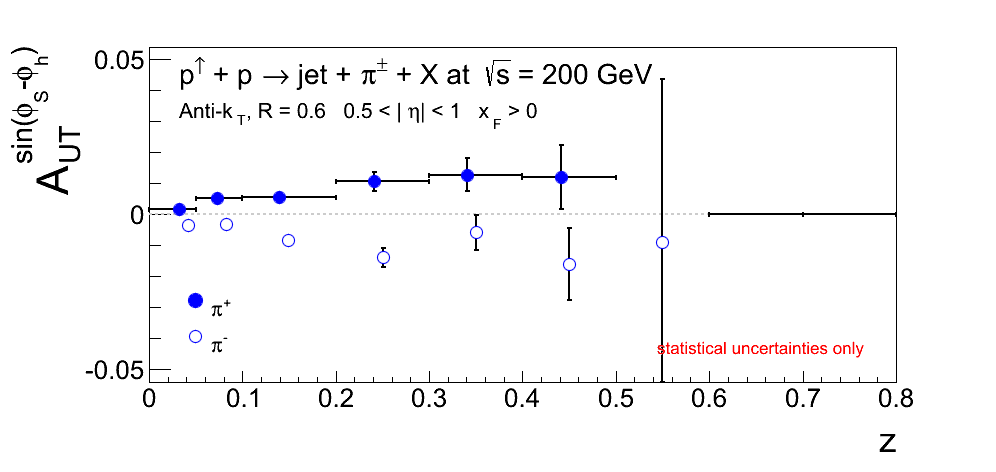
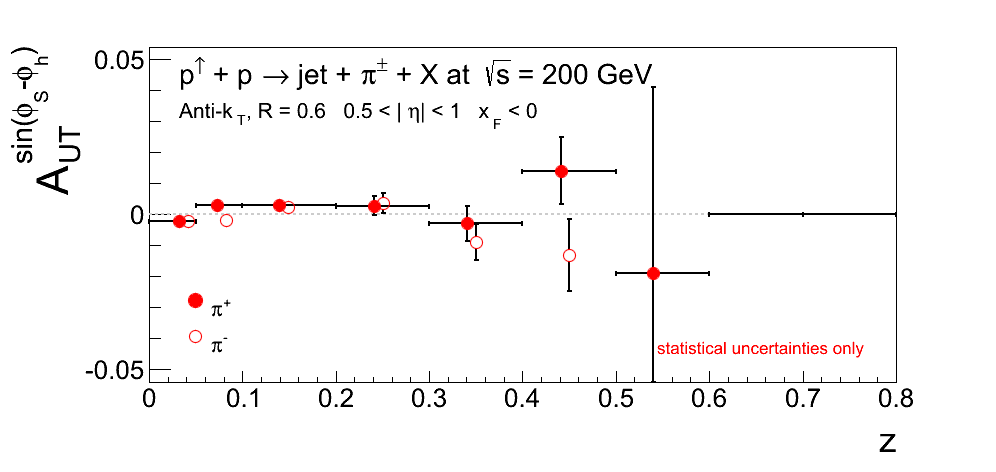
Table 1: π+
| xF > 0 | xF < 0 | |||||||||||
| η Range | Linear Fit | Uncertainty | χ2/ν | Constant Fit | Uncertainty | χ2/ν | Linear Fit | Uncertainty | χ2/ν | Constant Fit | Uncertainty | χ2/ν |
| |η| < 1 | 0.0320 | 0.00396 | 6.078/5 | 0.00350 | 0.000487 | 19.42/6 | 0.0129 | 0.00397 | 13.95/5 | 0.00126 | 0.000488 | 17.75/6 |
| |η| < 0.5 | 0.0254 | 0.00493 | 5.508/5 | 0.00281 | 0.000606 | 10.37/6 | 0.0125 | 0.00489 | 11.32/5 | 0.00133 | 0.000601 | 12.94/6 |
| 0.5 < |η| < 1 | 0.0439 | 0.00663 | 3.520/5 | 0.00476 | 0.000817 | 13.37/6 | 0.0136 | 0.00680 | 7.822/5 | 0.00113 | 0.000834 | 9.991/6 |
Table 2: π-
| xF > 0 | xF < 0 | |||||||||||
| η Range | Linear Fit | Uncertainty | χ2/ν | Constant Fit | Uncertainty | χ2/ν | Linear Fit | Uncertainty | χ2/ν | Constant Fit | Uncertainty | χ2/ν |
| |η| < 1 | -0.0338 | 0.00411 | 15.45/5 | -0.00397 | 0.000494 | 18.57/6 | -0.0106 | 0.00412 | 2.707/5 | -0.00117 | 0.000495 | 3.739/6 |
| |η| < 0.5 | -0.0252 | 0.00511 | 12.74/5 | -0.00317 | 0.000615 | 10.52/6 | -0.0155 | 0.00507 | 2.966/5 | -0.00145 | 0.000610 | 6.700/6 |
| 0.5 < |η| < 1 | -0.0493 | 0.00690 | 6.741/4 | -0.00543 | 0.000832 | 15.20/5 | -0.00102 | 0.00705 | 12.06/5 | -0.000636 | 0.000848 | 11.52/6 |
So, by in large, the values are quite similar to my previous update. The trends are a bit cleaner. This could perhaps be the effect of more statistics, but also could be the result of the Nhits > 20 cut. Perhaps, the present cut is more selective of good pion events. For xF > 0 and the full range of psuedorapidity, Kevin sees averages of 0.00356±0.000511 and ‐0.00415±0.000519 for π+ and π-, respectively. For xF < 0 and the full range of pseudorapidity, Kevin sees averages of 0.00141±0.000504 and -0.00115±0.000509 for π+ and π-, respectively.
pT < 9.9 GeV/c
Figure 4: Total Range of Pseudorapidity
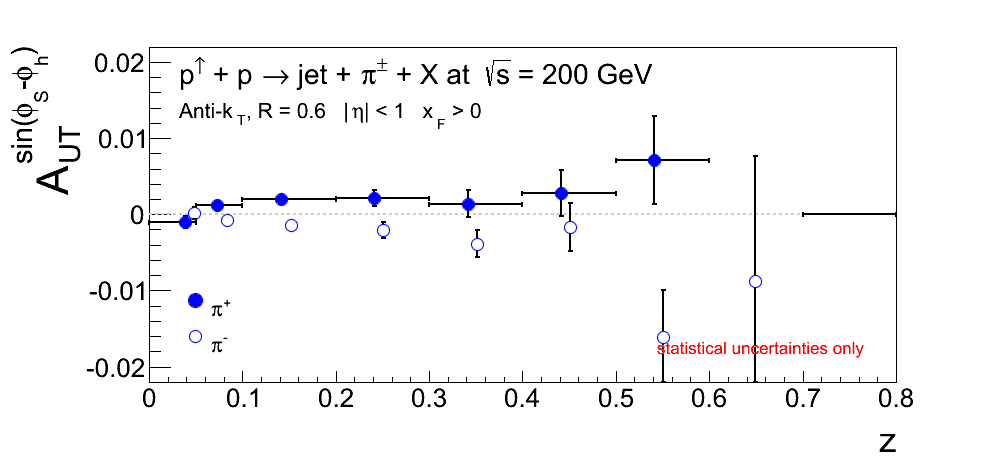
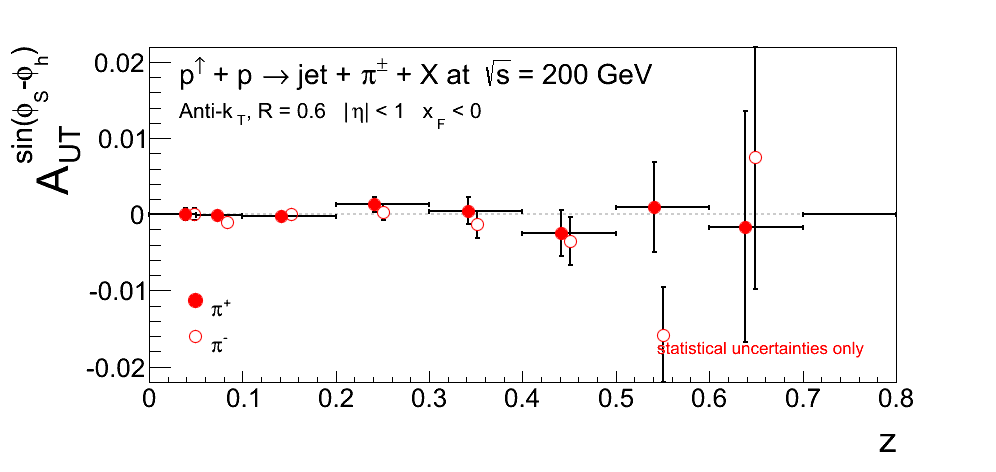
Figure 5: |η| < 0.5
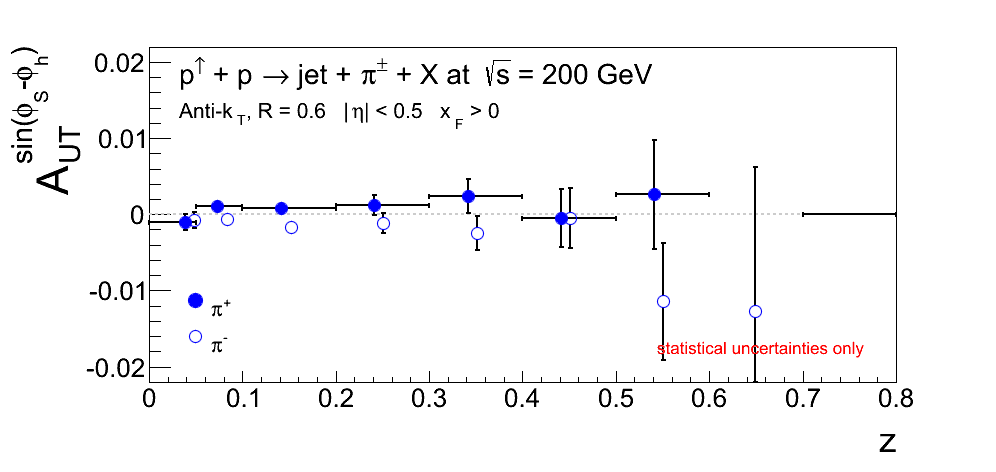
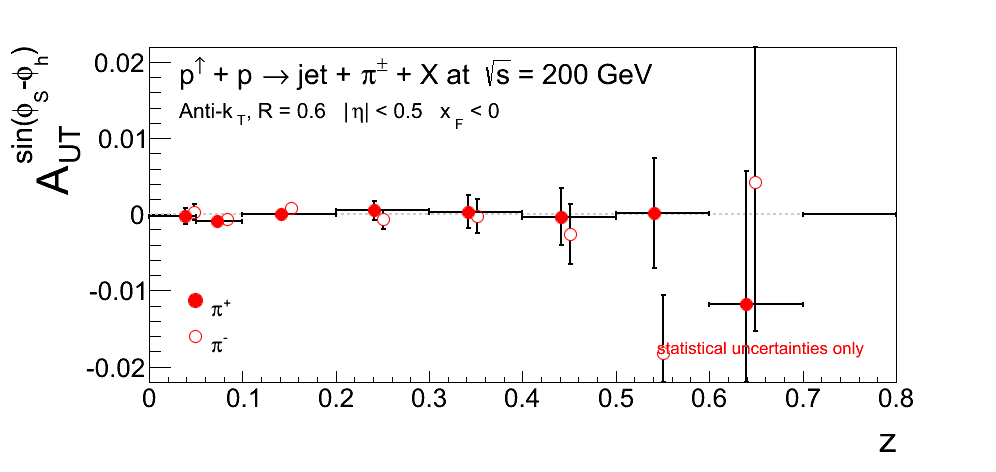
Figure 6: 0.5 < |η| < 1
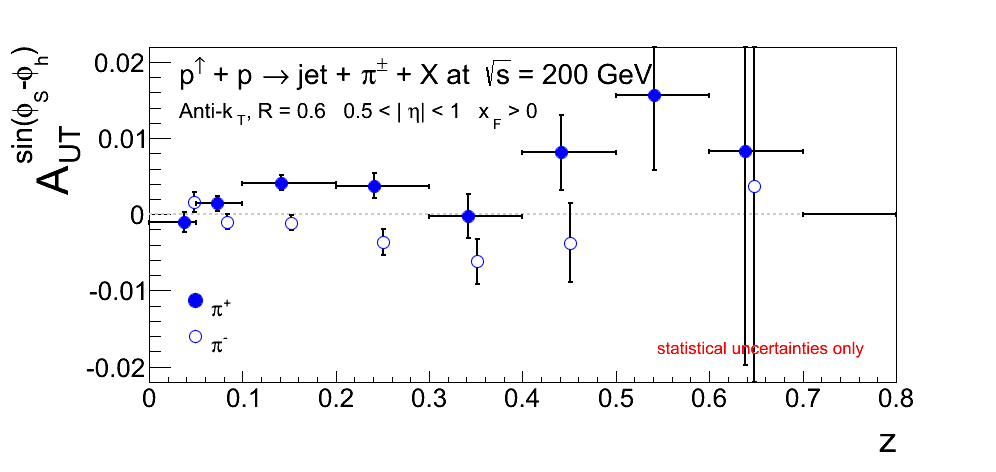
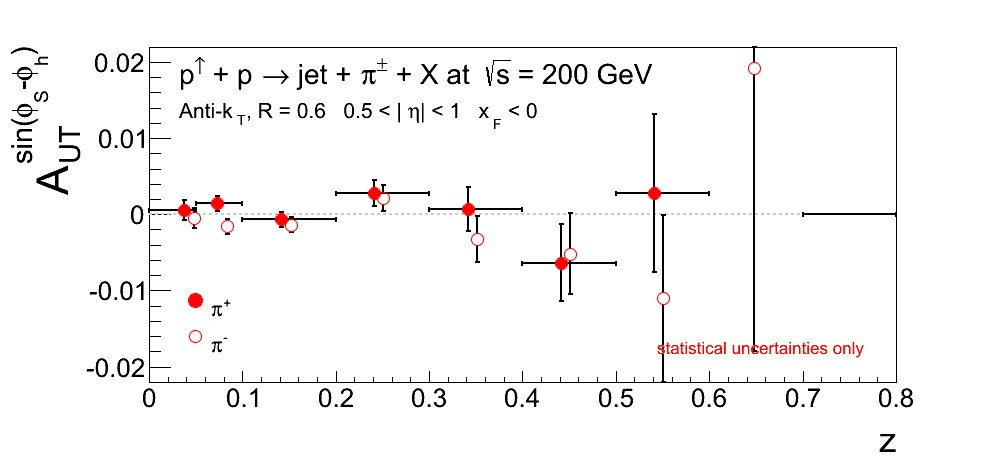
Table 3: π+
| xF > 0 | xF < 0 | |||||||||||
| η Range | Linear Fit | Uncertainty | χ2/ν | Constant Fit | Uncertainty | χ2/ν | Linear Fit | Uncertainty | χ2/ν | Constant Fit | Uncertainty | χ2/ν |
| |η| < 1 | 0.00910 | 0.00221 | 11.66/6 | 0.00122 | 0.000337 | 15.42/7 | 0.000771 | 0.00222 | 2.569/6 | 4.95e-05 | 0.000337 | 2.668/7 |
| |η| < 0.5 | 0.00451 | 0.00278 | 9.490/6 | 0.000636 | 0.000424 | 9.862/7 | 0.000427 | 0.00276 | 2.303/6 | -0.000272 | 0.000420 | 1.907/7 |
| 0.5 < |η| < 1 | 0.0170 | 0.00364 | 9.805/6 | 0.00223 | 0.000555 | 15.39/7 | 0.00295 | 0.00372 | 7.632/6 | 0.000631 | 0.000565 | 7.011/7 |
Table 4: π-
| xF > 0 | xF < 0 | |||||||||||
| η Range | Linear Fit | Uncertainty | χ2/ν | Constant Fit | Uncertainty | χ2/ν | Linear Fit | Uncertainty | χ2/ν | Constant Fit | Uncertainty | χ2/ν |
| |η| < 1 | -0.00989 | 0.00226 | 4.359/6 | -0.00114 | 0.000342 | 12.35/7 | -0.00321 | 0.00227 | 9.227/6 | -0.000421 | 0.000342 | 9.719/7 |
| |η| < 0.5 | -0.00809 | 0.00283 | 2.690/6 | -0.00115 | 0.000430 | 3.707/7 | -0.00186 | 0.00281 | 8.042/6 | -8.89e-05 | 0.000426 | 8.436/7 |
| 0.5 < |η| < 1 | -0.0131 | 0.00375 | 6.742/6 | -0.00113 | 0.000565 | 14.85/7 | -0.00569 | 0.00382 | 7.283/6 | -0.00102 | 0.000574 | 6.320/7 |
Again, the values are similar to my previous update. The trends, again, appear to be a bit cleaner. For xF > 0 and the full range of pseudorapidity, Kevin sees averages of 0.00122±0.000348 and -0.00119±0.000353 for π+ and π-, resectively. For xF < 0, he sees averages of 2.29e-05±0.000345 and -0.000556±0.000351.
Summary
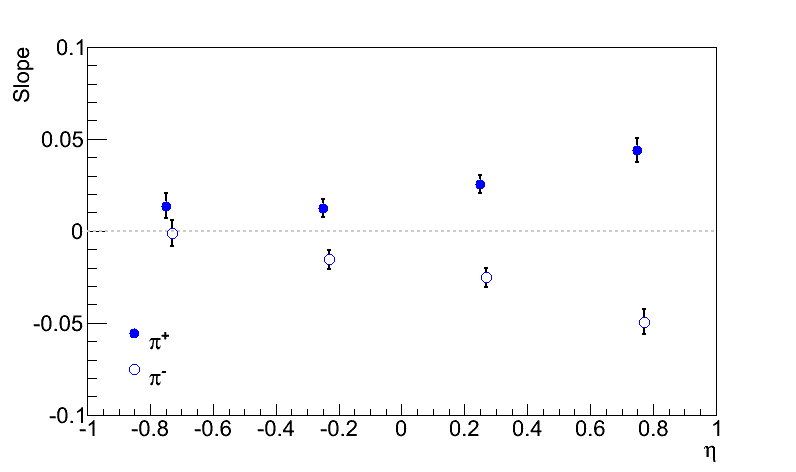
Figure 7
| pT > 9.9 GeV/c | pT < 9.9 GeV/c |
 |
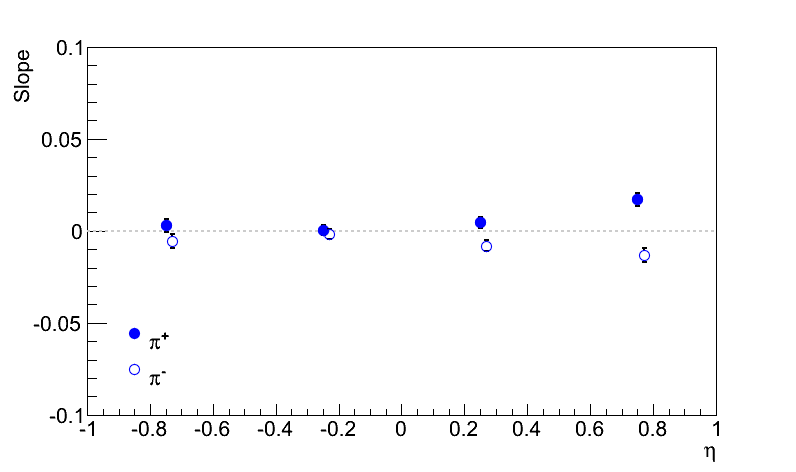 |
In Fig. 7 I post the slopes as a function of η. The behavior is quite similar to my previous results. The differences may be statistically significant given the high degree of correlation between the events.
- drach09's blog
- Login or register to post comments
