- drach09's home page
- Posts
- 2022
- 2020
- June (1)
- 2019
- 2018
- 2017
- 2016
- 2015
- 2014
- December (13)
- November (2)
- October (5)
- September (2)
- August (8)
- July (9)
- June (7)
- May (5)
- April (4)
- March (4)
- February (1)
- January (2)
- 2013
- December (2)
- November (8)
- October (5)
- September (12)
- August (5)
- July (2)
- June (3)
- May (4)
- April (8)
- March (10)
- February (9)
- January (11)
- 2012
- 2011
- October (1)
- My blog
- Post new blog entry
- All blogs
Run-11 Transverse Jets: Attempt to Simulate Trigger Prescales in Embedding
I present, here, a, so-far, unsuccessful attempt to mock-up the data trigger prescales for weighting the embedding simulations. The idea was to calculate from the data an "average" pT-depednent prescale for each class of triggers. This could then be an additional weight to the simulation to preserve the orthogonal sets of triggers. The prescale "function" was determined by taking the ratio of two sets of histograms: one where the events are simply binned in pT and one where the event is weighted by the prescale of the most restrictive hardware trigger satisfied for the event. The prescales were calculated in the data for an assortment of event classes (described below) and applied to embedding distributions for the same assortment of event classes.
For this attempt, the trigger assignment is such that events are pushed to the most restrictive possible, based upon the software trigger, geometric trigger, being above the TCU-dependent "floor," and the pT cut for that trigger. For the sake of a comprehensive comparison, within the trigger assignment, the events are binned further based upon the most restrictive satisfied hardware, geometric, and software triggers. For comparing to embedding, the data distributions are summed over the hardware triggers and the embedding distributions are weighted by the calculated data prescales for the appropriate event class. The embedding distributions are normalized so that integrated event yield summed over all event classes matches that of the data.
Calculated Prescales
Figure 1
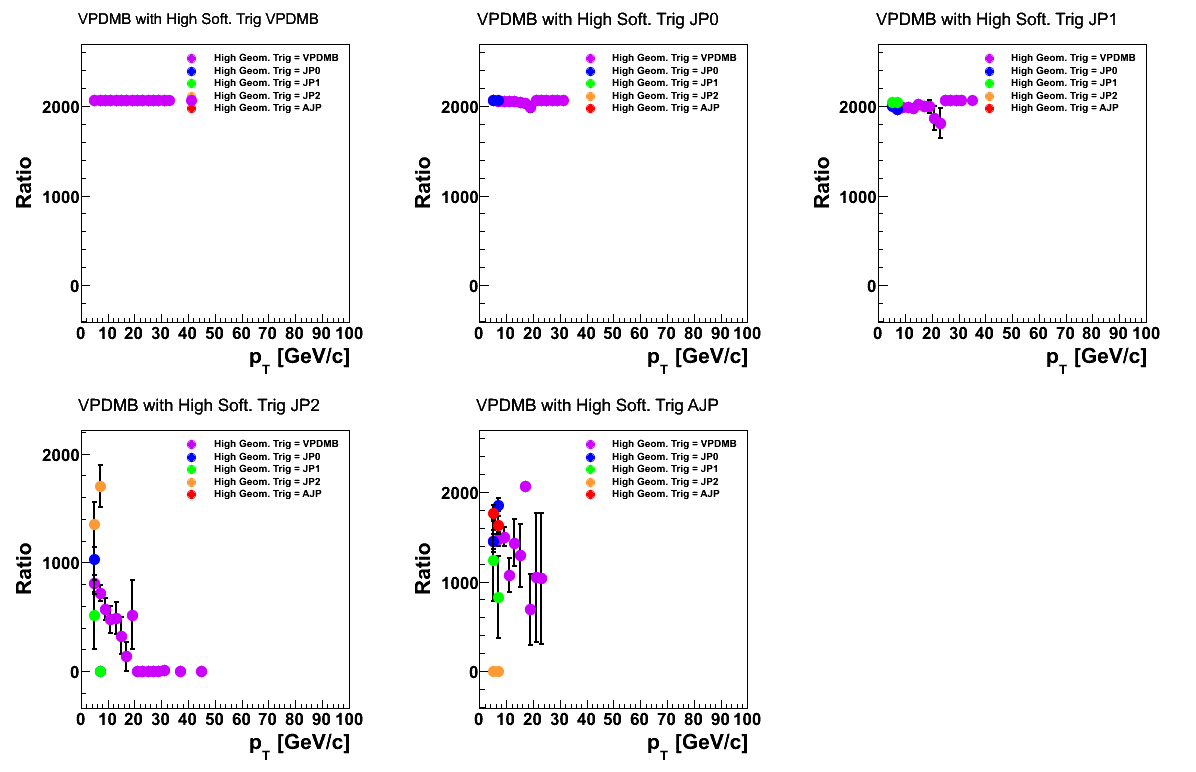
In Fig. 1 I show the calculated prescale distribution for the various classes of VPDMB events. There is, as yet, no VPDMB software trigger, so the hardware trigger is substituted. The prescales are calculated by taking the ratio of two distributions: the pT distribution summed over the class of "most restrictive hardware triggers" and the pT distribution summed over the class of "most restrictive hardware triggers" and weighted by the prescale for that hardware trigger. In other words, the weighted events are assigned the prescale for the most restructive hardware trigger satisfied. The uncertainties correctly account for the huge statistical correlation between the two distributions. One can see that for the bulk of events, the prescale is dominated by that of the VPDMB trigger which is huge.
Figure 2
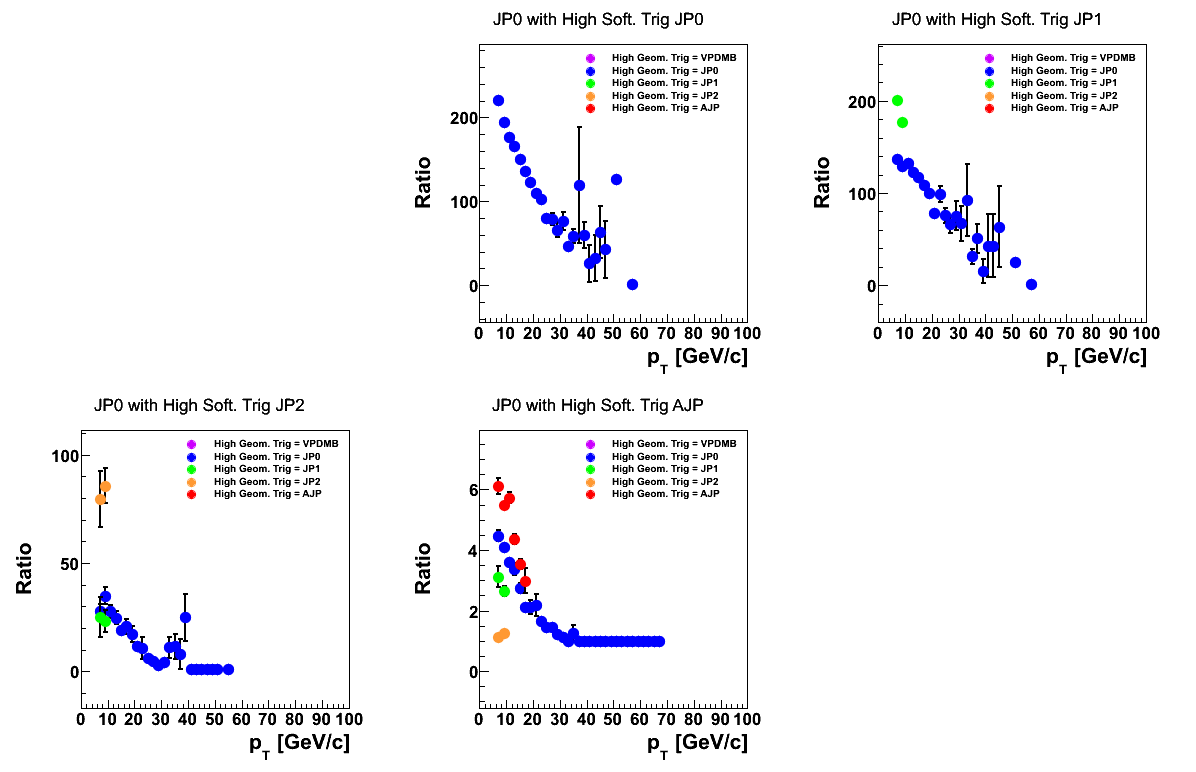
In Fig. 2 I show the calculated prescale distribution for the various classes of JP0 events. The first square (VPDMB "software triggers") is empty as the event must satisfy at least the JP0 simulator. Events tend to show an average prescale which decreases toward higher pT. This is consistent wiht a picture of a higher percentage of events firing a higher level of trigger in the TCU. One can see quite clearly that for AJP software events the prescale approaches unity (AJP was a take-all trigger) around 30 GeV/c.
Figure 3
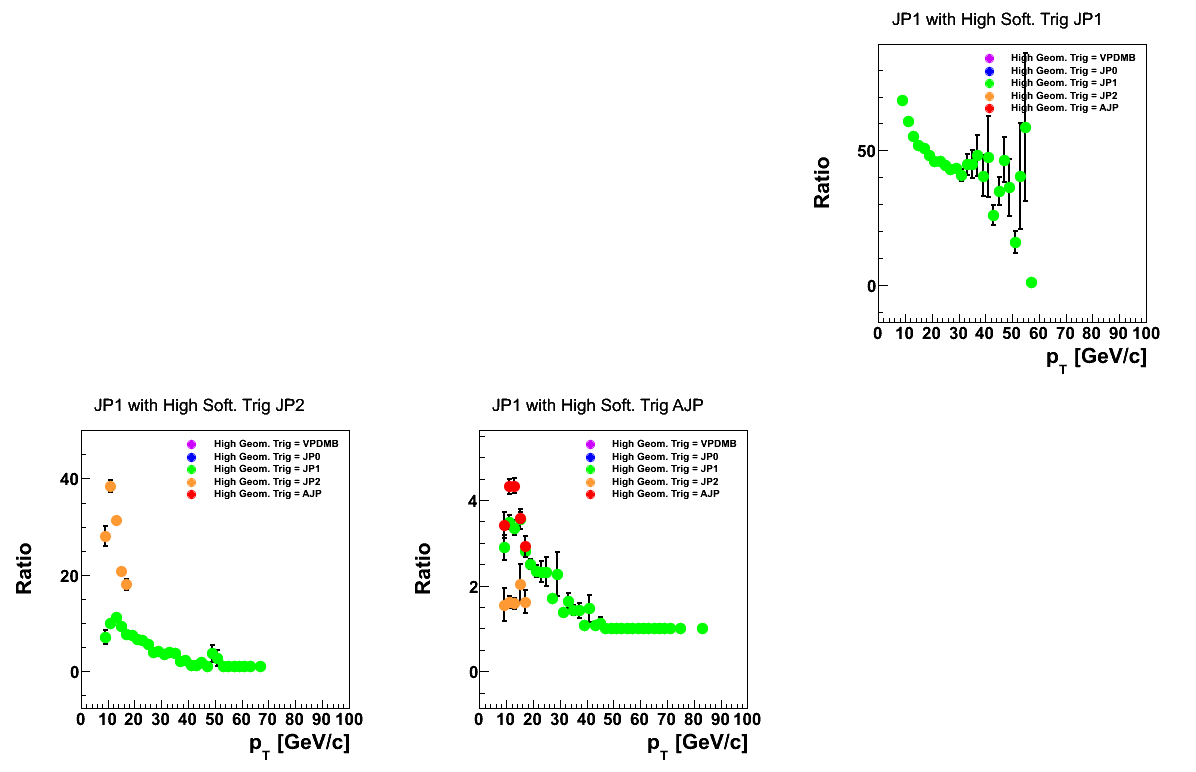
Figure 3 shows the prescale distributions for JP1. They are qualitatively similar to those for JP0.
Figure 4
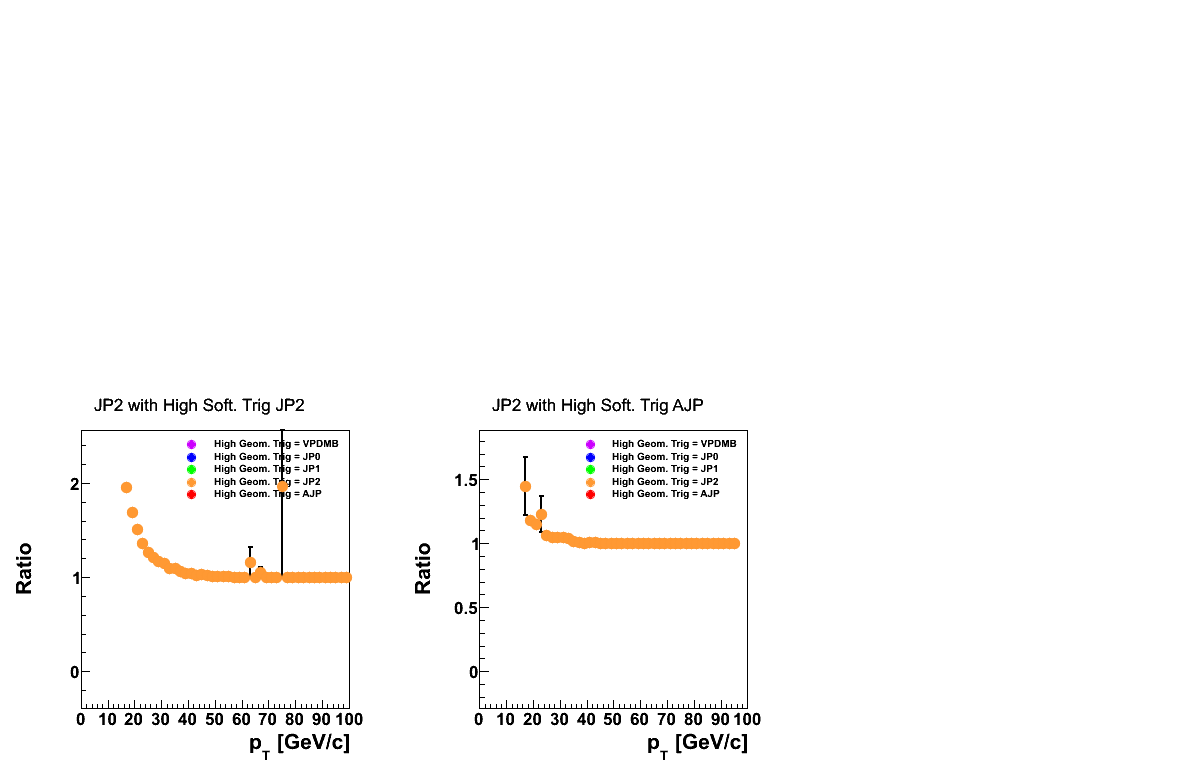
In Fig. 4 I show the prescale distributions for JP2. One can see the effective prescale rapidly approaches unity for both software JP2 and AJP events. These distributions assume unity for the JP2 prescale. This is true, however, the data trigger is actually JP2*L2JetHigh. This will likely introduce some discrepancy at low-pT between data and embedding. One may expect the data distribution to be a harder spectrum than embedding.
Figure 5
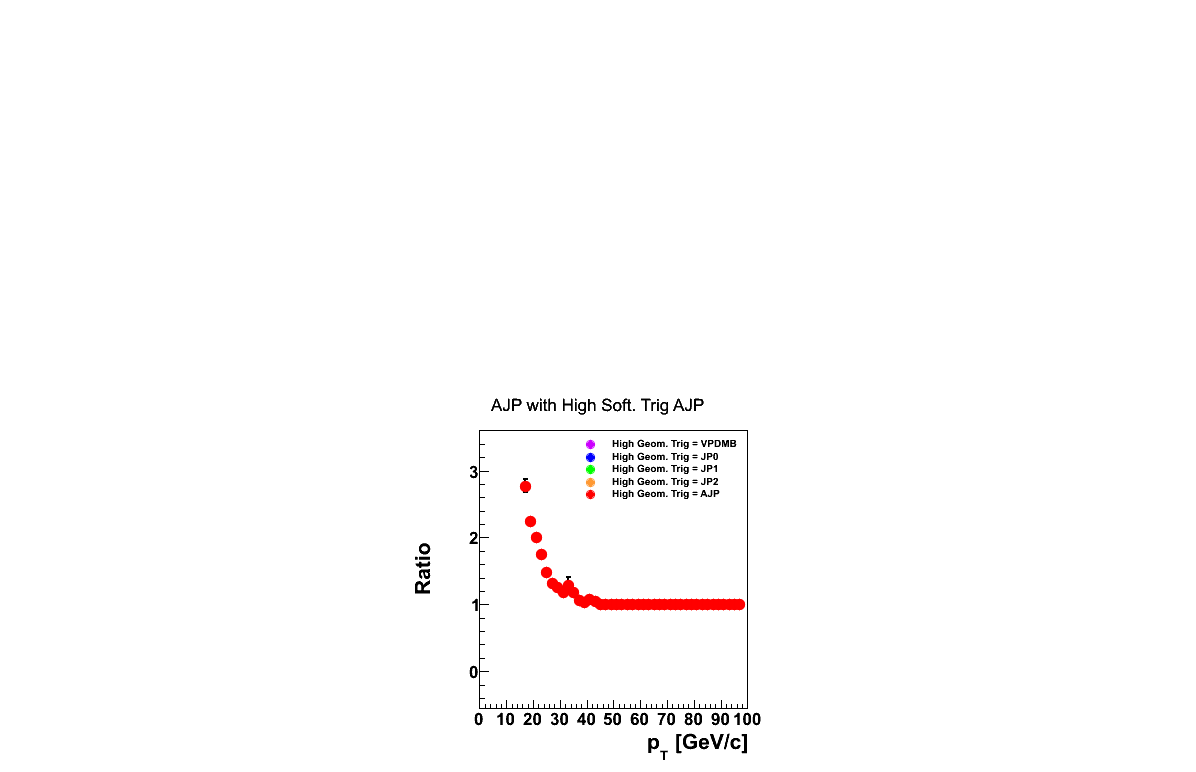
The distribution for AJP triggers in Fig. 5 is a single panel, as AJP is for this purpose treated as the most restrictive trigger. In practice, I will combine AJP and JP2 into a single trigger class. However, here, I found it prudent to keep the two separated for purposes of locating data/embedding discrepancies.
Event Class Comparison
To compare data and embedding distributions, I compare the unweighted data to "prescaled" embedding. The "prescaled" embedding is generated by dividing the embedding distributions by the "ratio" distribution for the relevant event class, as shown above. Data are shown as solid circles, while embedding are shown as open circles. The distributions are normalized so that the sum of all event classes reflects the total number of data events for that trigger.
Figure 6
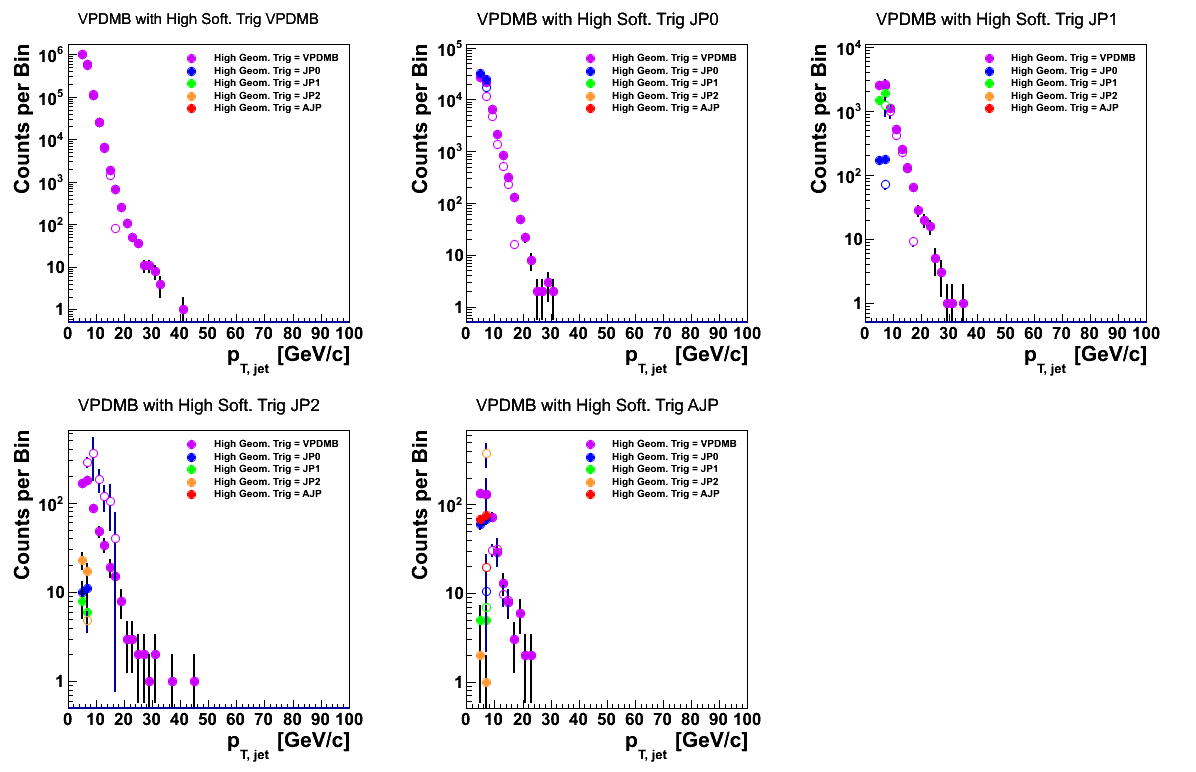
In Fig. 6, I show the data-embedding comparison for VPDMB triggers by event class. For normalization sake, I keep the range at 6 < pT < 15 GeV/c, which is the current cut-off in embedding. One can see that in general, the agreement is good for all classes of events except for JP2 software trigger events. Under the current normalization, the embedding overshoot the data. The same effect is reflected in JP0 and JP1, below, with much greater precision.
Figure 7
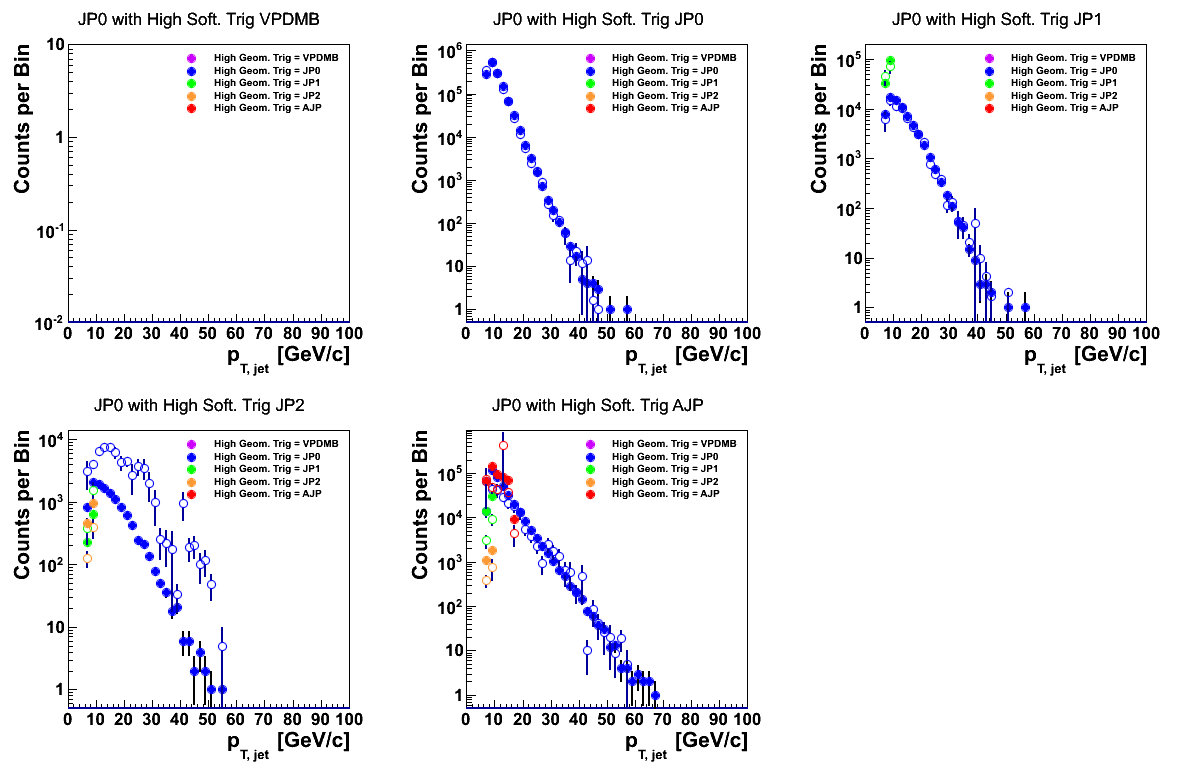
Again, under the current normalization, the agreement between data and embedding, outside of JP2 software triggers, is quite good. For JP2 software triggers, in particular for those with a high geometric trigger of JP0, embedding significanly over shoot data. In AJP software triggers there appears to be a discontinuity around 30 GeV/c and the shapes may be slightly different.
Figure 8
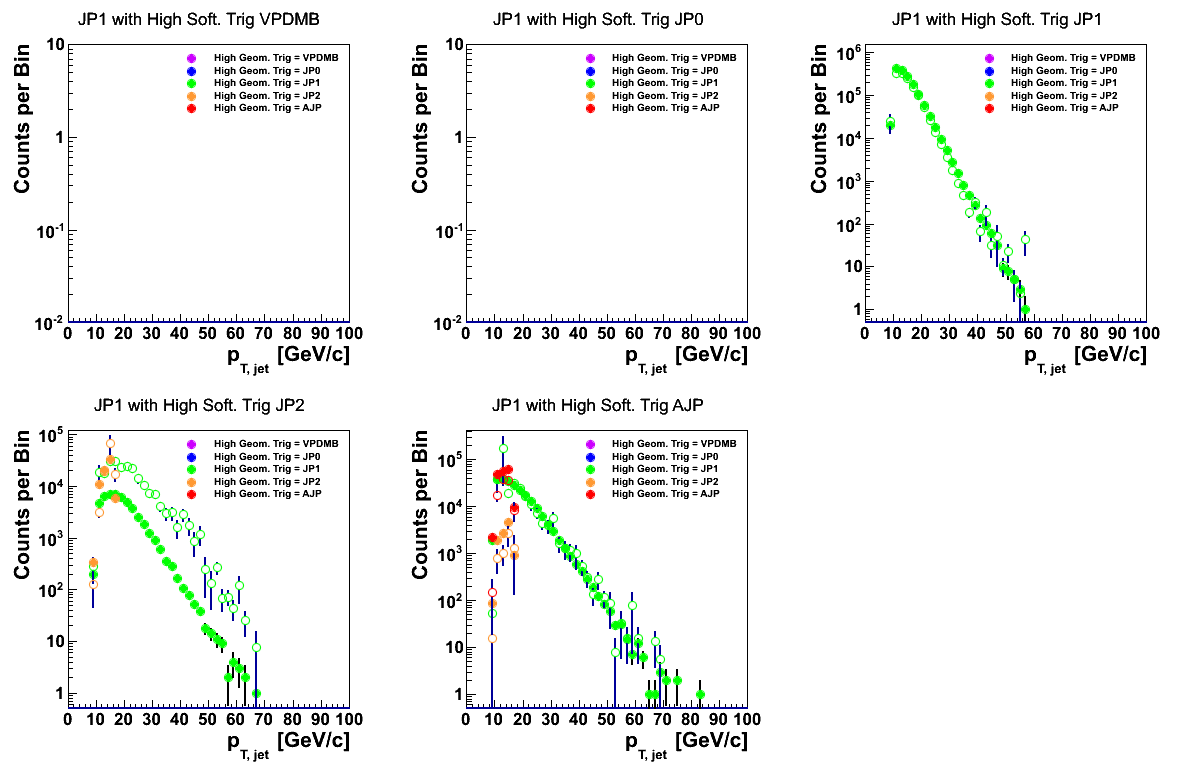
Again, the distributions for JP1 agree quite well outside of JP2 software triggers. Events with a JP2 software trigger and JP1 geometric trigger way overshoot the data in the current normalization.
Figure 9
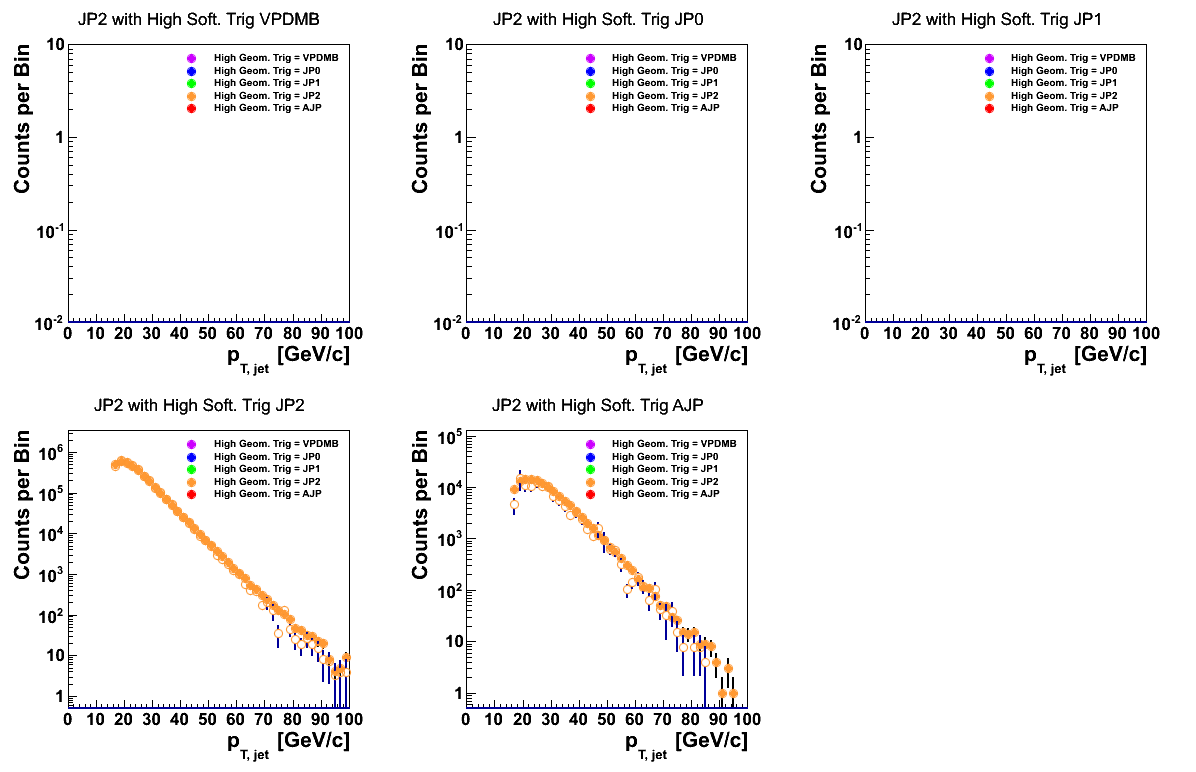
JP2 events seem to agree exceptionally well (too well?) for the two relevant event classes.
Figure 10
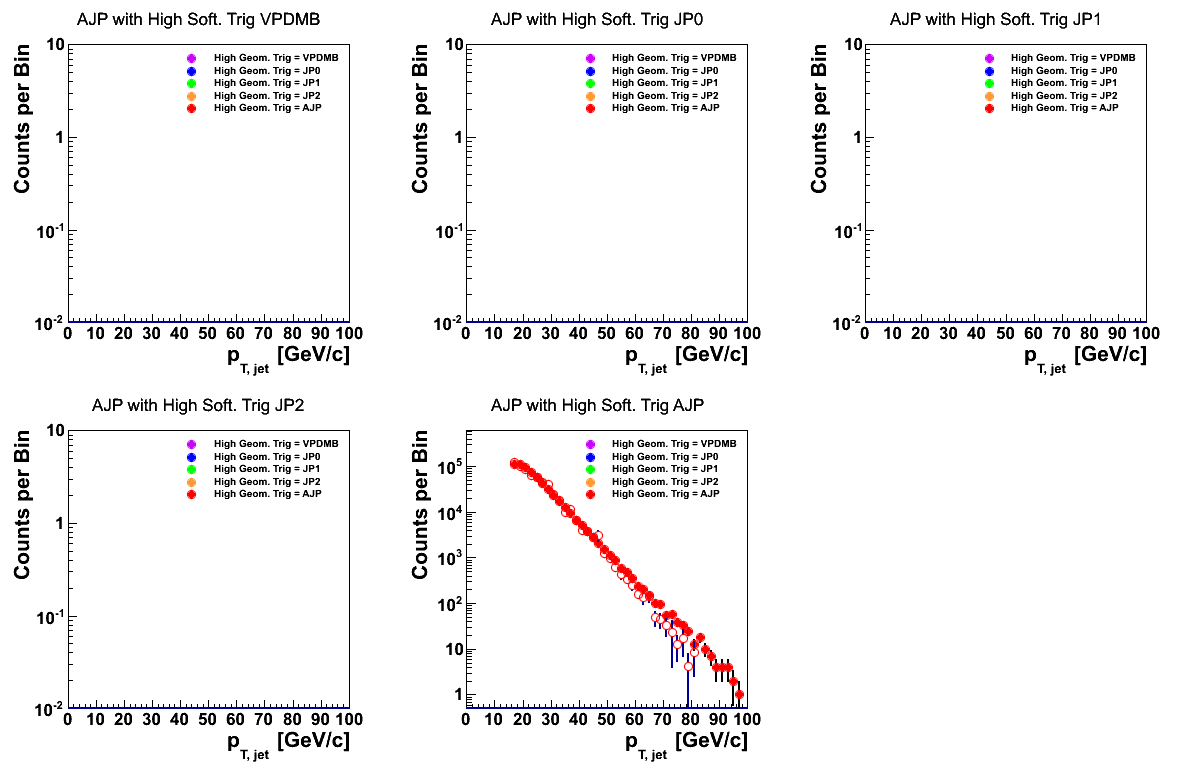
AJP events also appear to agree quite well, with perhaps the data distribution a bit harder than the embedding at (very) high pT.
Final Distribution Comparison
As a last comparison, I sum over all event classes to compare the total embedding and data distributions for the assigned triggers. As explained before, the embedding have been normalized so that the integrated yield matches that of the data.
Figure 11
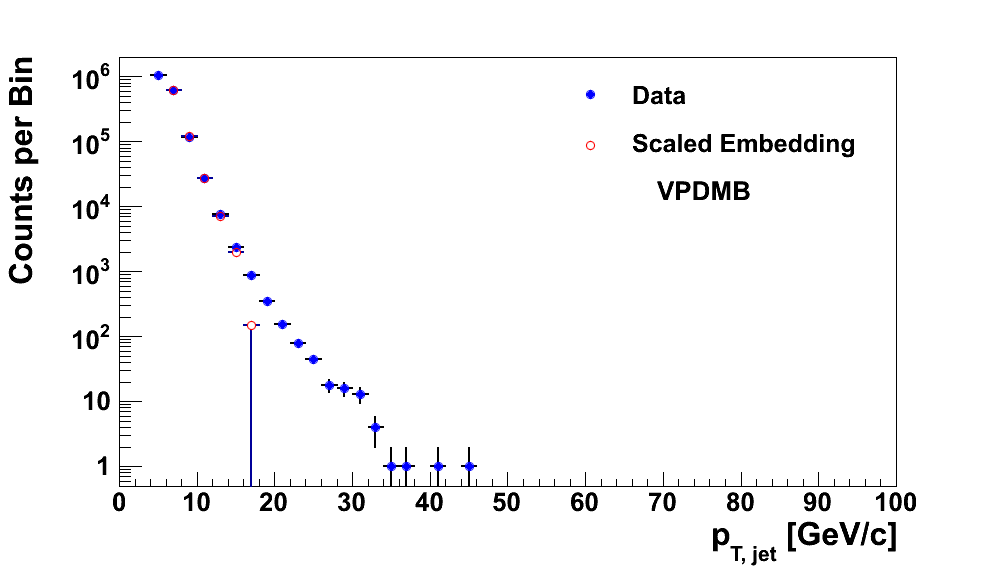
In Fig. 11 I show the comparison of data and embedding for VPDMB triggers. As we've now seen many times, the distributions agree quite well. The dropoff in the final bin is largely due to the fact that VPDMB triggers are cutoff at 16.3 GeV/c which clashes with the binning for these distributions.
Figure 12
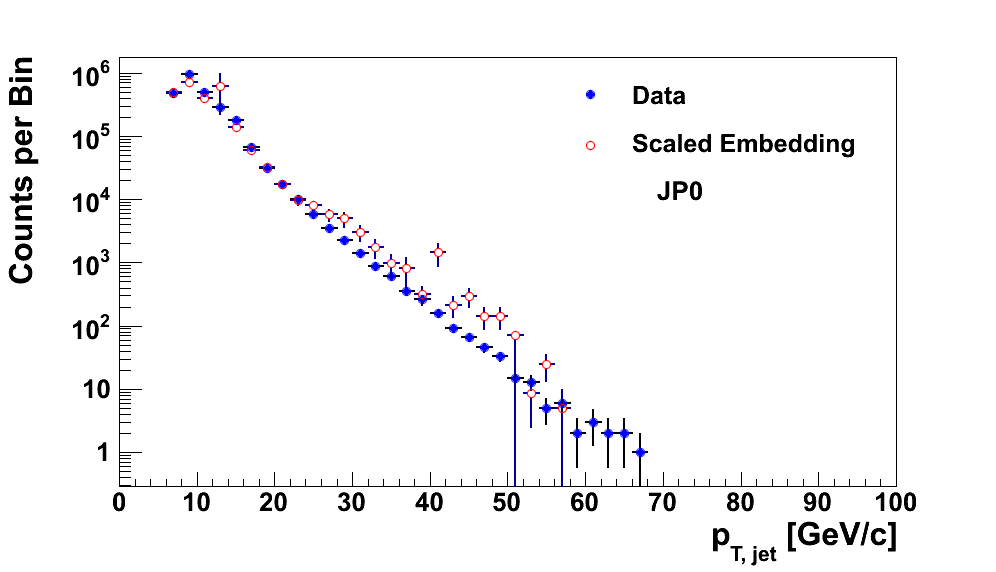
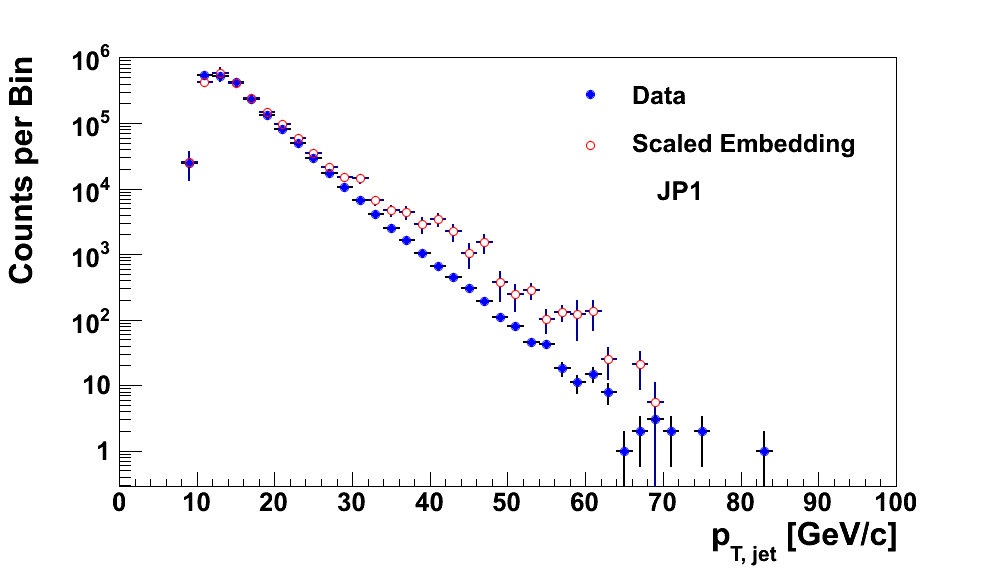
In Fig. 12 I show the total distributions for JP0 and JP1. One can see the bulge around 25-30 GeV/c where the embedding overshoot the data. From the above study, this appears to be due to JP2 software events with a high geometric trigger of JP0 (left) or JP1 (right).
Figure 13
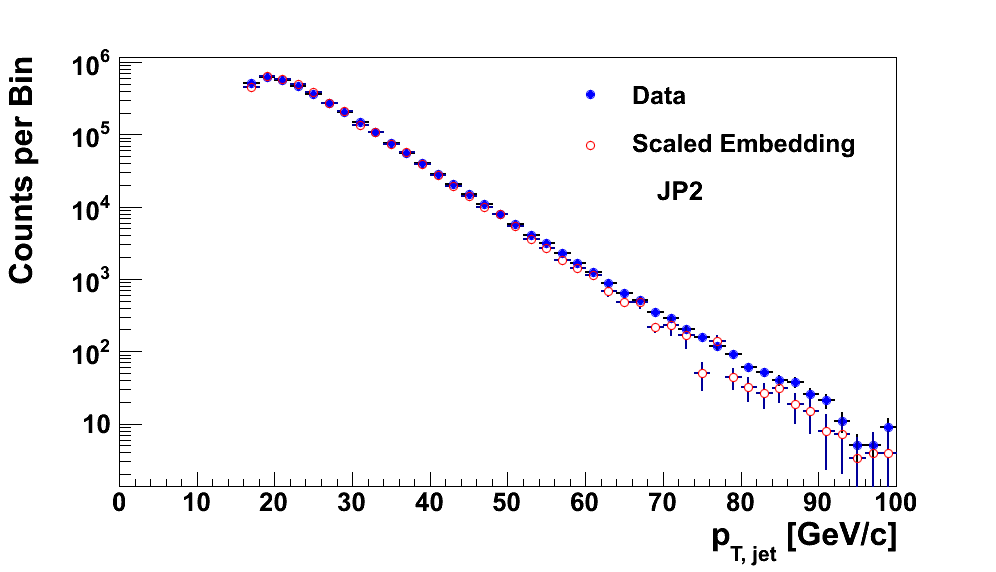
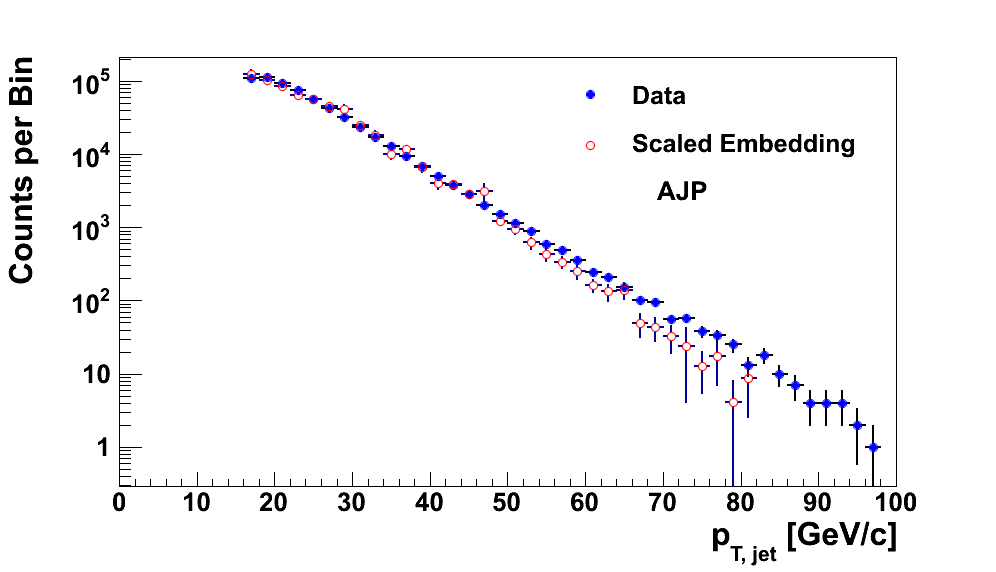
In Fig. 13, I show the distributions for JP2 and AJP. In each case, the distributions match extremely well. The data appear to be a bit harder at high-pT in each case.
Final Thought
Looking at similar plots for prescale corrected data vs. embedding, the same JP2 software trigger feature is present. However, the effect is small relative to the overall (prescale-corrected) yield, so it gets buried in the noise. Also, previous plots I showed only looked at jets below pT = 55 GeV. Expanding the axis range as in the present figures does show an apparent discrepancy at high-pT. Again, however the size of the feature is effectively reduced due to the size of the prescale correction. An example is shown below in Figs. 14 and 15 for JP0.
Figure 14
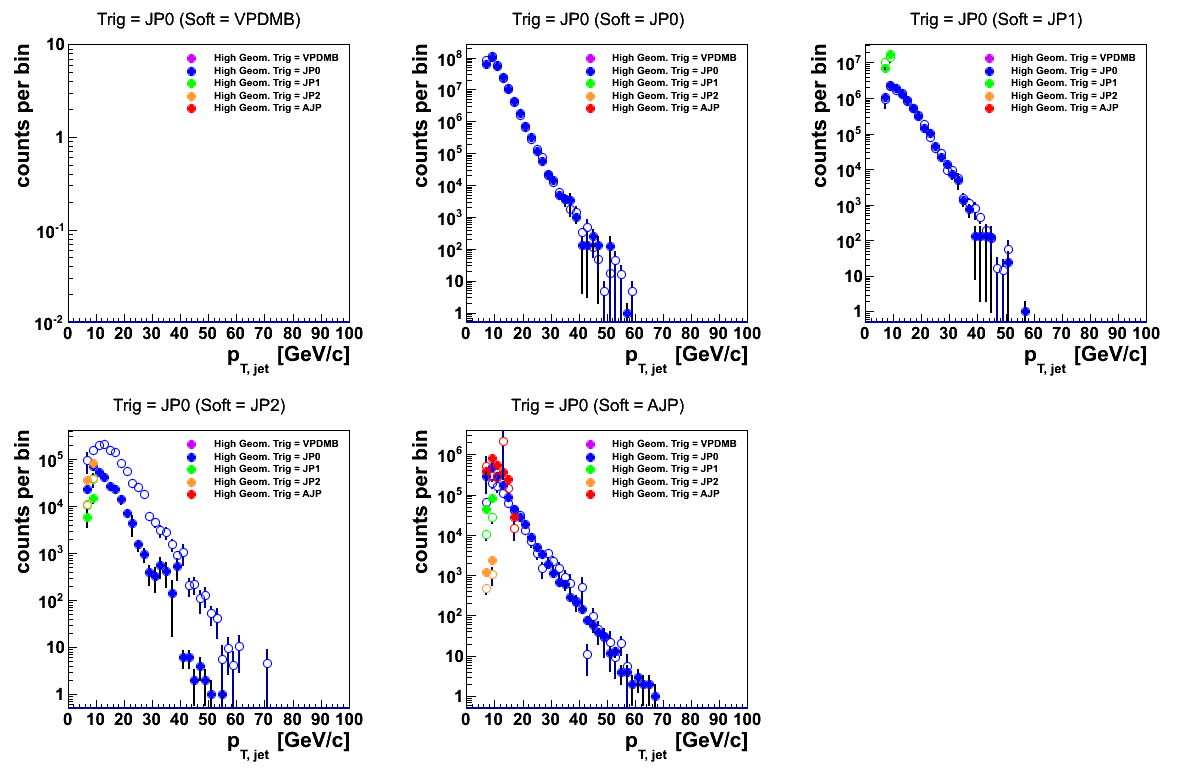
When one evaluates the prescale-corrected distributions one sees that the same discrepancy appears in the JP2 software trigger events. However, the vertical scales give a quick indication of why the effect is not as noticeable.
Figure 15
.png)

Previous plots of the data-embedding comparison normalized all distributions to sum to unity. Here, I normalize the embedding to the number of data counts and expand the range of the axes. One can indeed see the disagreement in the prescale-corrected distribution (left), however, it is not manifest until about 5 decades down the vertical scale. This was hidden in previous plots. Comparing to the prescale-weighted distribution (right) from above, the disagreement is manifest about 3 decades down the vertical scale. This is apparently due to the prescale effectively suppressing the events with a less-restrictive trigger.
- drach09's blog
- Login or register to post comments
