- fisyak's home page
- Posts
- 2025
- 2024
- December (2)
- November (1)
- October (4)
- September (3)
- August (6)
- July (3)
- June (3)
- March (1)
- February (4)
- January (2)
- 2023
- December (2)
- November (1)
- October (2)
- September (3)
- August (3)
- July (2)
- June (4)
- April (2)
- March (2)
- February (1)
- January (2)
- 2022
- 2021
- December (2)
- October (2)
- September (1)
- August (2)
- June (3)
- May (1)
- April (2)
- March (3)
- February (5)
- January (4)
- 2020
- 2019
- 2018
- 2017
- December (3)
- October (2)
- September (1)
- August (7)
- July (3)
- May (2)
- April (1)
- February (1)
- January (2)
- 2016
- 2015
- November (1)
- October (2)
- September (4)
- August (1)
- July (1)
- June (2)
- May (4)
- April (1)
- March (1)
- February (3)
- January (1)
- 2014
- 2013
- 2012
- 2011
- 2010
- My blog
- Post new blog entry
- All blogs
STAR beam line parameters evolution versus time
STAR has measured for last 12 years beam line parameterized as
- x = x0 + dxdz*z,
- y = y0 + dydz*z
I am curious what we can learn from
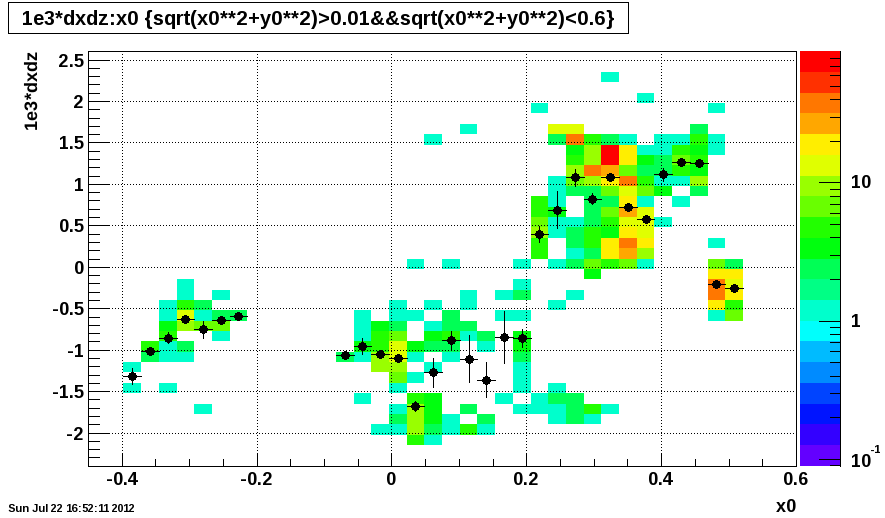
- correlations between x0 and dxdz,
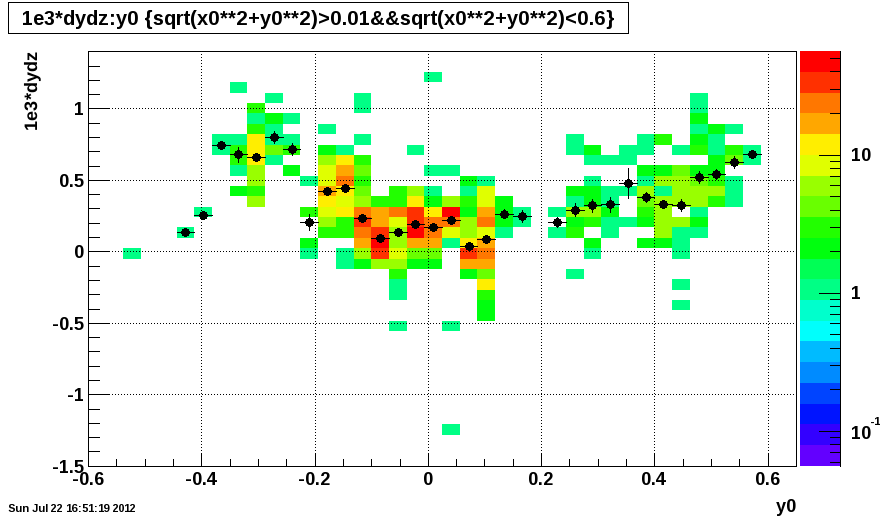
- correlations between y0 and dydz, and
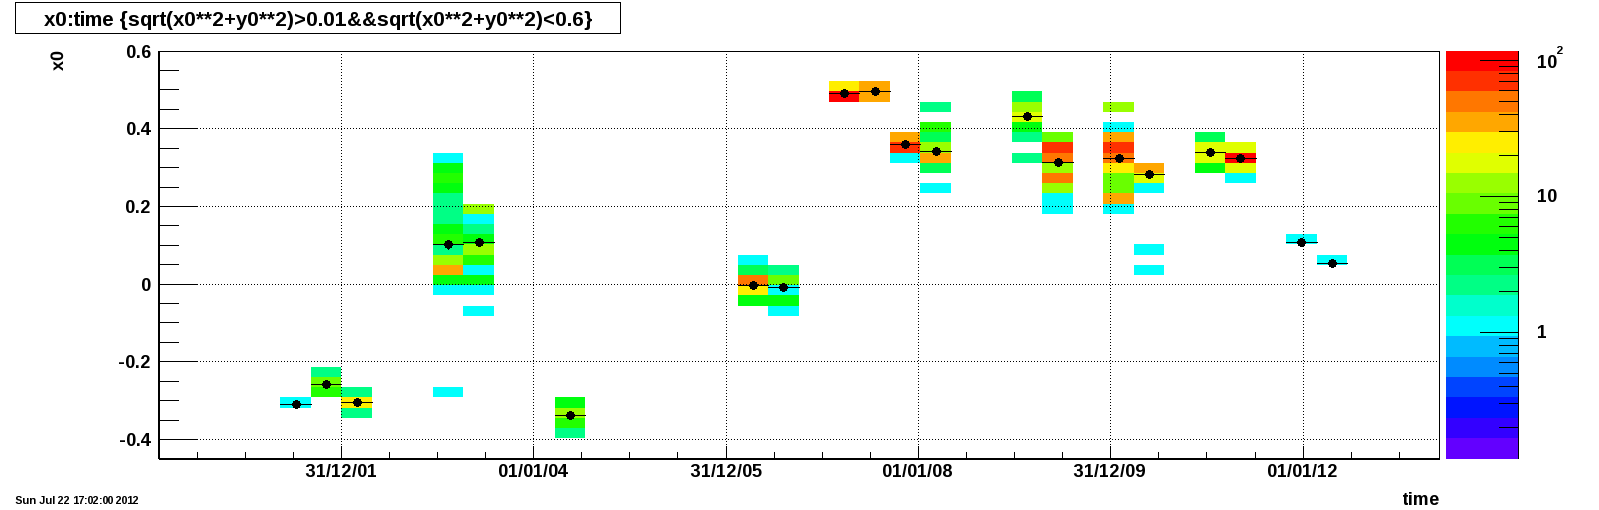
- time dependence of all these parameters.
I took all data base entries in vertexSeed table, exclude bad ones and plot them.
- From correlations between x0 and dxdz I see 3 ragions: two of them with |x0 | > 0.2 cm corresponds to large dxdz (| dxdz| ~ 1e-3) and these regions can be connected by eye with straight line, and region with low |x0 | < 0.2 cm which has dxdz ~ -1e3. This third region looks strange.
- correlations between y0 and dydz looks ~ o.k. From this plots it follows that < dydz > ~ 0.2e-3. Does this mean that STAR East sags with respect to West by 0.2 mrad ?
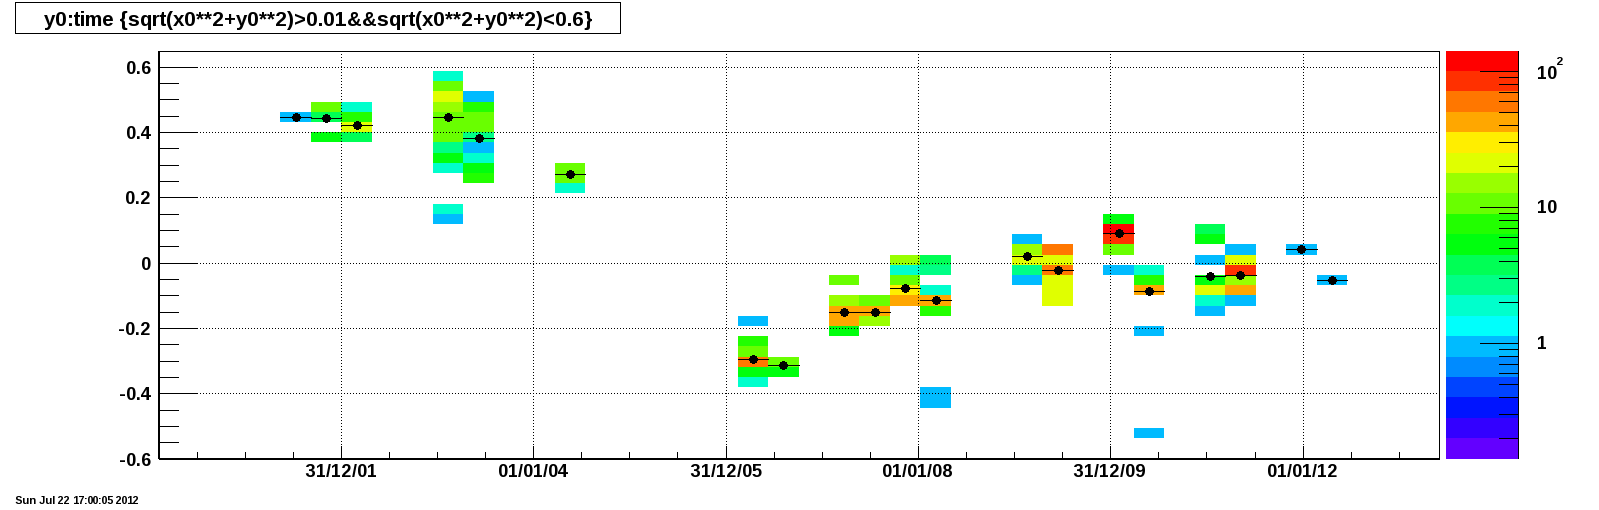
- Time dependence of x0 shows that the strange region (small x0 and large dxdz) is associated with y2003 and y2006 runs.
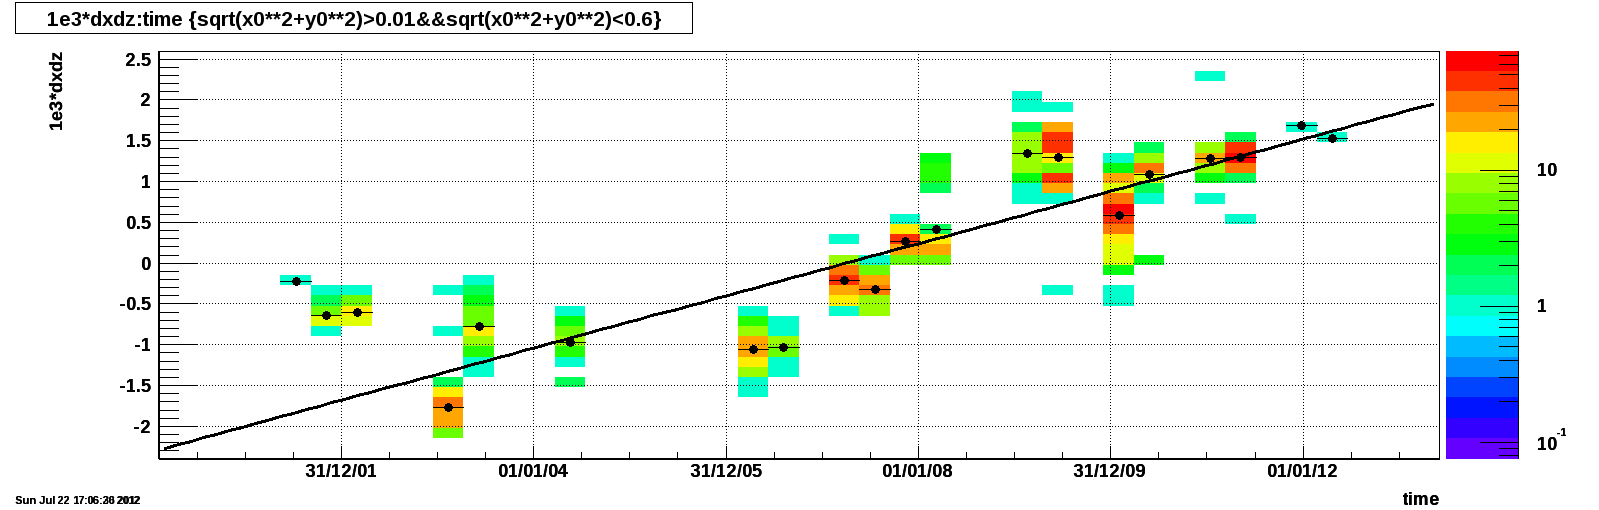
- dxdz time dependence (except y2001 and y2006) can be approximated dy staight line with slope (0.32 +/- 0.02) e-3/year. Does this imply that STAR beam is rotated around Y-axis by 0.3 mrad/year or that since y2008 till now we have stable regime with dxdz ~ 1.3e-3 ?
- Time dependence of y0 shows that after y2008 it reaches a saturation.
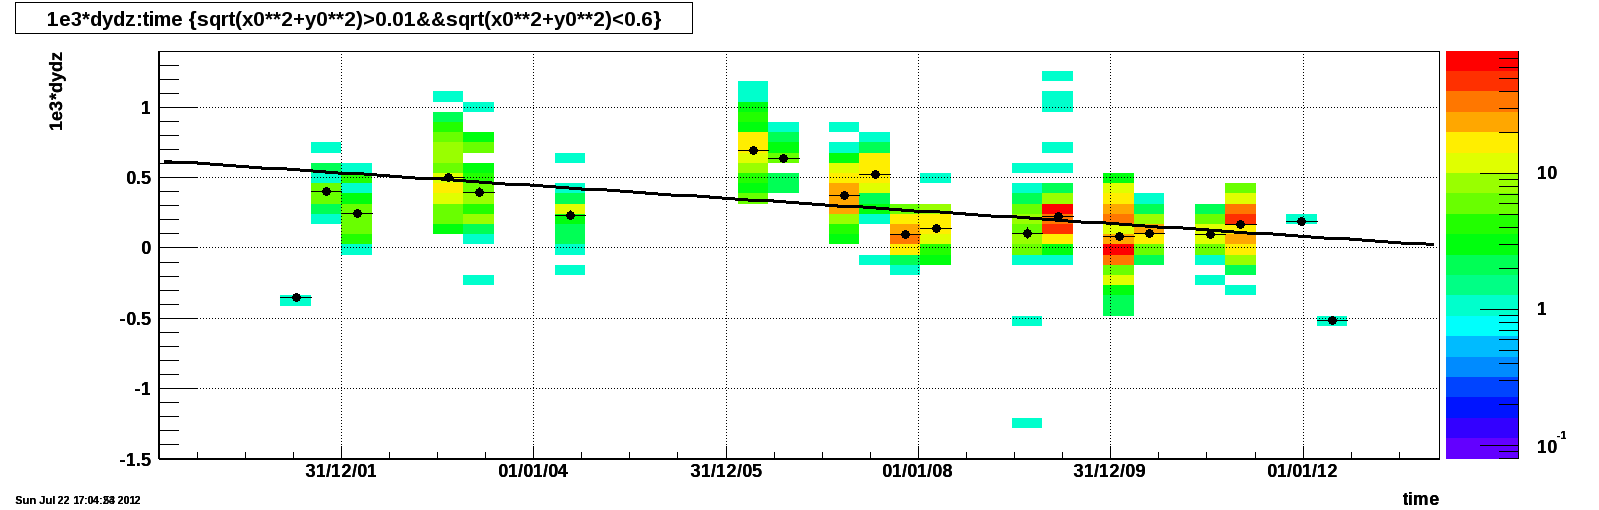
- dydz time dependence also can be approximated dy staight line with slope (-0.045 +/- 0.006) e-3/year. Does this imply that STAR or beam is rotated around X-axis by 0.045 mrad/year ? From other side dydz dependence can be approximated by constant (0.19e-3) for region y2007-y2012, except the last point.
I would conclude that there some patterns in beam position. It would be interesting to understand the reasons for these patterns. Because X direction is RHIC bending direction it could come from CAD beam tuning. The shift (~0.2 mrad) of beam in Y direction (non bending) could be related to STAR position with respect to RHIC.
Groups:
- fisyak's blog
- Login or register to post comments