- fisyak's home page
- Posts
- 2025
- 2024
- December (2)
- November (1)
- October (4)
- September (3)
- August (6)
- July (3)
- June (3)
- March (1)
- February (4)
- January (2)
- 2023
- December (2)
- November (1)
- October (2)
- September (3)
- August (3)
- July (2)
- June (4)
- April (2)
- March (2)
- February (1)
- January (2)
- 2022
- 2021
- December (2)
- October (2)
- September (1)
- August (2)
- June (3)
- May (1)
- April (2)
- March (3)
- February (5)
- January (4)
- 2020
- 2019
- 2018
- 2017
- December (3)
- October (2)
- September (1)
- August (7)
- July (3)
- May (2)
- April (1)
- February (1)
- January (2)
- 2016
- 2015
- November (1)
- October (2)
- September (4)
- August (1)
- July (1)
- June (2)
- May (4)
- April (1)
- March (1)
- February (3)
- January (1)
- 2014
- 2013
- 2012
- 2011
- 2010
- My blog
- Post new blog entry
- All blogs
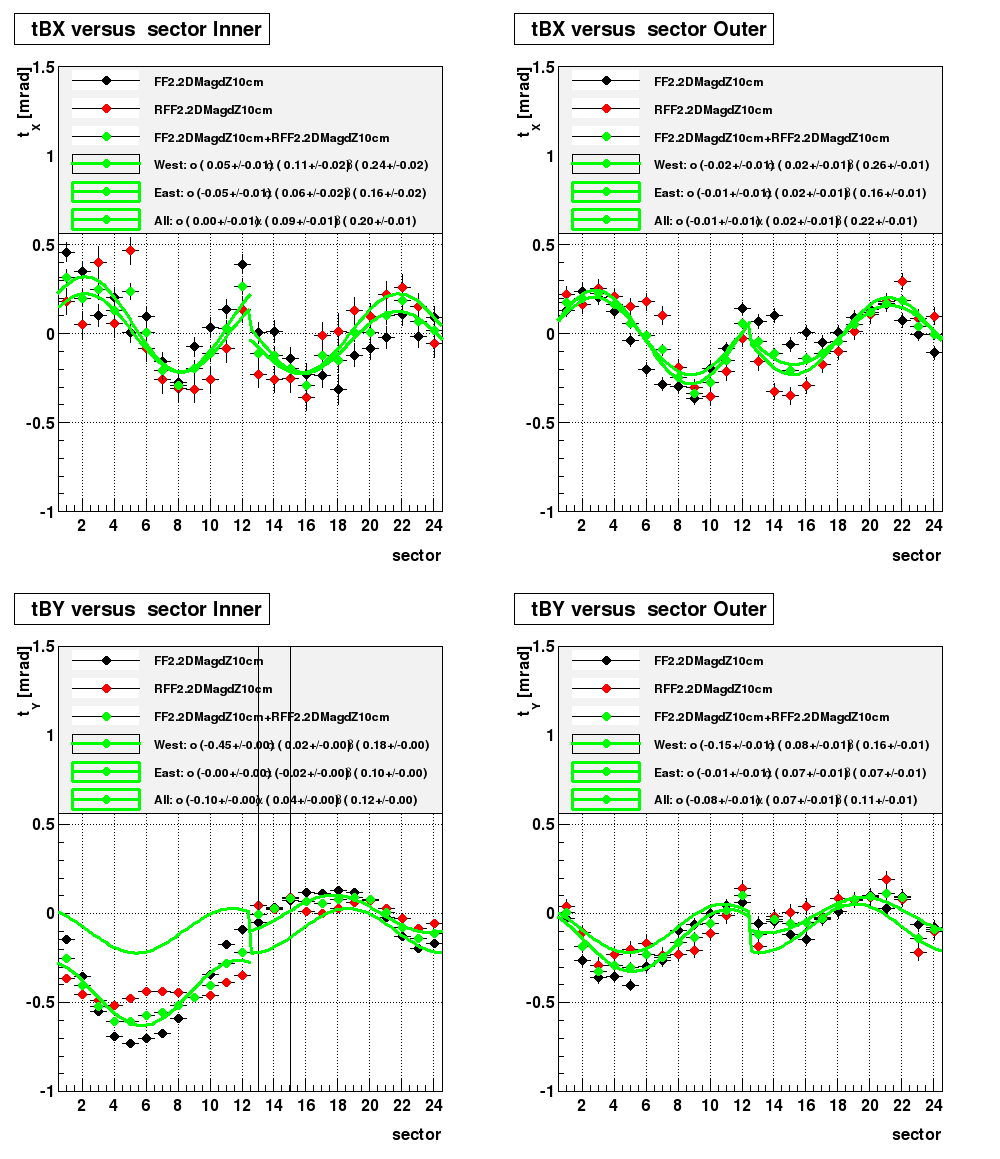
Measurement of STAR magnetic field direction
This measurement is continuation of work started by Grigory Nigmatkulov last August
(see his presentation on TPC meeting https://drupal.star.bnl.gov/STAR/blog/gnigmat/2013/aug/22/measurement-magnetic-field).
(see his presentation on TPC meeting https://drupal.star.bnl.gov/STAR/blog/gnigmat/2013/aug/22/measurement-magnetic-field).
This measurement based on reconstruction low energy electron (~10 MeV, R < 5 cm) helix directions
(tX in rho*phi direction, and tY in rho direction) in local TPC system coordinate system.
We expect that the direction has two components :
1. The first one is coming from mag. field (B) itself
BX = <Bx/Bz> (rho * phi) and BY = <By/Bz> (in rho direction), and
2. The second one is coming from ExB distortions (v is drift velocity
vX = <vx>/<vz> and vY = <vy>/<vz>
The average made over Inner ( 60 cm <= Radius < 120 cm) and Outer (Radius > 120 cm) TPC sectors.
In this analysis we applied all known distortion corrections that vX and vY are assumed to be zero.
On plot below it is drawn difference measured helix axis direction and local magnetic field (in mrad)
tBX = tX - BX and tBY = tY - BY versus sector number (sector <= 12 is West part of TPC, and sector > 12 is East one).
The legend is the following:
1. Black bullet is Full Field data (FF)
2. Red -"- is Reverse Full Field data (RFF)
3. Green is half sum of Full Field and Reverse Full Field.
The upper row is for tBX (rho*phi direction),
the low row for tBY (rho direction)
The left column for Inner sectors and right one for Outer sectors.
Below I put 3 links to plots obtained with different mag. fields. I remind that the mag. field is a part of ExB distortion corrections.
The plots:
1. Our standard mag. field
I see a shift between FF and RFF in tBX in the West part of TPC.
Sinusoidal shape with amplitude ~0.1 mrad reflect some extra rotation of TPC with respect to Magnet coordinate system.
The main point from this plot is that Inner West sectors have off set ~ -0.5 mrad in tBY (rho, left bottom figure with sector <= 12)
2. Adding Wuzheng correction to mag. field with extra PMT box thickness 5 cm
FF and RFF points are much closer to each other. Very small modification for Inner West tBY.
3. Adding Wuzheng correction to mag. field with extra PMT box thickness 10 cm
FF and RFF points are slightly overcorrected. Very small modification for Inner West tBY.
The conclusions from this study:
1. The best correction due to PMT boxes is for their effective thickness ~7.5 cm
2. I still have no clue why in tBY for West Inner sector I have offset ~ -0.5 mrad.
The way to go is to check drawings and material specifications,
try to build a "realistic" model for Endcap calorimeter and calculate corrections
to STAR magnetic field.
Groups:
- fisyak's blog
- Login or register to post comments


