- genevb's home page
- Posts
- 2025
- 2024
- 2023
- 2022
- September (1)
- 2021
- 2020
- 2019
- December (1)
- October (4)
- September (2)
- August (6)
- July (1)
- June (2)
- May (4)
- April (2)
- March (3)
- February (3)
- 2018
- 2017
- December (1)
- October (3)
- September (1)
- August (1)
- July (2)
- June (2)
- April (2)
- March (2)
- February (1)
- 2016
- November (2)
- September (1)
- August (2)
- July (1)
- June (2)
- May (2)
- April (1)
- March (5)
- February (2)
- January (1)
- 2015
- December (1)
- October (1)
- September (2)
- June (1)
- May (2)
- April (2)
- March (3)
- February (1)
- January (3)
- 2014
- December (2)
- October (2)
- September (2)
- August (3)
- July (2)
- June (2)
- May (2)
- April (9)
- March (2)
- February (2)
- January (1)
- 2013
- December (5)
- October (3)
- September (3)
- August (1)
- July (1)
- May (4)
- April (4)
- March (7)
- February (1)
- January (2)
- 2012
- December (2)
- November (6)
- October (2)
- September (3)
- August (7)
- July (2)
- June (1)
- May (3)
- April (1)
- March (2)
- February (1)
- 2011
- November (1)
- October (1)
- September (4)
- August (2)
- July (4)
- June (3)
- May (4)
- April (9)
- March (5)
- February (6)
- January (3)
- 2010
- December (3)
- November (6)
- October (3)
- September (1)
- August (5)
- July (1)
- June (4)
- May (1)
- April (2)
- March (2)
- February (4)
- January (2)
- 2009
- November (1)
- October (2)
- September (6)
- August (4)
- July (4)
- June (3)
- May (5)
- April (5)
- March (3)
- February (1)
- 2008
- 2005
- October (1)
- My blog
- Post new blog entry
- All blogs
Assessing current Run 9 TPC calibrations
Reviewing where we are with the current state of calibration, I have posted to hypernews fora both the enumeration of tasks on which work is needed, and estimates of the accuracy of calibrations as they stand.
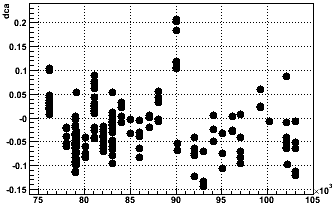
To get a real measure of that accuracy in the pp500 data, a quick look at the distribution of mean signed DCA (<sDCA> of ~1500 good global tracks from a given DAQ file) from a number of runs gives some understanding. This is such a plot using Joe Seele's new non-linear SpaceCharge correction from ~100 pp500 runs (left), and the same data vs. day number (right):


Note that each number represents the mean of a distribution of sDCAs from these global tracks as well, and the spread of those distributions has more to do with the intrinsic pointing resolution of the TPC as the (mis)calibrations are systematically similar within any such grouping of 1500 tracks, combined with the current inaccuracy of the vertex-finding (these can add up to several millimeters). Each <sDCA> point has a measurement error on the order of 100-200 microns ("error on the mean"). The distribution of <sDCA> values represents systematic issues which may vary run to run.
We are shooting for the <sDCA> to be "better than 2 mm". What we see is that this distribution lies as desired within about +/- 2 mm, and more generally has an RMS of about 600 microns with a mean of about -200 microns. Assuming a gaussian distribution with these parameters (an overly bold assumption, but it should be reasonable to first order given the above plot), 99.8% of the data lies within +/- 2 mm, while 88.6% lie within +/- 1 mm. I think it is appropriate to say that the 2 mm goal has been reached.
The data shown vs. day number reveals that specific groups of data may be systematically worse. In particular, runs 10090040, 042, and 047 (from fill 10464) appear to be notable outliers.
-Gene
- genevb's blog
- Login or register to post comments
