Sti accounting dead TPC regions
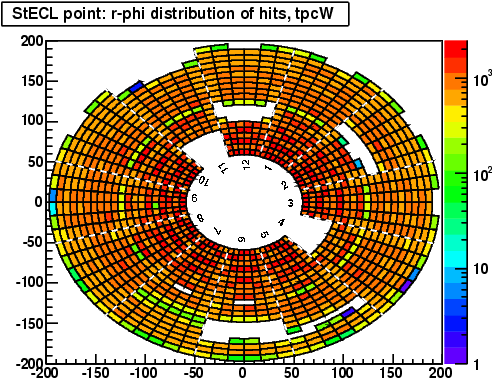
As discussed in RT ticket 2030, Sti has apparently not properly taken into account dead TPC regions. Victor proposed a change for the code on Nov. 5, 2010, and I gave it a brief test on some data where there were particularly a lot of dead TPC regions: the end of Run 9 (see Finding dead TPC regions). Here are images of the dead regions in the east and west TPC:


That this is the time at which we took pp2pp data is all the better: this data was collected at very low luminosity when there wasn't much pile-up. This is a consideration in particular because Victor's proposed code change associate hits with east vs. west dead regions based on reconstructed z sign, and not the actual sector in which it was recorded. This means it does not properly handle some pile-up hits: "post-membrane hits", where the hits for a given sector are reconstructed to be from beyond the full drift, and therefore have the opposite reconstructed z sign than they should. So this data should not suffer significant artifacts from this aspect.
I ran the following chain in DEV on Nov. 8, 2010 without (old) and with (new) Victor's proposed fix, and then looked at our standard set of Offline QA histograms:
root4star -b -q -l 'bfc.C(15000,"pp2009c ITTF VFPPVnoCTB beamLine BEmcChkStat Corr4 -hitfilt",
  "/star/data03/daq/2009/184/10184030/st_physics_10184030_raw_8020002.daq")'
I found that in 15000 pp2pp events, the following numbers changed:
| old | new | |
| events with a primary vertex | 3608 | 3653 |
| total # of global tracks | 25656 | 25341 |
| total # of primary tracks | 11054 | 11056 |
| ratio Nfit/Nmax globals | 0.908 | 0.939 |
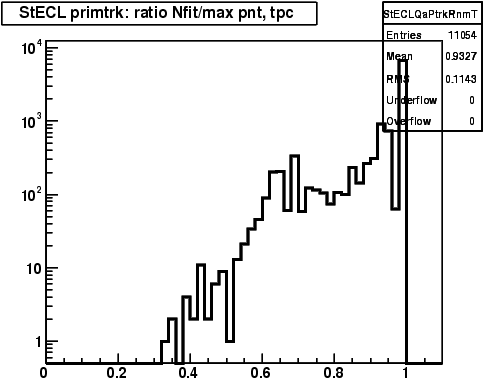
| ratio Nfit/Nmax primaries | 0.933 | 0.957 |
It doesn't appear that the total number of globals nor primaries changes by an appreciable amount, and it appears to be a case of not just new tracks appearing, but some disappearing as well. Plotting the phi of first hits on global tracks (below), I expected to see a significant change in sector 6 (west, phi ~= 270) where two consecutive RDOs were dead, but there seems to be little impact there. More impact is visible for sector 18 (east, phi ~= 270), which also had a significant amount of dead regions, but not a gap of more than 8 padrows (first and last RDO were dead, and middle anode section was down). Interestingly, sector 18 appears to have lost the few tracks that it had!
| old | new |
 |
 |
However, I think the other numbers may be of more interest: an increase of more than 1% in number of events with found primary vertices, and a significant improvement in the ratios of Nfit/Nmax of tracks. The latter two are best seen in the plots of these quantities, which clearly demonstrate a depletion of the low end of these distributions:
| old | new |
 |
 |
 |
 |
As I understand it, many analyses cut on this quantity. It appears to me that the number of tracks failing/passing cuts will change by an amount which is significant (perhaps a few percent). This set of histograms does not show this ratio versus sector (or phi), but I think it's reasonable to assume that the increase in this number is diluted by sectors where there are no dead regions, and the change is more than just a few percent in the most impacted sectors.
-Gene
- genevb's blog
- Login or register to post comments
