- genevb's home page
- Posts
- 2025
- 2024
- 2023
- 2022
- September (1)
- 2021
- 2020
- 2019
- December (1)
- October (4)
- September (2)
- August (6)
- July (1)
- June (2)
- May (4)
- April (2)
- March (3)
- February (3)
- 2018
- 2017
- December (1)
- October (3)
- September (1)
- August (1)
- July (2)
- June (2)
- April (2)
- March (2)
- February (1)
- 2016
- November (2)
- September (1)
- August (2)
- July (1)
- June (2)
- May (2)
- April (1)
- March (5)
- February (2)
- January (1)
- 2015
- December (1)
- October (1)
- September (2)
- June (1)
- May (2)
- April (2)
- March (3)
- February (1)
- January (3)
- 2014
- December (2)
- October (2)
- September (2)
- August (3)
- July (2)
- June (2)
- May (2)
- April (9)
- March (2)
- February (2)
- January (1)
- 2013
- December (5)
- October (3)
- September (3)
- August (1)
- July (1)
- May (4)
- April (4)
- March (7)
- February (1)
- January (2)
- 2012
- December (2)
- November (6)
- October (2)
- September (3)
- August (7)
- July (2)
- June (1)
- May (3)
- April (1)
- March (2)
- February (1)
- 2011
- November (1)
- October (1)
- September (4)
- August (2)
- July (4)
- June (3)
- May (4)
- April (9)
- March (5)
- February (6)
- January (3)
- 2010
- December (3)
- November (6)
- October (3)
- September (1)
- August (5)
- July (1)
- June (4)
- May (1)
- April (2)
- March (2)
- February (4)
- January (2)
- 2009
- November (1)
- October (2)
- September (6)
- August (4)
- July (4)
- June (3)
- May (5)
- April (5)
- March (3)
- February (1)
- 2008
- 2005
- October (1)
- My blog
- Post new blog entry
- All blogs
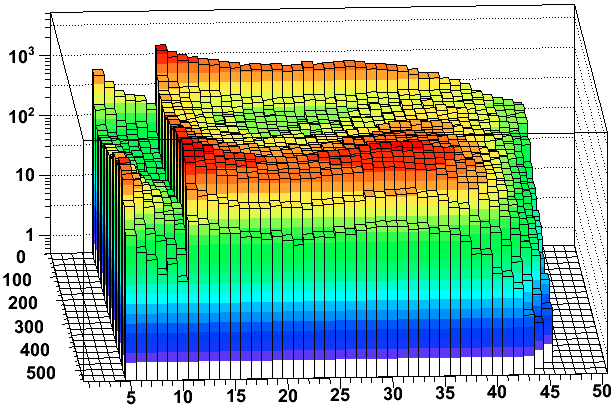
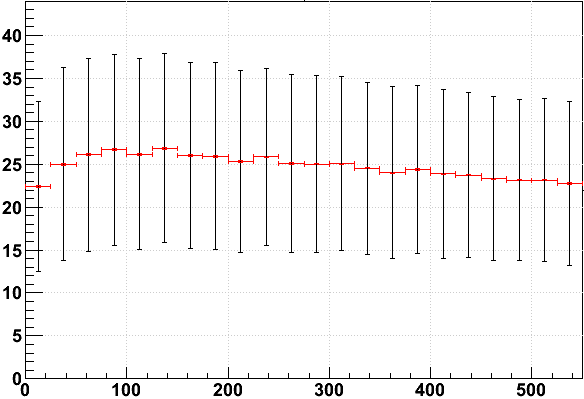
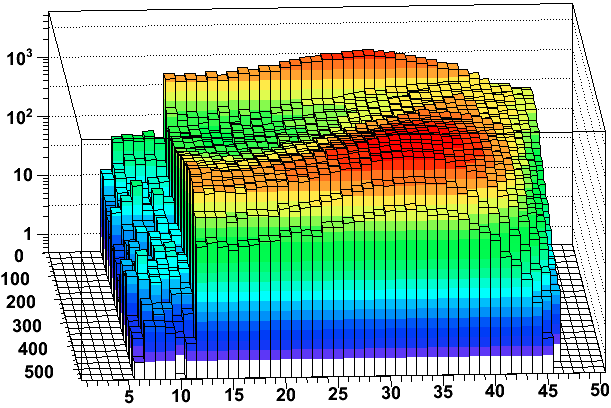
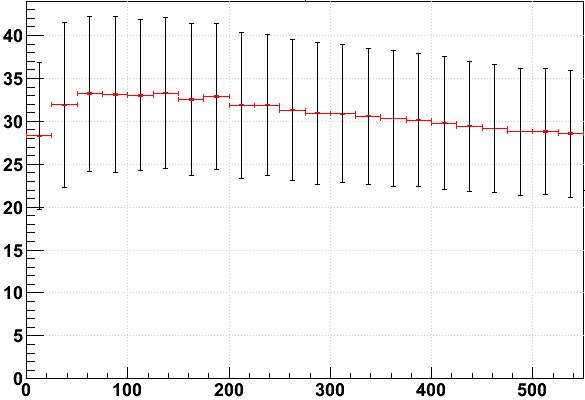
Nfit vs. refMult
Similar to my previous post, but vs. refMult instead of pT for AuAu200 SL10k data (again limiting to 0.4 < η < 0.6). The mean and RMS (black error bars) may not be a very good reduced representation of the Nfit distribution in each refMult bin, but it's interesting to note that there's a significant drop in the mean Nfit for refMult below 50. I tried cutting out tracks with Nfit < 11 to see if there was any difference and there wasn't, so I didn't include the plots here.
Global tracks:
Primary tracks:
I tried fitting refMult slices for primary tracks instead of just taking the profiles. I used 3 methods:
#1 : Gaussian with different low and high side widths
#2 : Gaussian with different low and high side widths and a common offset
#3 : Gaussian with different low and high side widths and offsets
Fits span only the 12-46 hit region; primaries have 1 more hit than globals from the primary vertex. Offsets were constrained to be non-negartive. Here I plot the gaussian center in red, and the center + the low and high side widths in black for these three cases respectively:
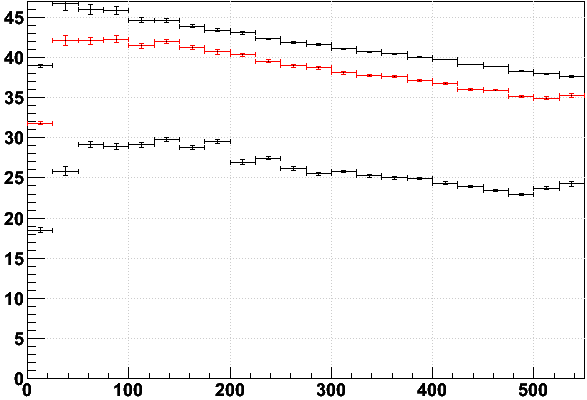
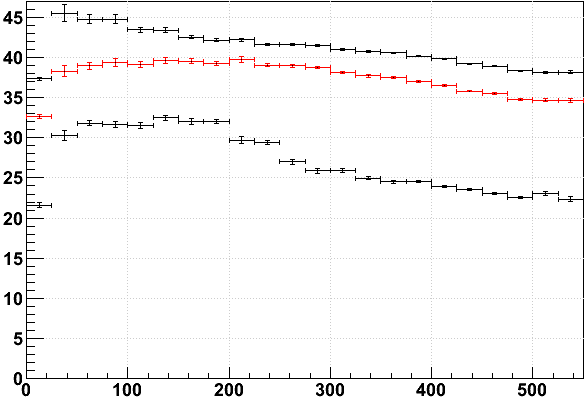
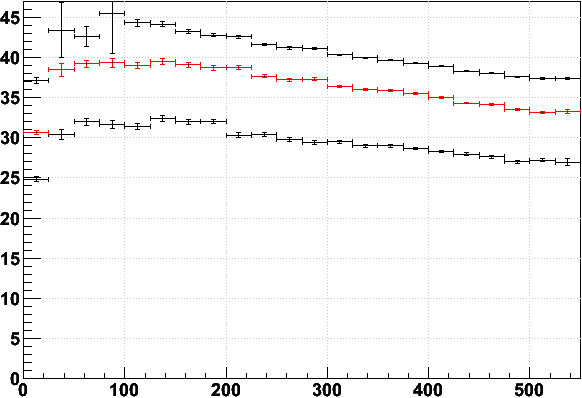
Observations:
a) The Gaussian centers are higher than the profile mean, though allowing offsets brings them down a small amount.
b) The Gaussian widths don't vary by much over the range, though there's some narrowing in the 100-250 refMult range for the common offset case.
c) The difference in the lowest refMult bin is even more pronounced than with the profile mean, though allowing offsets smooths this out.
Below are the offsets as a fraction of peak height for the different offsets fit #3, where the offsets were not constrained to be non-negative. Red is low side offset, blue is high side. With the non-negative constraint, the high side offset rides zero for all but the first 4 refMult bins, but when unconstrained it goes strongly negative for intermediate refMult, asymptotically approaching zero at high refMult:
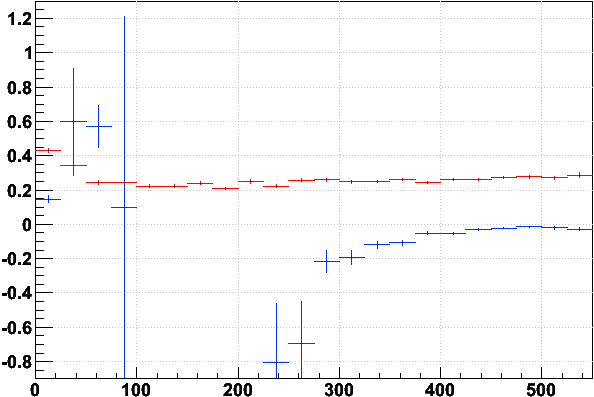
This last plot may be the most telling in terms of the variation of the Nfit distribution as a function of refMult from these fits. There's probably a better way to characterize the variation, but I figured I'd post what I observed.
-Gene
p.s. Perhaps TPC occupancy is the more relevant parameter of dependence. That would imply dependence on luminosity as well as triggered event multiplicity.
- genevb's blog
- Login or register to post comments
