- genevb's home page
- Posts
- 2025
- 2024
- 2023
- 2022
- September (1)
- 2021
- 2020
- 2019
- December (1)
- October (4)
- September (2)
- August (6)
- July (1)
- June (2)
- May (4)
- April (2)
- March (3)
- February (3)
- 2018
- 2017
- December (1)
- October (3)
- September (1)
- August (1)
- July (2)
- June (2)
- April (2)
- March (2)
- February (1)
- 2016
- November (2)
- September (1)
- August (2)
- July (1)
- June (2)
- May (2)
- April (1)
- March (5)
- February (2)
- January (1)
- 2015
- December (1)
- October (1)
- September (2)
- June (1)
- May (2)
- April (2)
- March (3)
- February (1)
- January (3)
- 2014
- December (2)
- October (2)
- September (2)
- August (3)
- July (2)
- June (2)
- May (2)
- April (9)
- March (2)
- February (2)
- January (1)
- 2013
- December (5)
- October (3)
- September (3)
- August (1)
- July (1)
- May (4)
- April (4)
- March (7)
- February (1)
- January (2)
- 2012
- December (2)
- November (6)
- October (2)
- September (3)
- August (7)
- July (2)
- June (1)
- May (3)
- April (1)
- March (2)
- February (1)
- 2011
- November (1)
- October (1)
- September (4)
- August (2)
- July (4)
- June (3)
- May (4)
- April (9)
- March (5)
- February (6)
- January (3)
- 2010
- December (3)
- November (6)
- October (3)
- September (1)
- August (5)
- July (1)
- June (4)
- May (1)
- April (2)
- March (2)
- February (4)
- January (2)
- 2009
- November (1)
- October (2)
- September (6)
- August (4)
- July (4)
- June (3)
- May (5)
- April (5)
- March (3)
- February (1)
- 2008
- 2005
- October (1)
- My blog
- Post new blog entry
- All blogs
BeamLine for pp500 from HLT
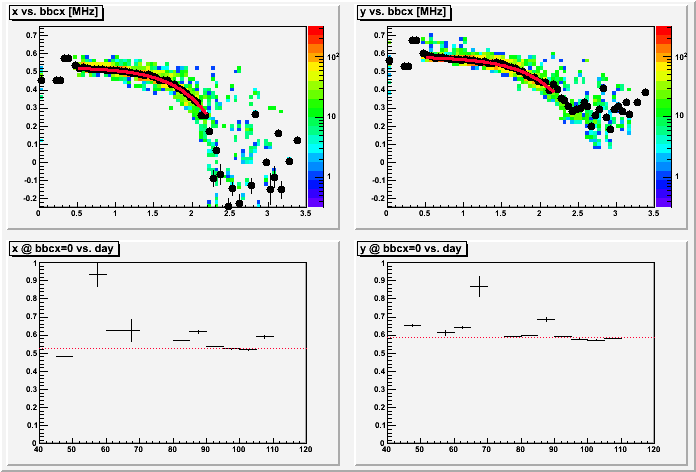
The HLT group recorded BeamLine data during Run 11 pp500, which showed clear luminosity dependence. I took the data, correlated run numbers with the mean BBC coincidence rates for those runs ("bbcx"), and fit the dependence to a phenomenological choice of a constant minus an exponential. The constant gives the prediction for a zero luminosity BeamLine calibration.
I restricted the fits to 0.5 < bbcx [MHz] < 2.2 (shown as the red curve fit to the black profile points in the top plots), and excluded data from before day 47. Integrated over all days, the results are:
x = 0.526 ± 0.001 cm
y = 0.585 ± 0.001 cm
The variation of the fit shown in 5 day granularity is in the bottom plots (with the integrated result drawn as a red dashed line). There is some weak evidence that the beam y position dropped over time, but I will upload just the integrated values into the DB.
A goal of this effort was to resolve the apparent offset in BeamLine position observed in a separate study of mine, which showed a sine wave in signed DCAs who amplitude was a few millimeters. Here are the BeamLine parameters which have been in the database since 2011-02-22 (determined also from rather steady HLT results at that time):
x = 0.53 ± 0.01 cm
y = 0.58 ± 0.01 cm
The difference between my new results and the old results is completely with errors and unfortunately does nothing to help resolve the observed sine wave in signed DCAs (though it does give confidence in the results, and also implies further that the BeamLine has in fact been rather steady). One possibility may be a slightly different coordinate system between HLT-found vertices and that used in offline reconstruction?
-Gene

- genevb's blog
- Login or register to post comments
