- genevb's home page
- Posts
- 2025
- 2024
- 2023
- 2022
- September (1)
- 2021
- 2020
- 2019
- December (1)
- October (4)
- September (2)
- August (6)
- July (1)
- June (2)
- May (4)
- April (2)
- March (3)
- February (3)
- 2018
- 2017
- December (1)
- October (3)
- September (1)
- August (1)
- July (2)
- June (2)
- April (2)
- March (2)
- February (1)
- 2016
- November (2)
- September (1)
- August (2)
- July (1)
- June (2)
- May (2)
- April (1)
- March (5)
- February (2)
- January (1)
- 2015
- December (1)
- October (1)
- September (2)
- June (1)
- May (2)
- April (2)
- March (3)
- February (1)
- January (3)
- 2014
- December (2)
- October (2)
- September (2)
- August (3)
- July (2)
- June (2)
- May (2)
- April (9)
- March (2)
- February (2)
- January (1)
- 2013
- December (5)
- October (3)
- September (3)
- August (1)
- July (1)
- May (4)
- April (4)
- March (7)
- February (1)
- January (2)
- 2012
- December (2)
- November (6)
- October (2)
- September (3)
- August (7)
- July (2)
- June (1)
- May (3)
- April (1)
- March (2)
- February (1)
- 2011
- November (1)
- October (1)
- September (4)
- August (2)
- July (4)
- June (3)
- May (4)
- April (9)
- March (5)
- February (6)
- January (3)
- 2010
- December (3)
- November (6)
- October (3)
- September (1)
- August (5)
- July (1)
- June (4)
- May (1)
- April (2)
- March (2)
- February (4)
- January (2)
- 2009
- November (1)
- October (2)
- September (6)
- August (4)
- July (4)
- June (3)
- May (5)
- April (5)
- March (3)
- February (1)
- 2008
- 2005
- October (1)
- My blog
- Post new blog entry
- All blogs
Run 12 pp510 Beamline 3D vs. 2x2D
Both 3D and 2x2D methods of calibrating the BeamLine in Run 12 pp510 data have been performed using the SpaceCharge & GridLeak calibrations which were placed in the DB on 2012-06-13. The 3D calibration was done with enough statistics to calibrate values as a function of time in fill, and showed an intra-fill time dependence. Looking at the 2x2D method in the Run 12 UU193 preview production showed a luminosity dependence.
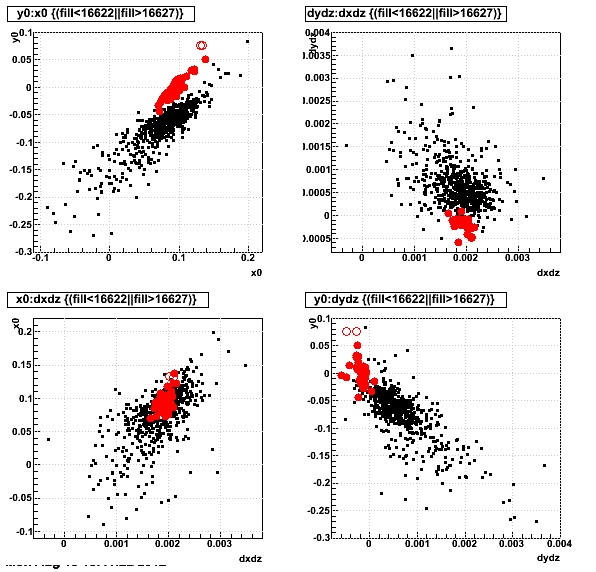
Here, I compare the results of the 688 jobs run for the 3D calibration (black, small circles) with the 49 aggregated fill-by-fill results of the 2x2D calibration (red, large circles, using 49.6M total vertices). In three sets of plots are:
- x0,y0,dx/dz,dy/dz vs. fill number
- the same vs. ZDC rate
- correlations between each other
Note that two outlying fill calibration results were discarded, and are shown as hollow red circles. ZDC rates were determined for the 2x2D method by determining the average ZDC coincidence rate for each run, then taking the weighted average of the run-wise values within each fill, using the statistics of # vertices in each run included in the calibration as weights.
- x0,y0,dx/dz,dy/dz vs. fill number: y0 and dy/dz are notably different in the two calibrations

- the same vs. ZDC rate: both show dependences, with the 3D showing a turnover in each

- correlations between each other: clear correlations in the 3D method, with y0:x0 really the only prominent one in the 2x2D method

A lot of structure, and some missing understanding...
-Gene
- genevb's blog
- Login or register to post comments
