Stv vs. Sti with first look at Run 9 pp500 real data
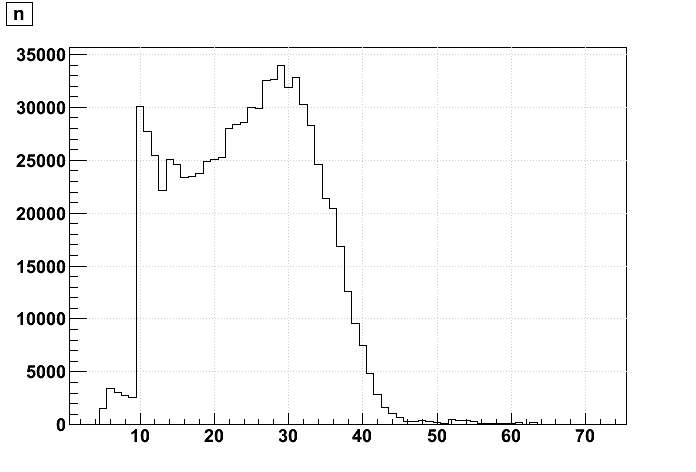
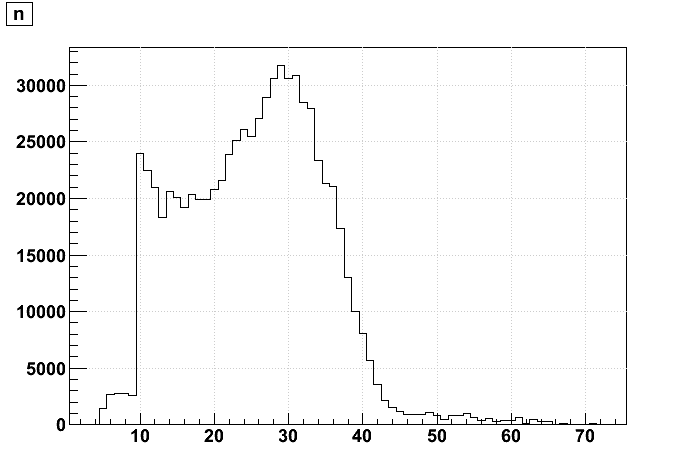
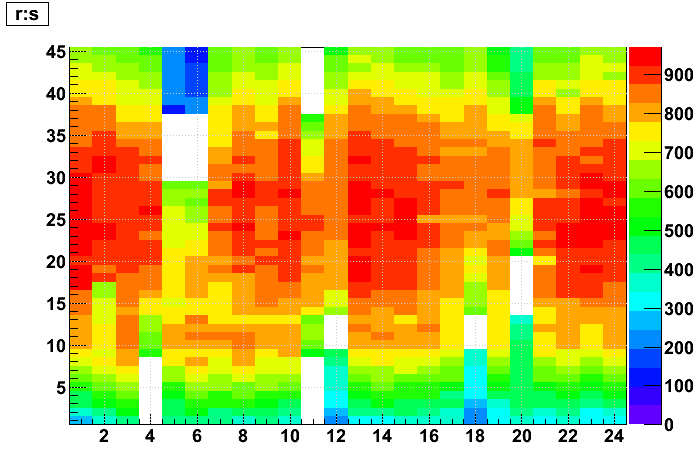
Looking at hits on global tracks in Run 9 pp500 real data events (exact same sample of 40 events for both Sti and Stv).
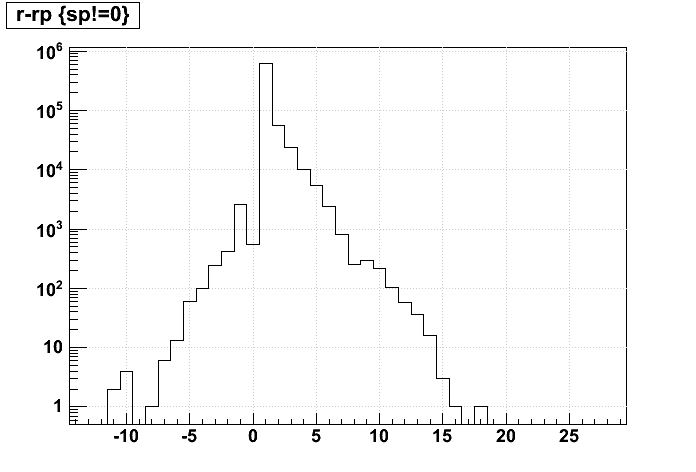
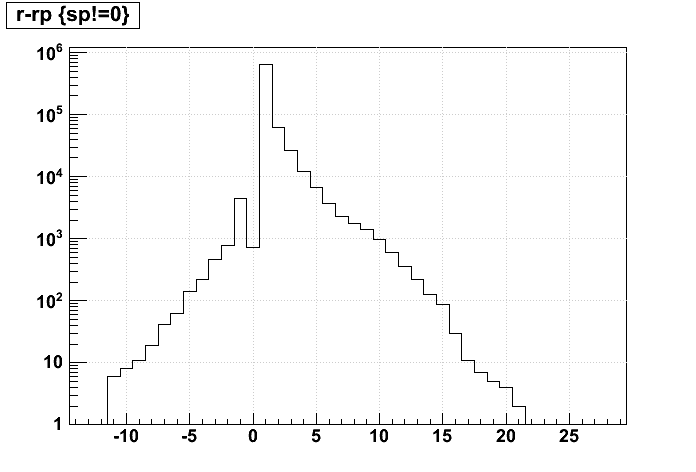
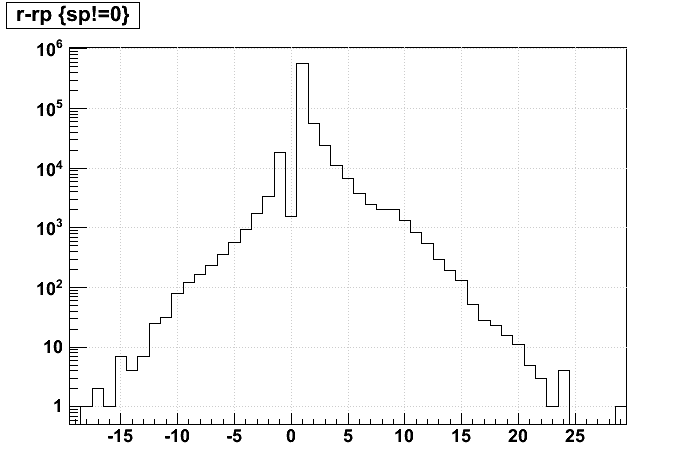
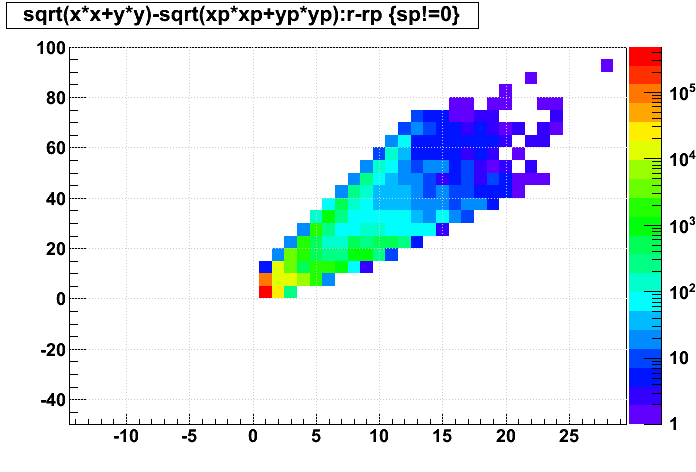
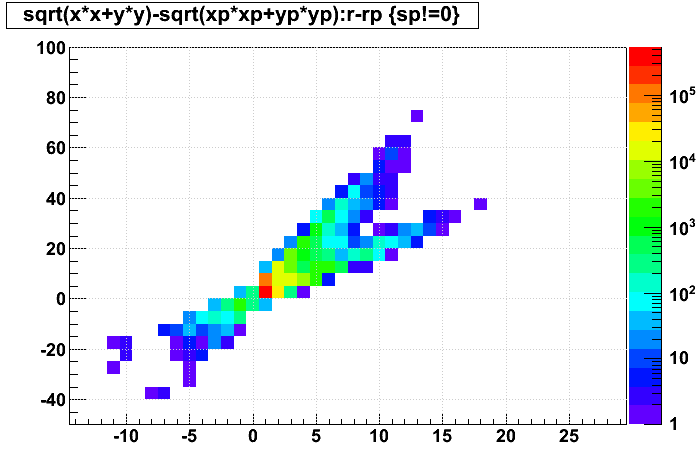
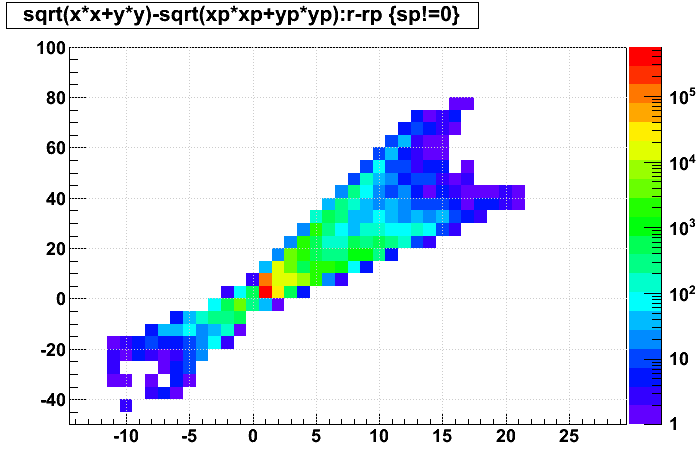
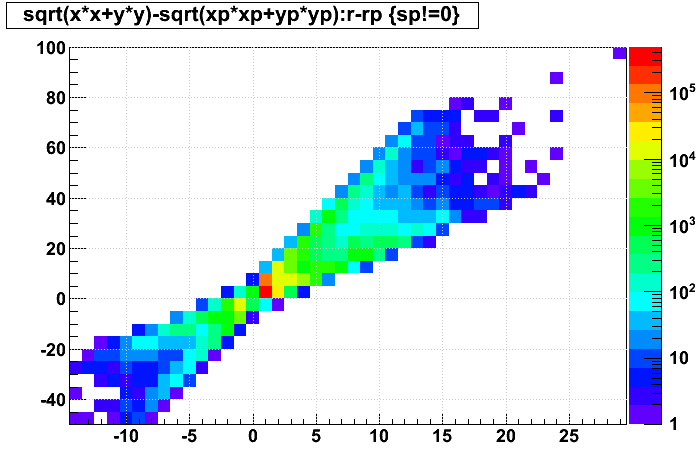
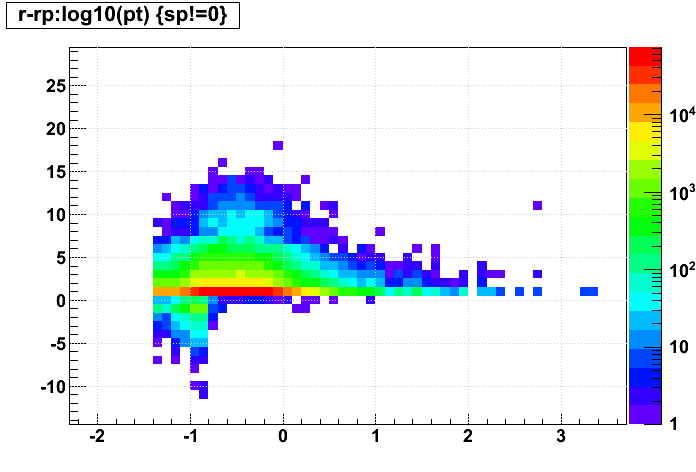
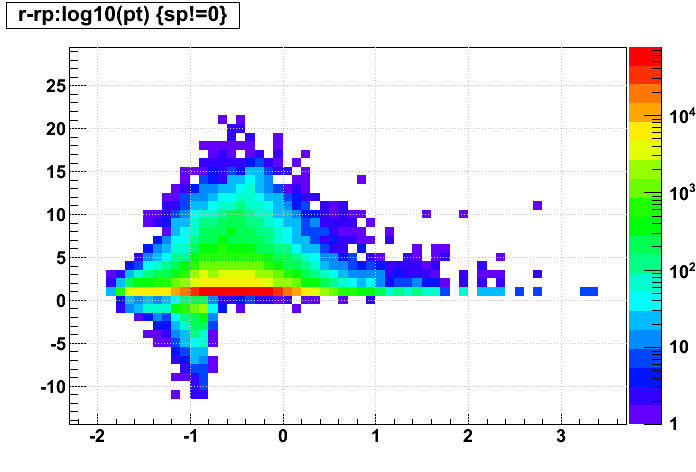
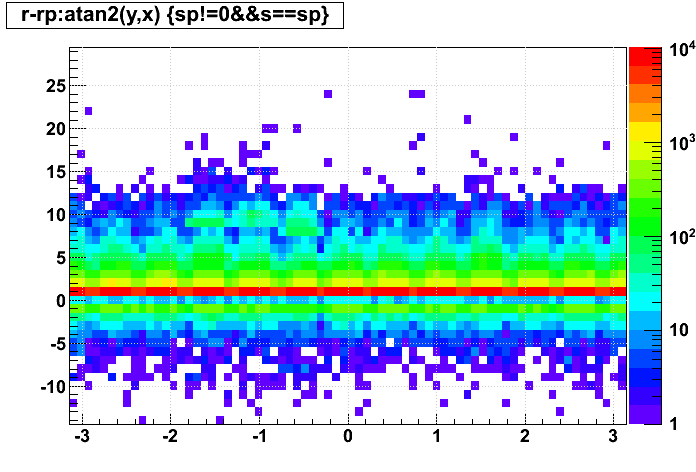
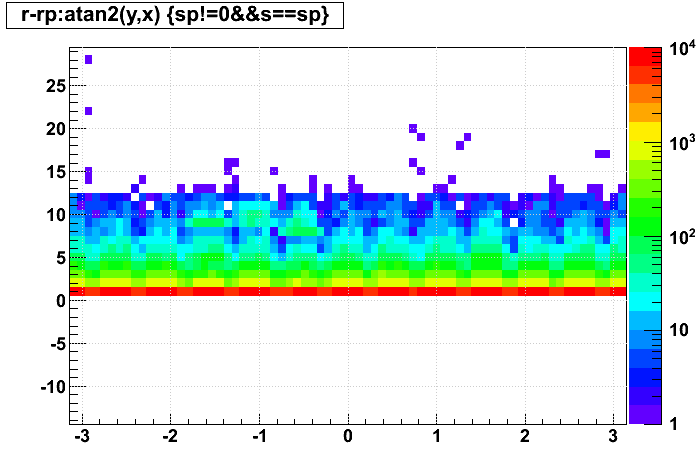
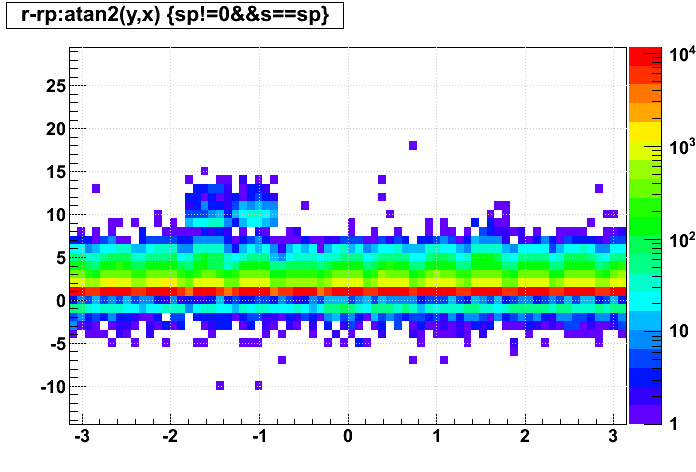
Δrow is defined as the difference in row number between any hit and the previous hit on the track (the hits are arranged such that the first hit is the innermost, which itself does not have a previous hit).
Observations:
NB: additional columns have been added for Stv as of Sep. 10th and Sep. 23rd with some items addressed.
__________________
Other (older) Stv datasets' zlast hit vs. zfirst hit:
__________________
New Stv datasets' zlast hit vs. zfirst hit:
__________________
Fraction of found hits placed on tracks:
Looking again at the same 40 events of real Run 9 pp500 data from the top of this blog page...
__________________
Sep. 7 patch for fraction of found hits placed on tracks:
First 20 events from st_W_10102066_raw_7170001:
__________________
Sep. 15 patch for fraction of found hits placed on tracks:
First 20 events from st_W_10102066_raw_7170001:
__________________
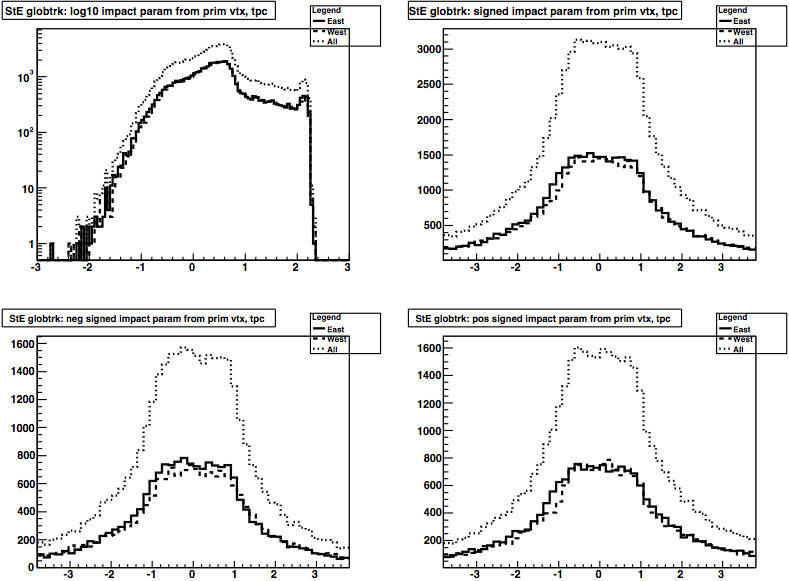
Signed DCAs (after the Sep. 15 patch):
All 1900 events from st_W_10102066_raw_7170001, all global tracks with flag>0 and with no wrong sign (post-membrane) hits (from the Offline QA histograms, using the DCA geometry's helix function geometricSignedDistance(xvtx,yvtx); units are [cm]):
NB: I had to skip the check on track topology map for having TPC hits, as Stv does not properly populate the topology map still.
________________
Sep 23 Stv update: Still a problem:
______________
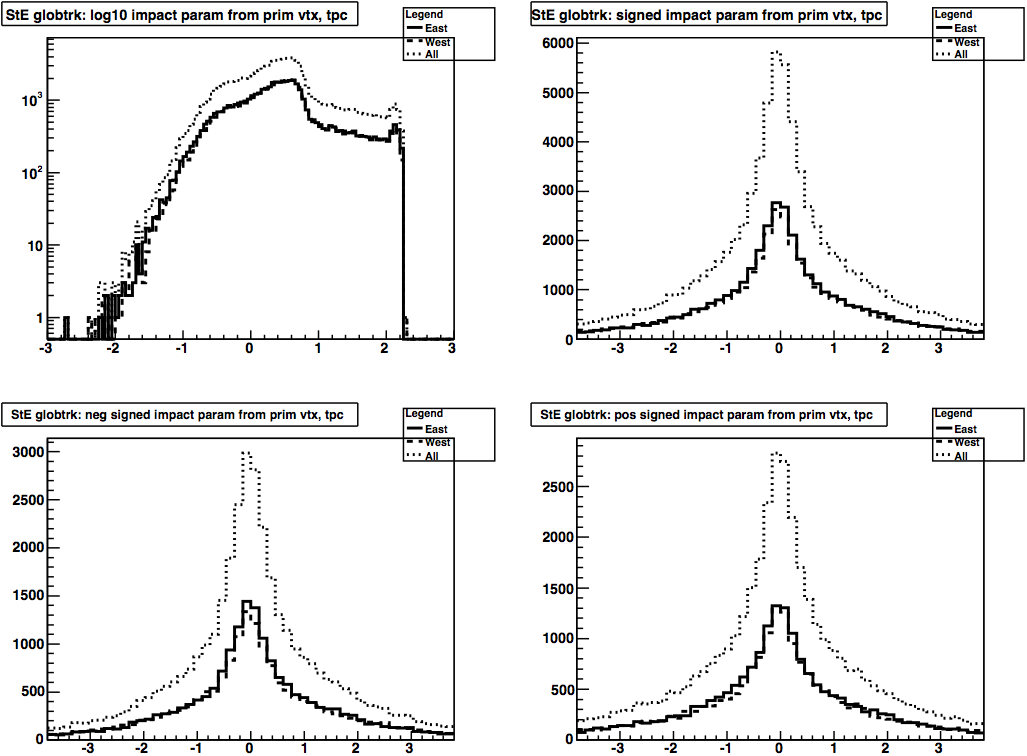
Oct. 1 Stv update: resolved! The problem was an inversion of (x,y) of the position of the DCA point in Stv to (-x,-y).
In addition to the Run 9 pp500 shown below, we re-ran the Run 10 AuAu200 ideal simulation and I re-produced the plot for it but did not include it here because it looks nearly identical to the above-shown plot of sDCA for AuAu200 from August 5th. A closer look makes it a little clearer that the plot has flipped left-to-right, which tells me that while the sign flip was present in the old simulation, the fact that the simulation threw vertices at (0,0) meant that a sign inversion in the in the DCA position did not lead to a smearing of the sDCA values.
Δrow is defined as the difference in row number between any hit and the previous hit on the track (the hits are arranged such that the first hit is the innermost, which itself does not have a previous hit).
Observations:
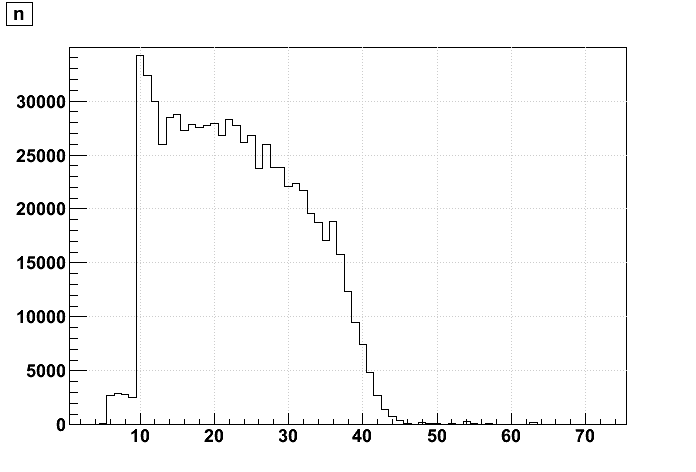
- Standard tracks have a 10 hit minimum in Stv, but 11 in Sti
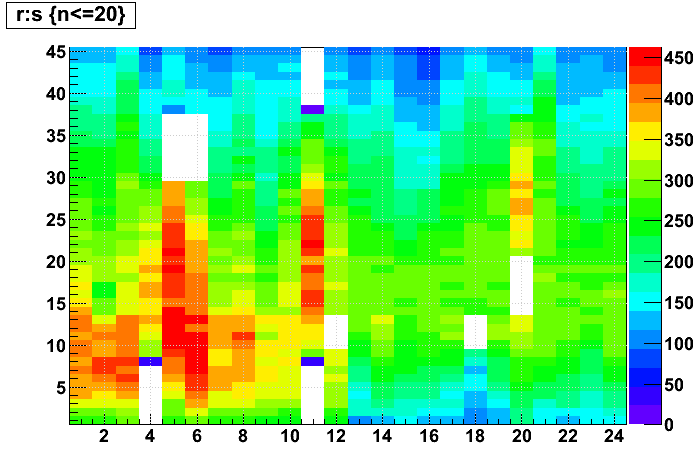
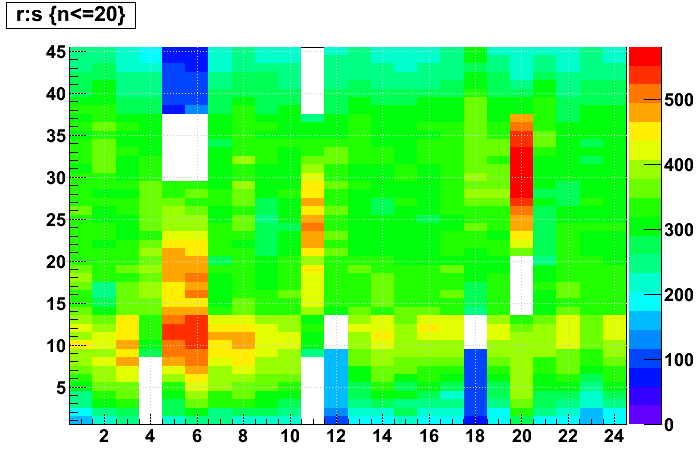
- Special short tracks have a 6 hit minimum in Stv, but 5 in Sti
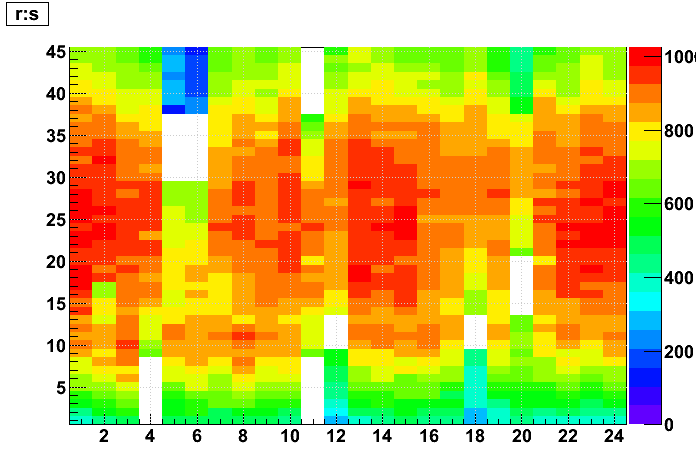
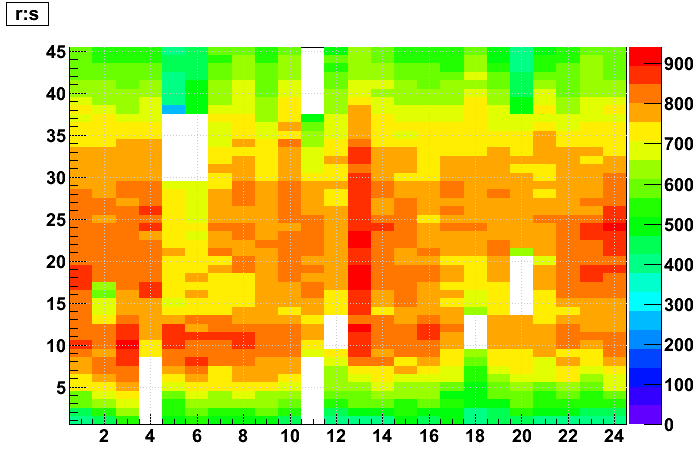
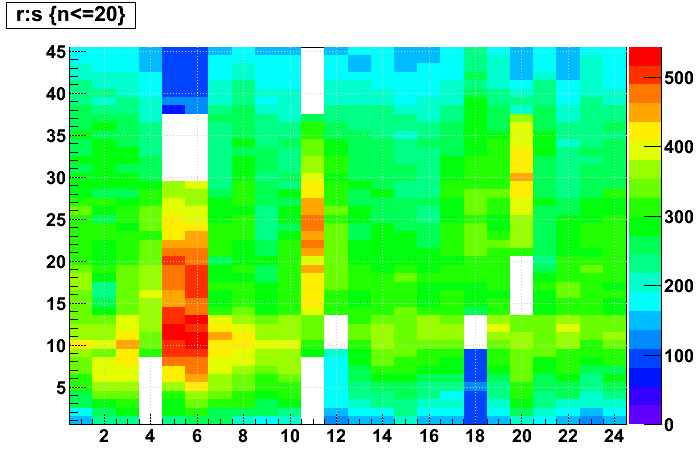
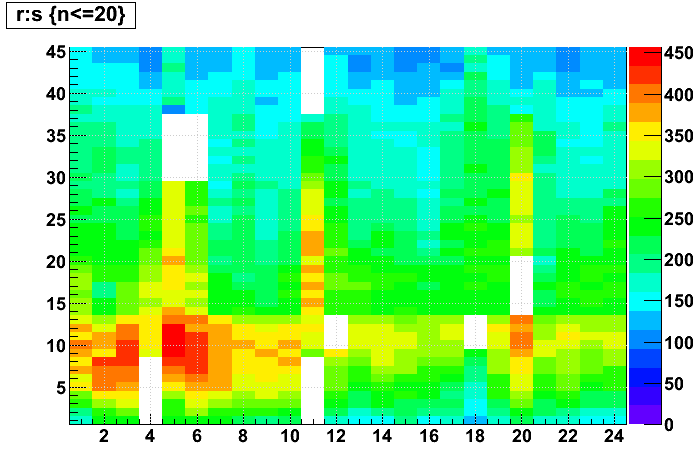
- Stv struggles to span dead regions more than does Sti (best demonstrated in sectors 5 and 6)
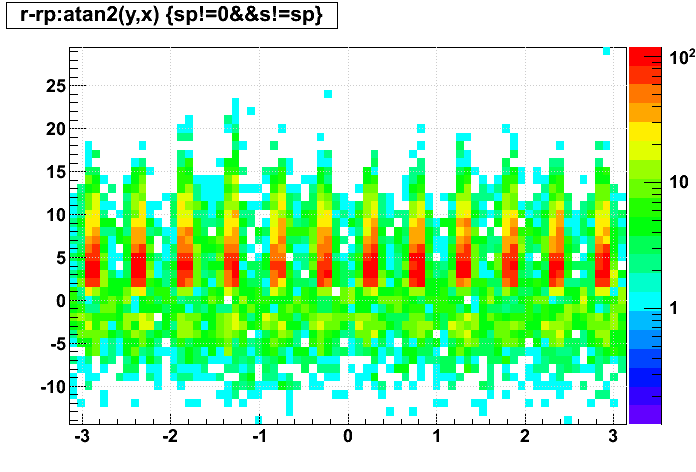
- Stv can have negative Δrow, which appears to occur on low pT loopers; this is not allowed in Sti
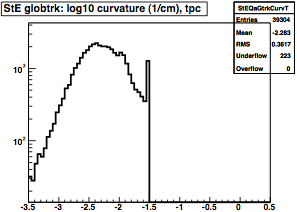
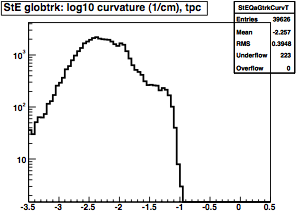
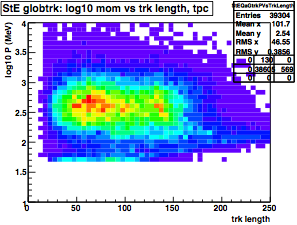
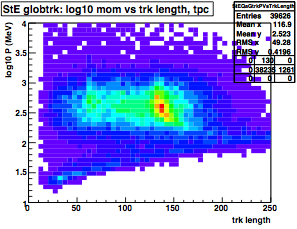
- Stv has a minimum pT of ~40-50 MeV/c, but Sti goes down to ~10 MeV/c
- This appears to be due to a maximum restriction on track curvature of 10-1.5 cm-1 in Stv
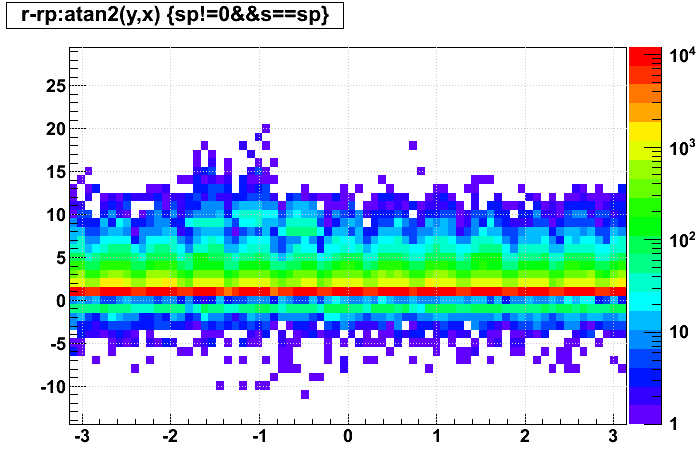
- For adjacent hits on tracks which are within the same sector, Stv generally limits Δrow to <~8 where there are no dead regions, and <~15 where there are dead regions; Sti limits to <~13 nearly everywhere
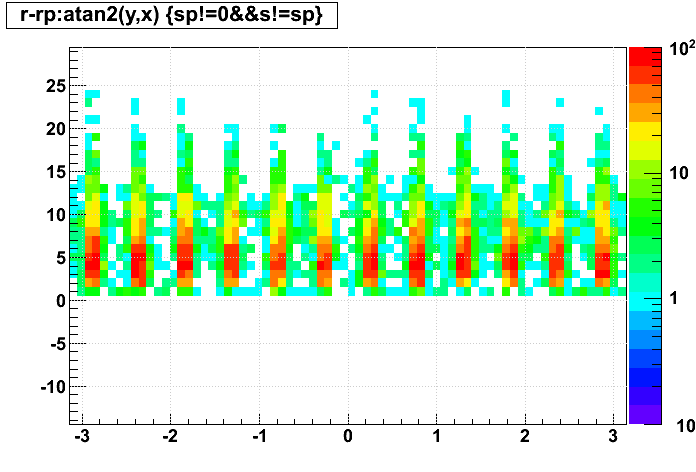
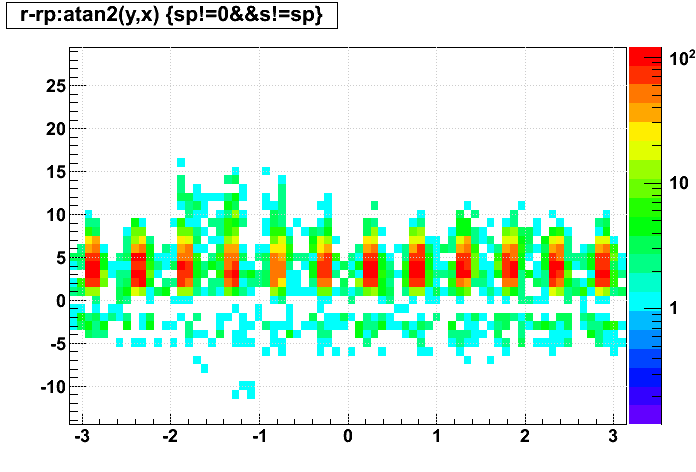
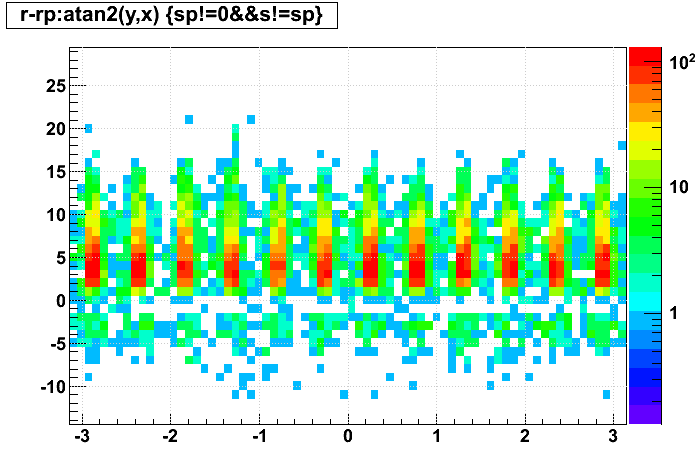
- For adjacent hits on tracks which are in different sectors (track crossed a sector boundary or the central membrane), Stv generally allows a slightly larger Δrow, but Sti allows a much larger Δrow, up to ~30
- Signed DCA distributions are not as well peaked in Stv as in Sti
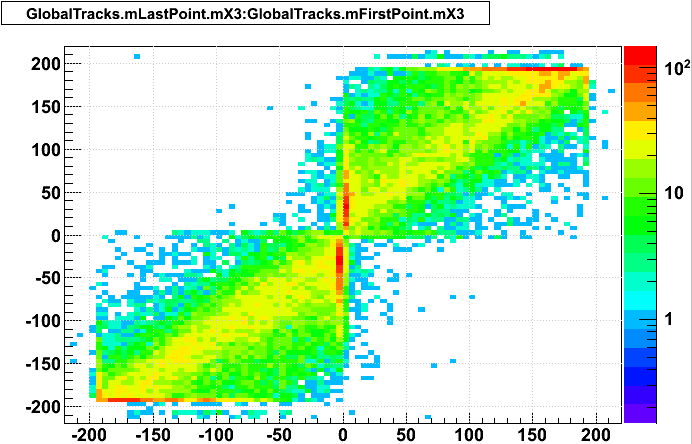
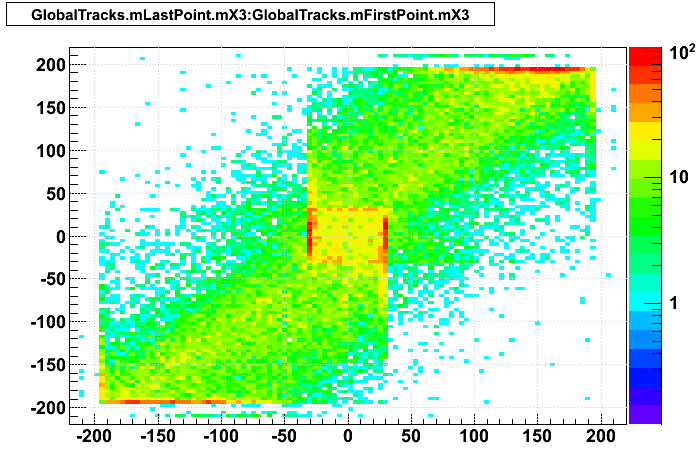
- Very few tracks appear to cross the central membrane in Stv (first and last hits are on the same side of the TPC), but it may only be a problem for pile-up tracks (i.e. not a problem for triggered event tracks)
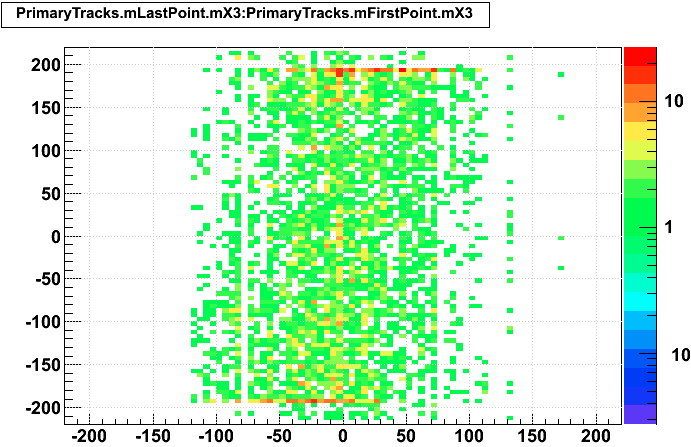
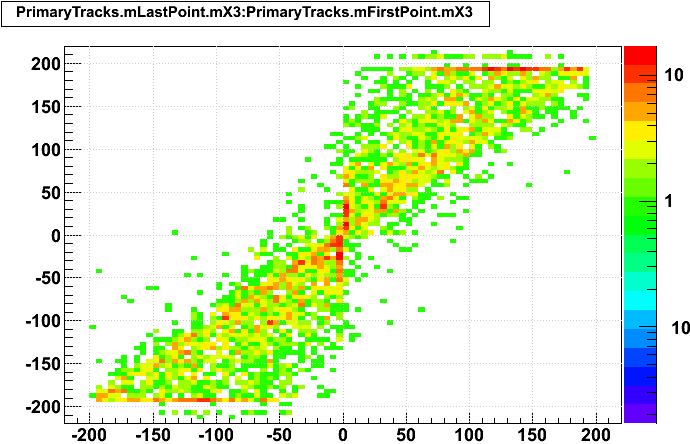
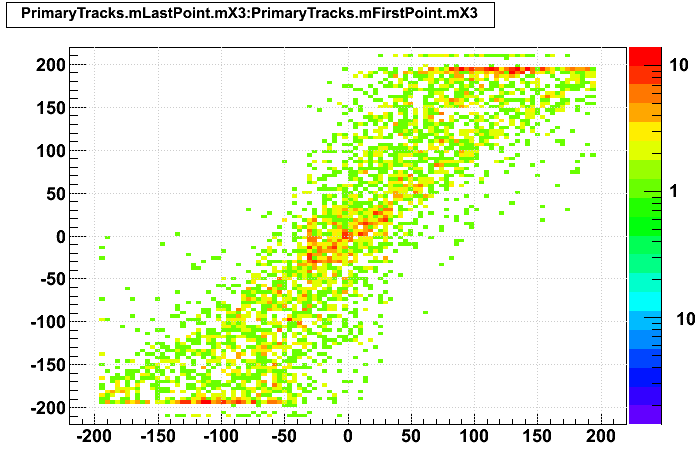
- Sti assigns the primary vertex to be the "first hit" on primary tracks, but Stv uses the first TPC hit
NB: additional columns have been added for Stv as of Sep. 10th and Sep. 23rd with some items addressed.
| Sti | Stv | Stv Sep. 10 | Stv Sep. 23 | |
|---|---|---|---|---|
| # hits on tracks | 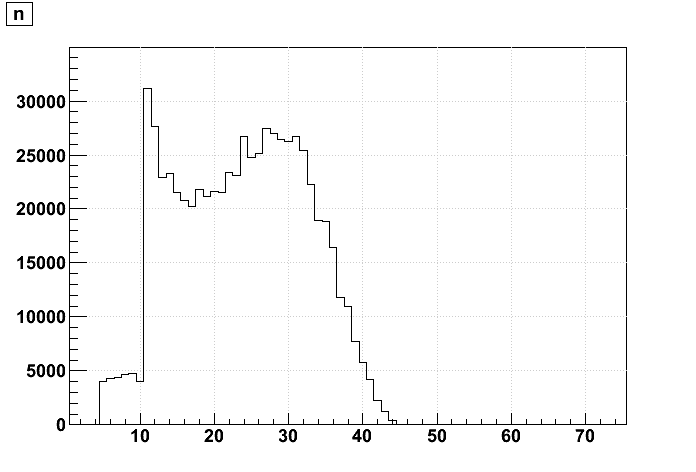 |
 |
 |
 |
| row vs. sector of all hits on tracks | 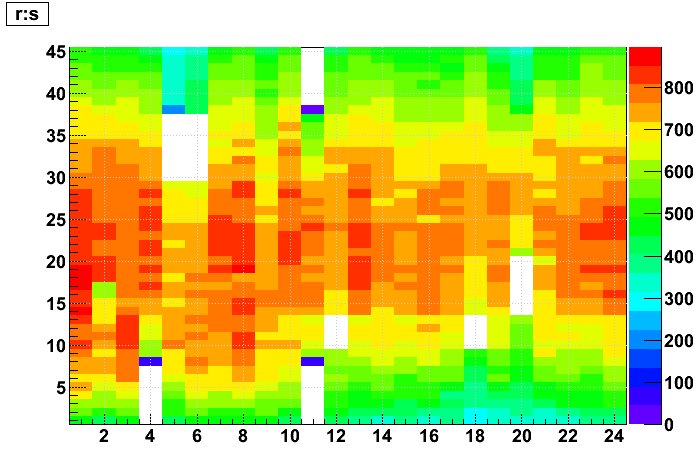 |
 |
 |
 |
| row vs. sector of all hits on short (# hits <= 20) tracks |
 |
 |
 |
 |
| Δrow | 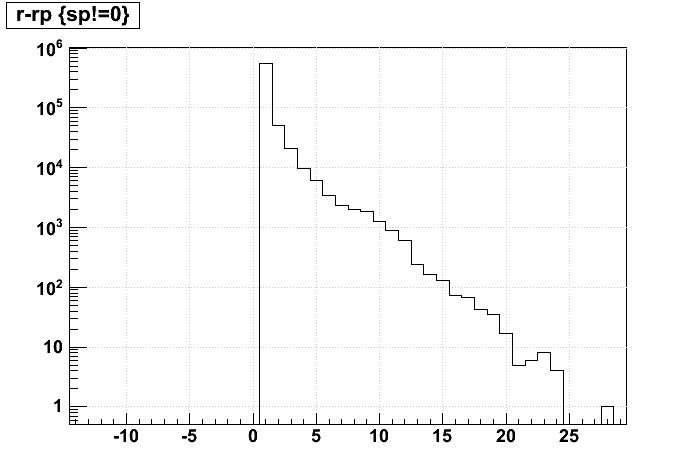 |
 |
 |
 |
| Δradius vs. Δrow (multiple bands are due to inner sector vs. outer sector row spacing) |
 |
 |
 |
 |
| Δrow vs. log10(pT) | 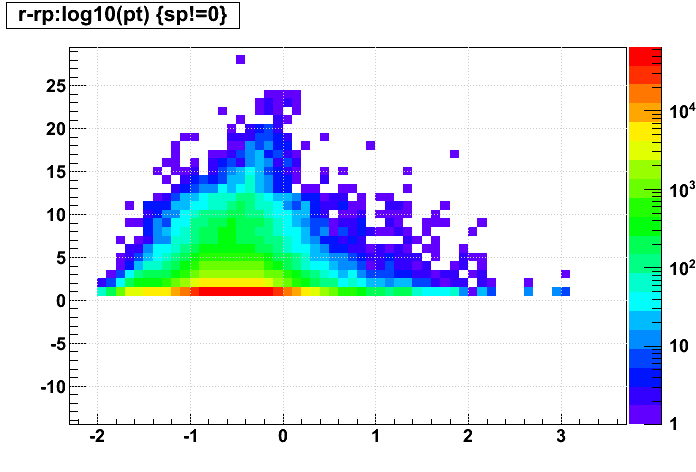 |
 |
 |
 |
| Δrow vs. φ with both hits in same sector |
 |
 |
 |
 |
| Δrow vs. φ with hits in different sectors |
 |
 |
 |
 |
| log10(cuvature) | 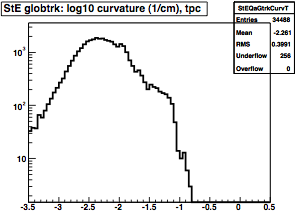 |
 |
 |
|
| log10(p) vs. track length | 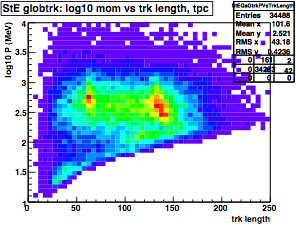 |
 |
 |
|
| signed DCA distribution | 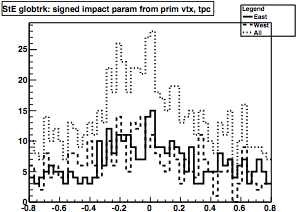 |
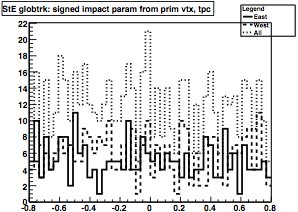 |
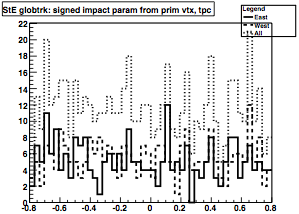 |
|
| zlast hit vs. zfirst hit | 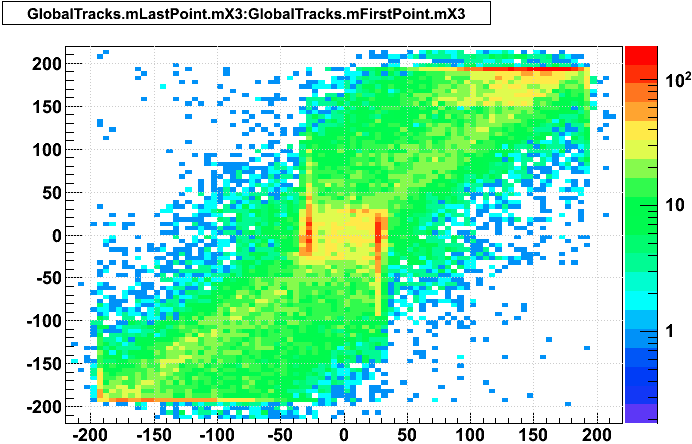 |
 |
 |
|
| Primary track zlast hit vs. zfirst hit |
 |
 |
 |
|
| Primary track yfirst hit vs. xfirst hit |
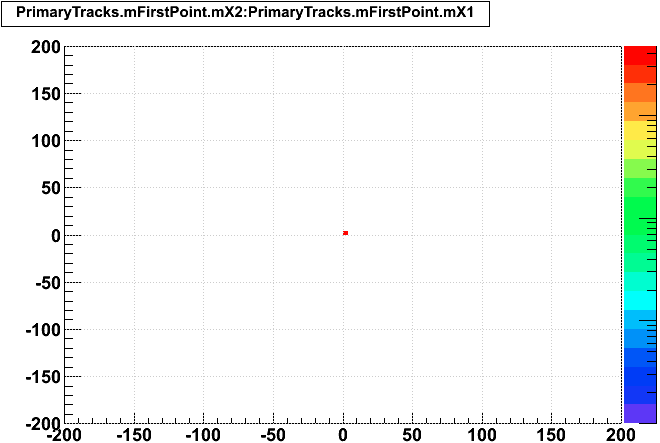 |
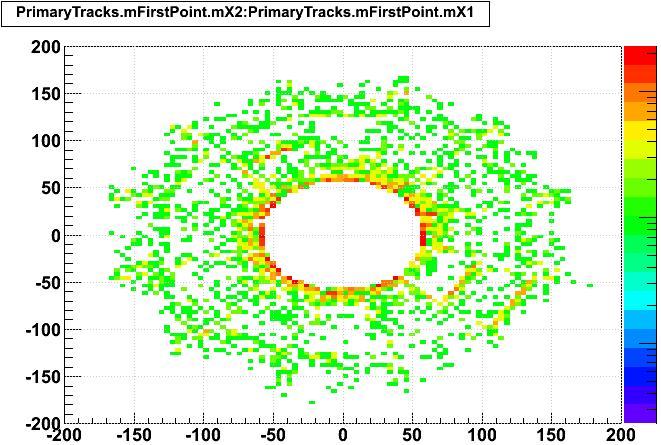 |
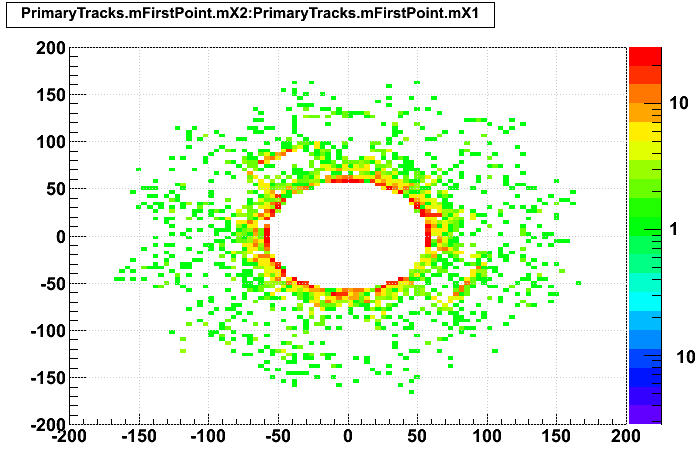 |
__________________
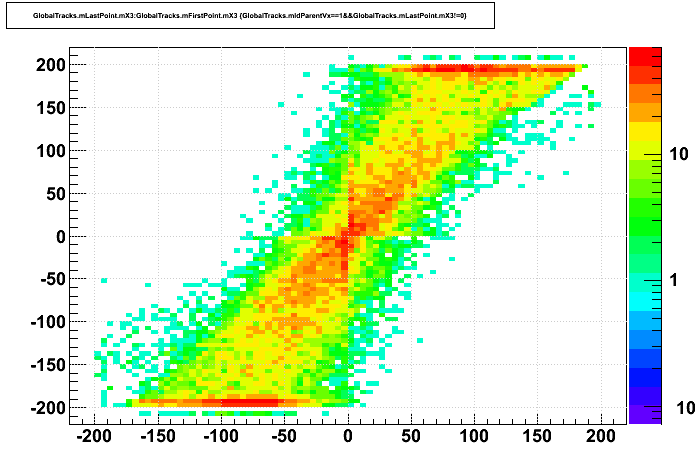
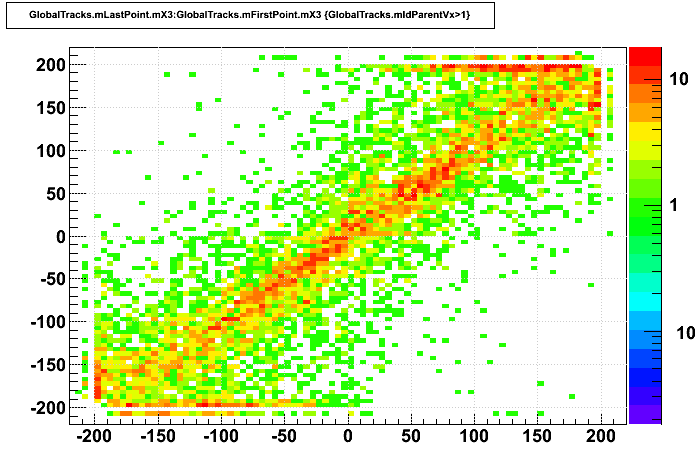
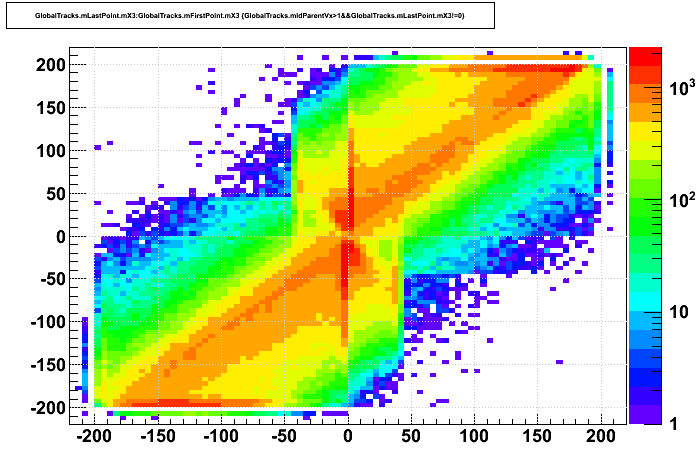
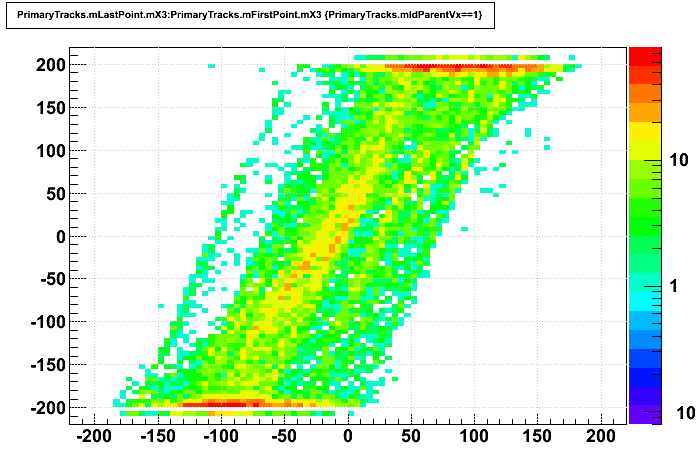
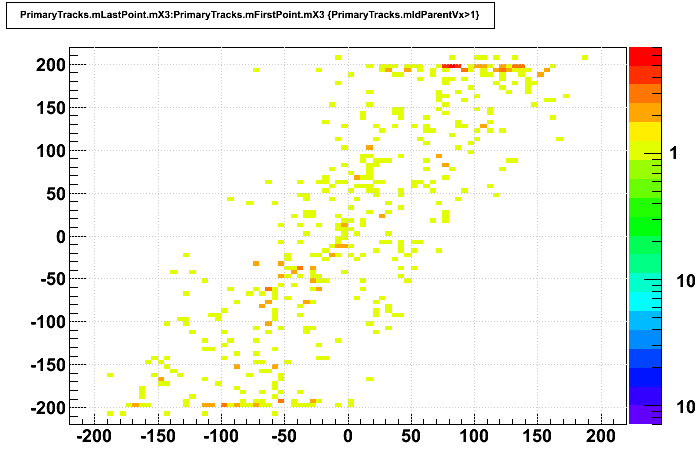
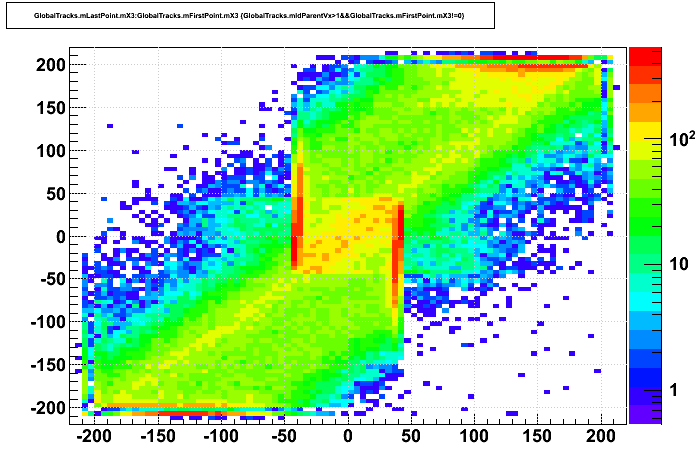
Other (older) Stv datasets' zlast hit vs. zfirst hit:
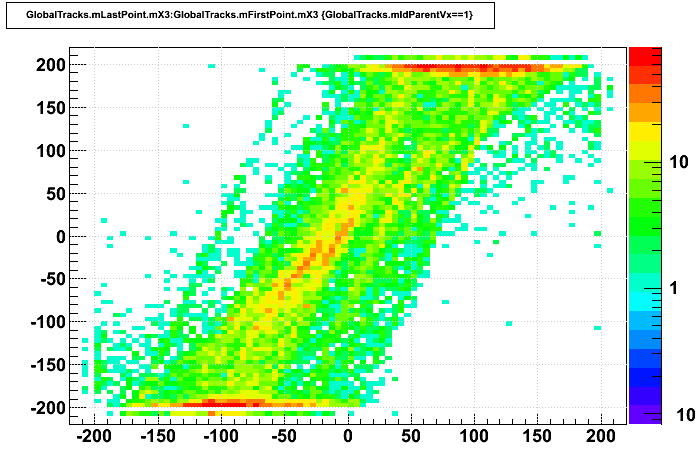
- Parent vertex id == 1 are tracks from the "triggered" collision vertex; others are pile-up and/or secondaries
- Steepness of slope in these plots is a clear correlator to the source vertex:
- Steeper slopes, of ~190/60, are triggered collision primaries, as this is ~(radiusoutermost padrow / radiusinnermost padrow), shifted left and right by the z of the triggered collision primary vertex
- Shallower slopes, randomly spread around 1, are the pile-up and/or secondaries
- AuAu200 without pile-up shows no noticeable effects of the TPC central membrane
- pp500 with pile-up shows some effects of the central membrane
- The effect on primary tracks from the triggered collision is modest, but not absent (as in the AuAu200 without pile-up)
- The effect on other tracks is perhaps just a little stronger, but not as strong as seen in the pp500 real data shown above
| Stv simulations | AuAu200 without pile-up 2013-08-05 50 events |
pp500 with 1MHz pile-up 2013-06-06 5000 events |
|---|---|---|
| Globals parent vtx id == 1 |
 |
 |
| Globals parent vtx id > 1 |
 |
 |
| Primaries parent vtx id == 1 |
 |
 |
| Primaries parent vtx id > 1 |
 |
 |
__________________
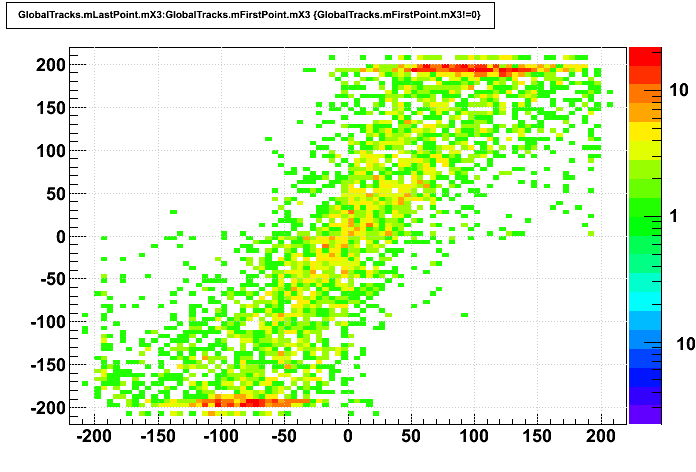
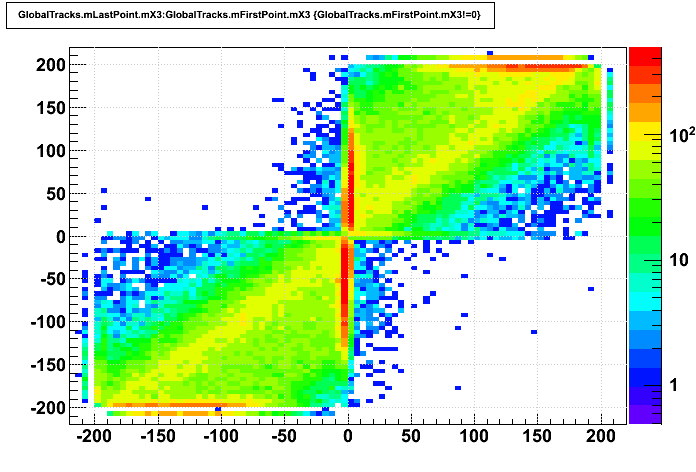
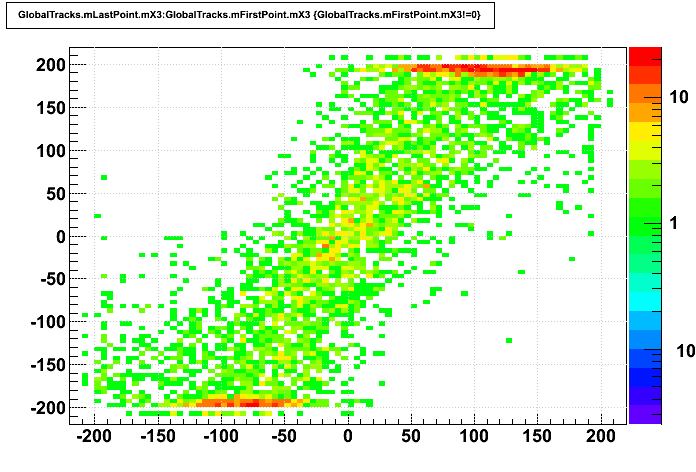
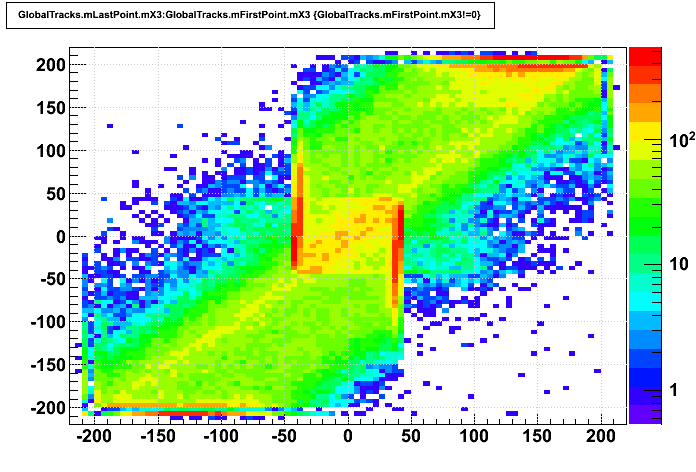
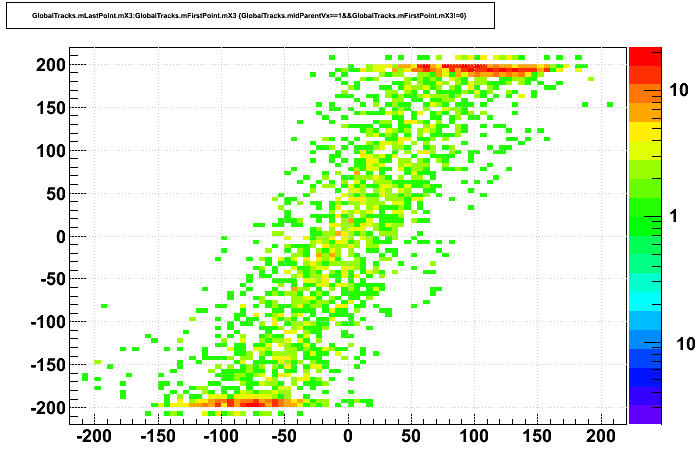
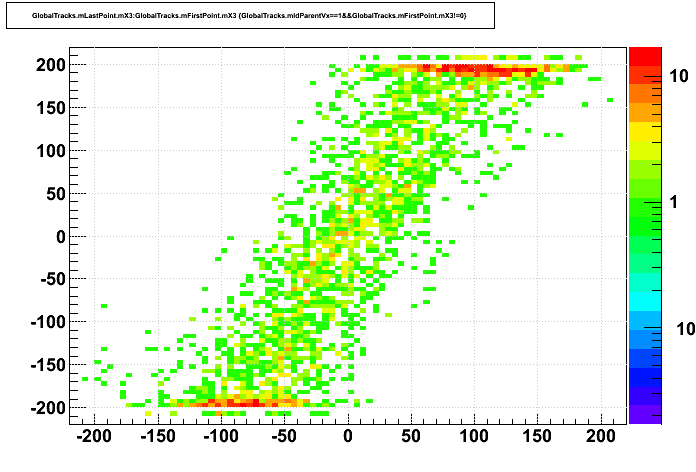
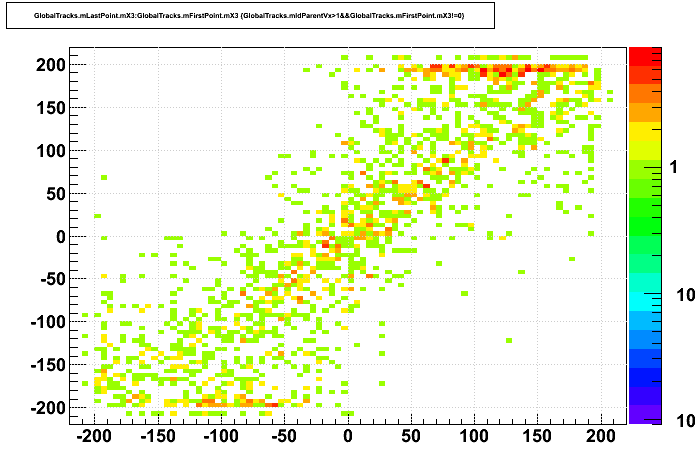
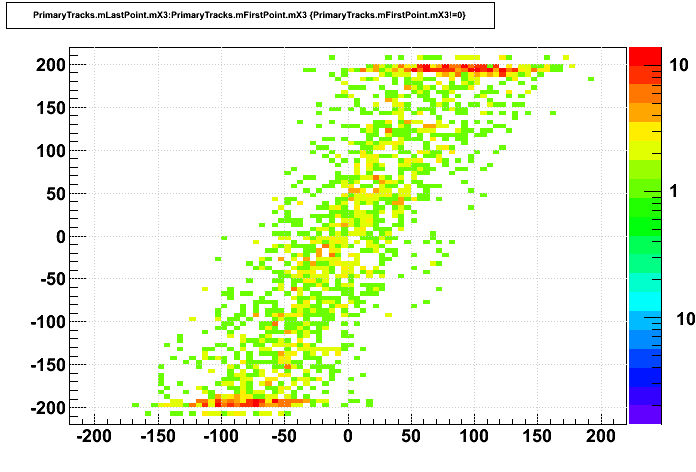
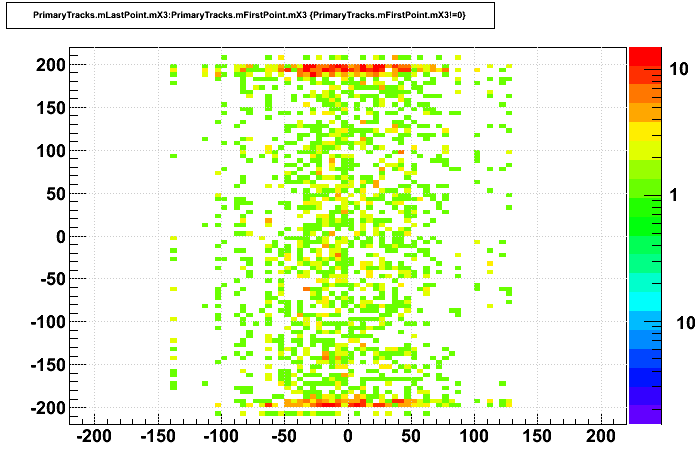
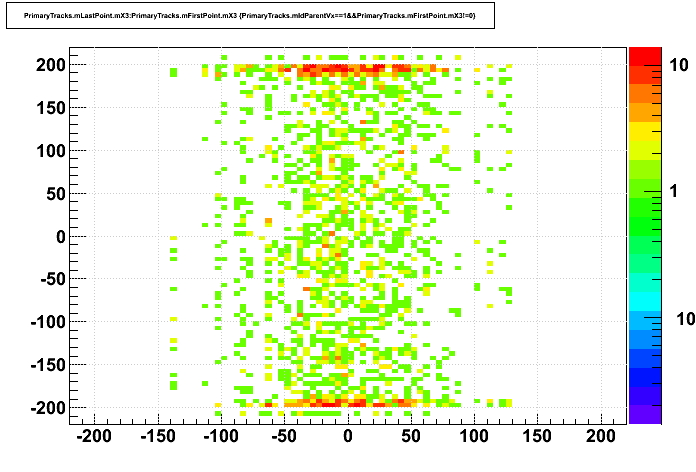
New Stv datasets' zlast hit vs. zfirst hit:
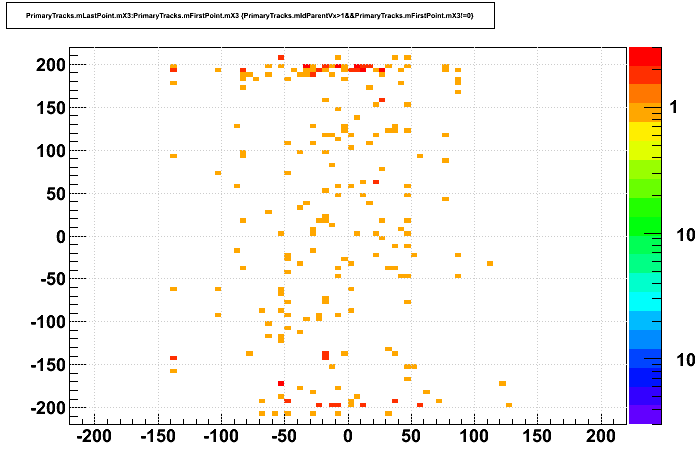
- For the Stv datasets, all tracks had parent vertex id = 1
- Without pile-up, things look as expected
- Using Stv primaries as a proxy for the triggered collision tracks, it is not obvious that things are OK when there is pile-up
- Sti globals with parent vertex id = 1 look fine, implying that the simulation of pile-up has no inherent problems
| pp500 simulations 2013-08-29 500 events |
without pile-up | with 1MHz pile-up |
|---|---|---|
| Stv Globals parent vtx id == any |
 |
 |
| Sti Globals parent vtx id == any |
 |
 |
| Sti Globals parent vtx id == 1 |
 |
 |
| Sti Globals parent vtx id > 1 |
 |
 |
| Stv Primaries parent vtx id == any |
 |
 |
| Sti Primaries parent vtx id == any |
 |
 |
| Sti Primaries parent vtx id == 1 |
 |
 |
| Sti Primaries parent vtx id > 1 |
 |
 |
__________________
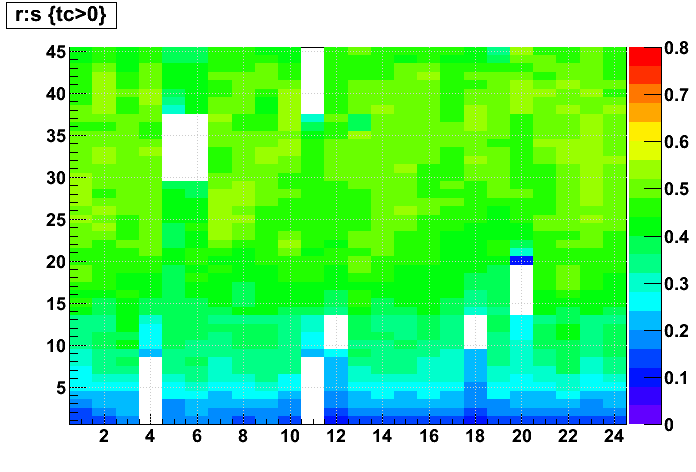
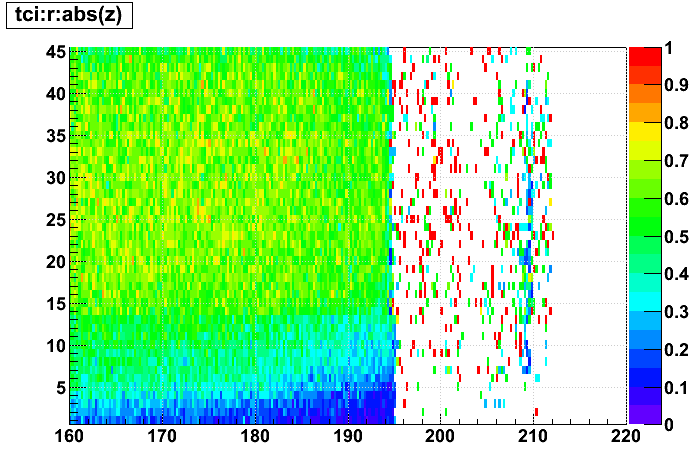
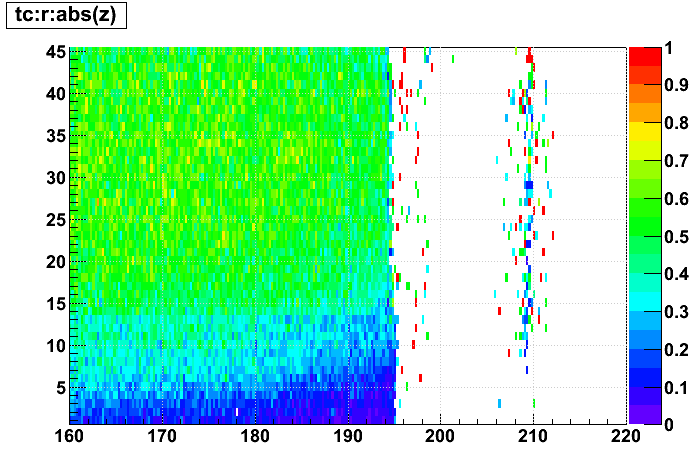
Fraction of found hits placed on tracks:
Looking again at the same 40 events of real Run 9 pp500 data from the top of this blog page...
- Sti and Stv start out with the exact same sample of TPC hits (a good check!)
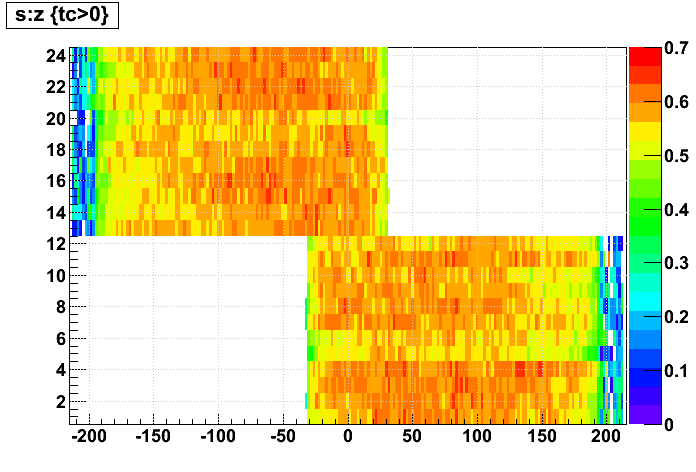
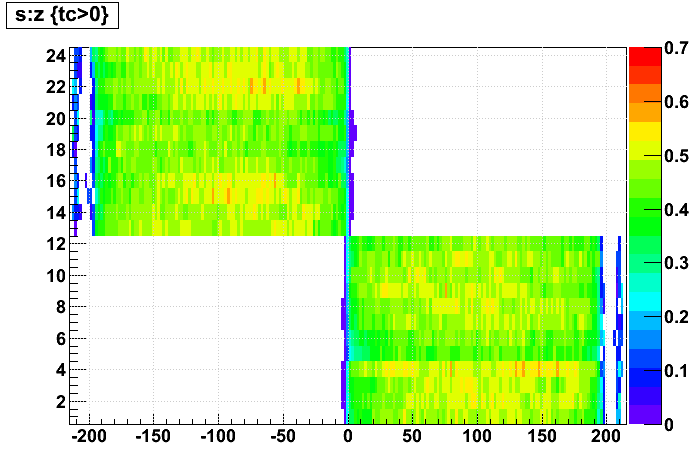
- Stv places zero "wrong side" hits on tracks, though the transition to zero happens over a length of a few centimeters, not exactly at z=0
- "wrong side" hits are pile-up hits in the TPC recorded in timebins which come after the full drift length readout for the triggered event, and are thus reconstructed with a z position which is beyond the central membrane for the sector in which it was read out
- Sti has a higher efficiency of placing outer sector (padrow > 13) hits on tracks, but Stv has a smoother transition in efficiency from outer to inner sectors
- Both Sti and Stv have an inefficieny for placing hits at the innermost padrows on tracks (which may be OK: distortion corrections are incorrect for pile-up, and are largest at the innermost padrows, perhaps causing pile-up tracks to lose hits there), but Stv clearly shows a much stronger effect
- Sti has a higher efficiency for using hits (real from the triggered event, real from pile-up, or noise) in the reconstructed z region of the gating grid not yet being open; for much of this region Stv's efficiency for putting a hit on a track is zero
| fraction of hits on tracks |
Sti | Stv |
|---|---|---|
| vs. sector and reconstructed z near the central membrane |
 |
 |
| vs. row and sector | 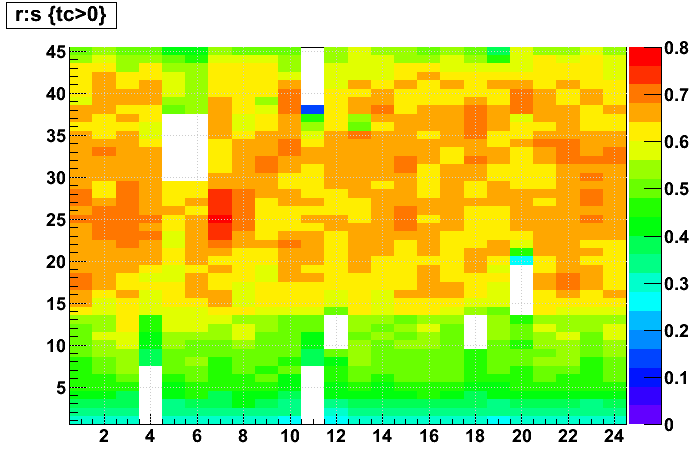 |
 |
| vs. row and sector excluding "wrong side" hits |
 |
 |
| vs. row and reconstructed |z| near the endcap |
 |
 |
__________________
Sep. 7 patch for fraction of found hits placed on tracks:
First 20 events from st_W_10102066_raw_7170001:
- Only sector 1 seems to really use the "wrong side" hits (though perhaps a few of these hits are used in sectors 4, 11, 12)
- Sector 1 has also seen a big drop in efficiency (~50%) for placing any hits on tracks
| fraction of hits on tracks |
eval13a | eval13 + Sep 7 patch |
|---|---|---|
| vs. sector and reconstructed z near the central membrane |
 |
 |
__________________
Sep. 15 patch for fraction of found hits placed on tracks:
First 20 events from st_W_10102066_raw_7170001:
- Looks good!
| fraction of hits on tracks |
eval13a | eval13 + Sep 15 patch |
|---|---|---|
| vs. sector and reconstructed z near the central membrane |
 |
 |
__________________
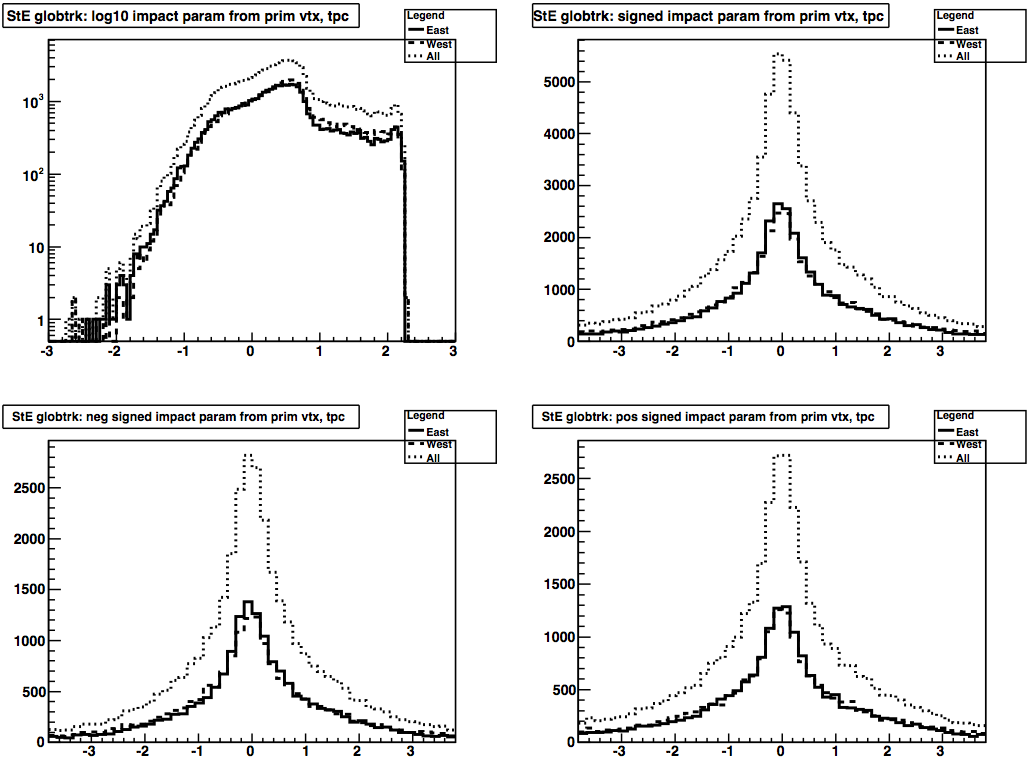
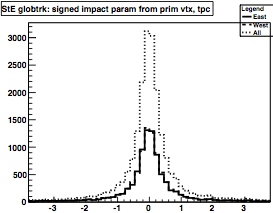
Signed DCAs (after the Sep. 15 patch):
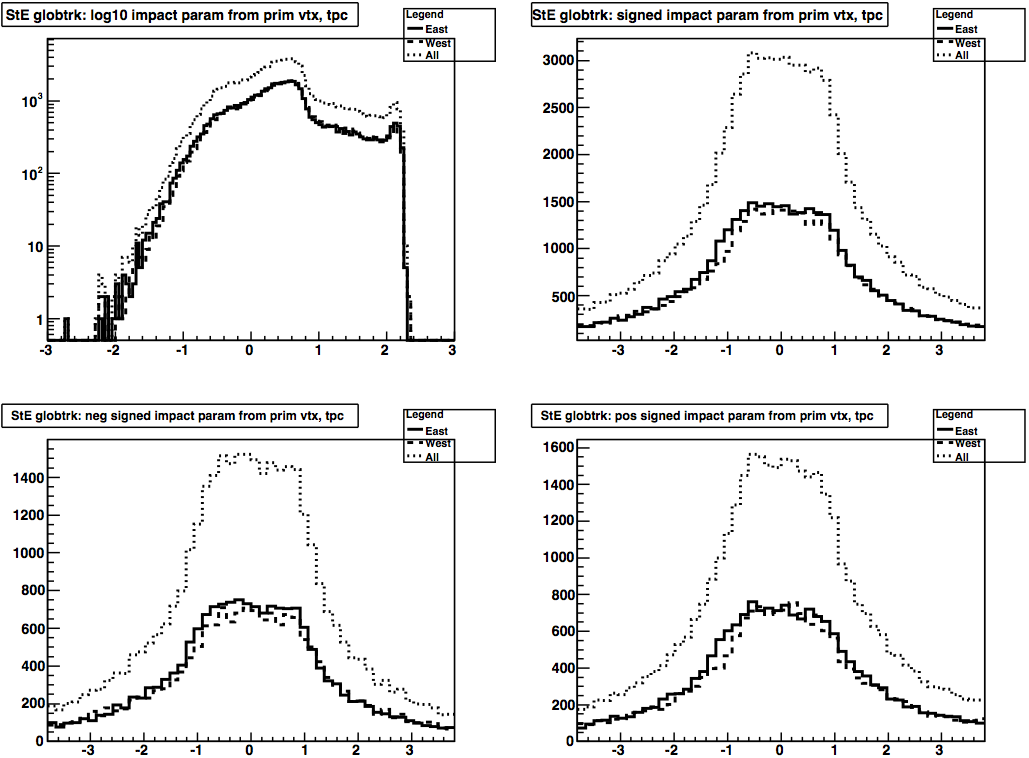
All 1900 events from st_W_10102066_raw_7170001, all global tracks with flag>0 and with no wrong sign (post-membrane) hits (from the Offline QA histograms, using the DCA geometry's helix function geometricSignedDistance(xvtx,yvtx); units are [cm]):
NB: I had to skip the check on track topology map for having TPC hits, as Stv does not properly populate the topology map still.
- Top left: log10(DCA)
- Top right: sDCA of all charges
- Bottom left: sDCA of neg. charge
- Bottom right: sDCA of pos. charge
- Stv has a much larger spread in sDCA which is not attributable to charge splitting (it's there for both charges)
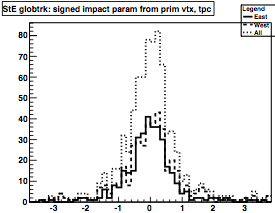
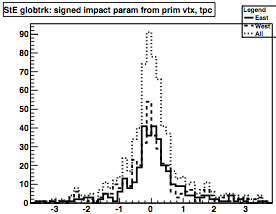
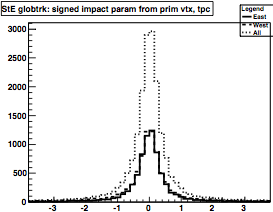
- I added some simulations from earlier this year, only including sDCA of all charges
- Stv is much better in these simulations, and actually better than Sti in the pp500 simulation with pile-up
| Dataset: | Sti | Stv |
|---|---|---|
| Run 9 pp500 real data |
 |
 |
| Run 9 pp500 simulation |
 |
 |
| Run 10 AuAu200 simulation |
 |
 |
________________
Sep 23 Stv update: Still a problem:

______________
Oct. 1 Stv update: resolved! The problem was an inversion of (x,y) of the position of the DCA point in Stv to (-x,-y).
In addition to the Run 9 pp500 shown below, we re-ran the Run 10 AuAu200 ideal simulation and I re-produced the plot for it but did not include it here because it looks nearly identical to the above-shown plot of sDCA for AuAu200 from August 5th. A closer look makes it a little clearer that the plot has flipped left-to-right, which tells me that while the sign flip was present in the old simulation, the fact that the simulation threw vertices at (0,0) meant that a sign inversion in the in the DCA position did not lead to a smearing of the sDCA values.

Groups:
- genevb's blog
- Login or register to post comments
