- genevb's home page
- Posts
- 2024
- 2023
- 2022
- September (1)
- 2021
- 2020
- 2019
- December (1)
- October (4)
- September (2)
- August (6)
- July (1)
- June (2)
- May (4)
- April (2)
- March (3)
- February (3)
- 2018
- 2017
- December (1)
- October (3)
- September (1)
- August (1)
- July (2)
- June (2)
- April (2)
- March (2)
- February (1)
- 2016
- November (2)
- September (1)
- August (2)
- July (1)
- June (2)
- May (2)
- April (1)
- March (5)
- February (2)
- January (1)
- 2015
- December (1)
- October (1)
- September (2)
- June (1)
- May (2)
- April (2)
- March (3)
- February (1)
- January (3)
- 2014
- December (2)
- October (2)
- September (2)
- August (3)
- July (2)
- June (2)
- May (2)
- April (9)
- March (2)
- February (2)
- January (1)
- 2013
- December (5)
- October (3)
- September (3)
- August (1)
- July (1)
- May (4)
- April (4)
- March (7)
- February (1)
- January (2)
- 2012
- December (2)
- November (6)
- October (2)
- September (3)
- August (7)
- July (2)
- June (1)
- May (3)
- April (1)
- March (2)
- February (1)
- 2011
- November (1)
- October (1)
- September (4)
- August (2)
- July (4)
- June (3)
- May (4)
- April (9)
- March (5)
- February (6)
- January (3)
- 2010
- December (3)
- November (6)
- October (3)
- September (1)
- August (5)
- July (1)
- June (4)
- May (1)
- April (2)
- March (2)
- February (4)
- January (2)
- 2009
- November (1)
- October (2)
- September (6)
- August (4)
- July (4)
- June (3)
- May (5)
- April (5)
- March (3)
- February (1)
- 2008
- 2005
- October (1)
- My blog
- Post new blog entry
- All blogs
Stv: performance of iterations
Introduction:
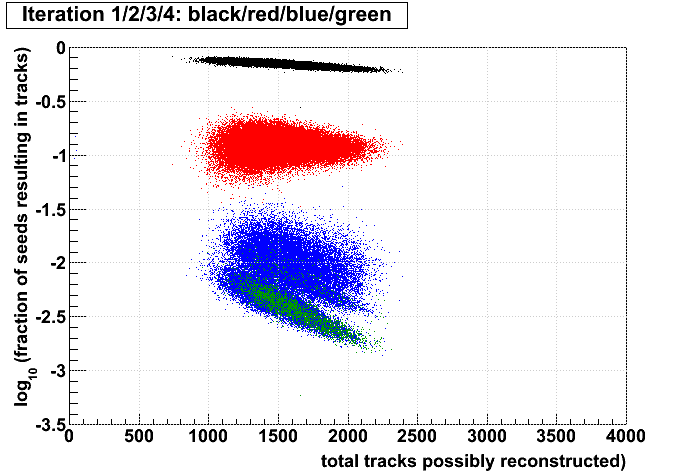
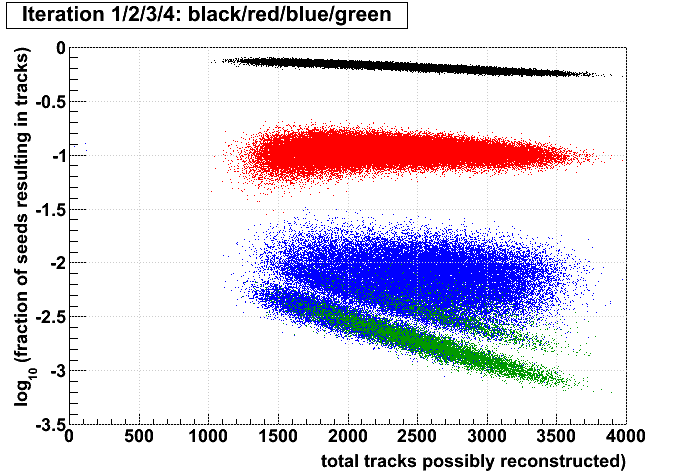
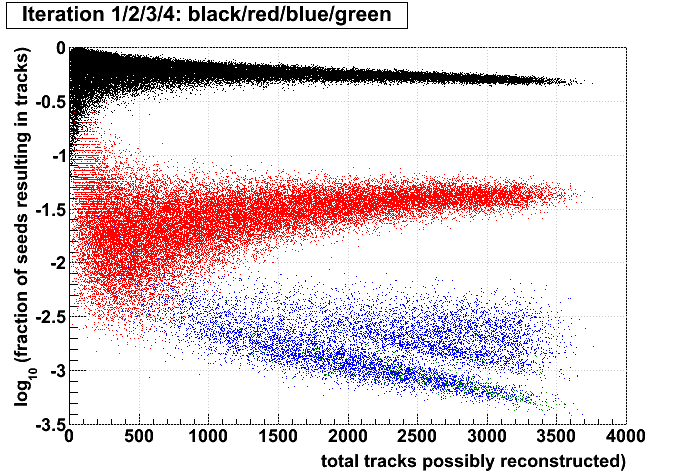
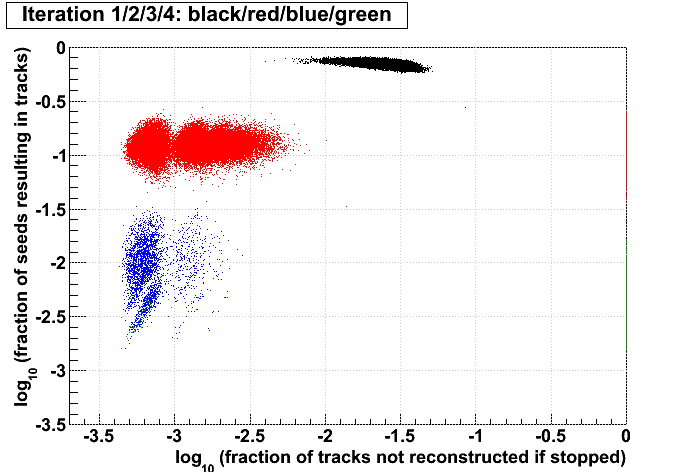
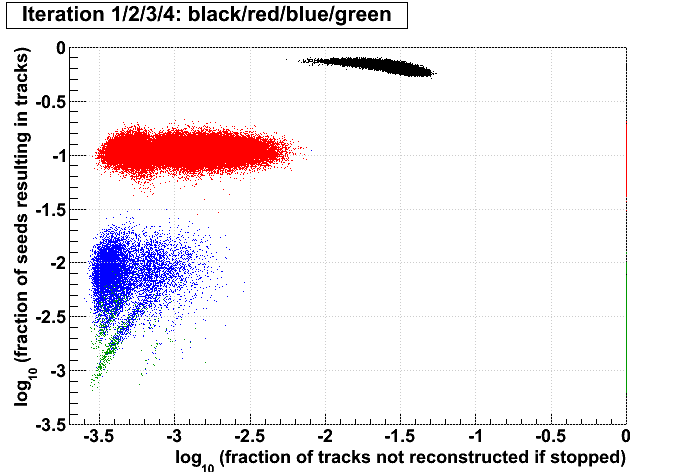
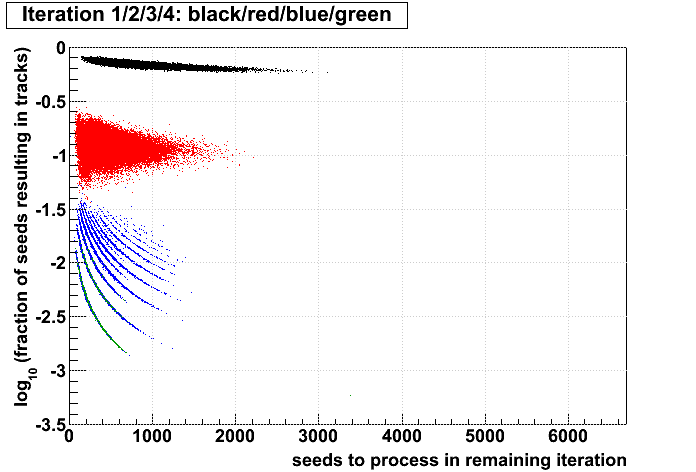
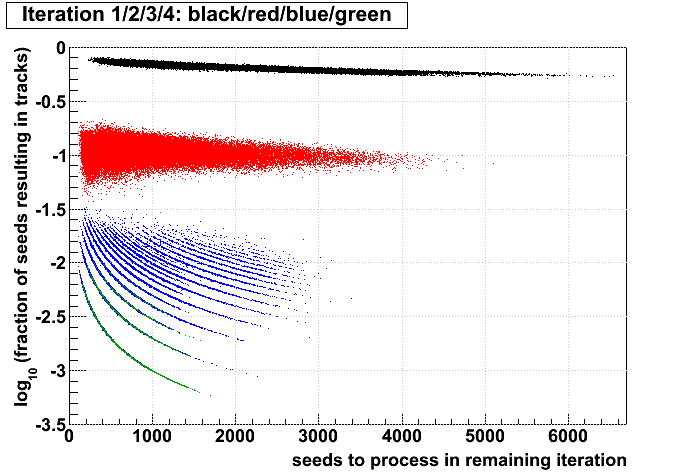
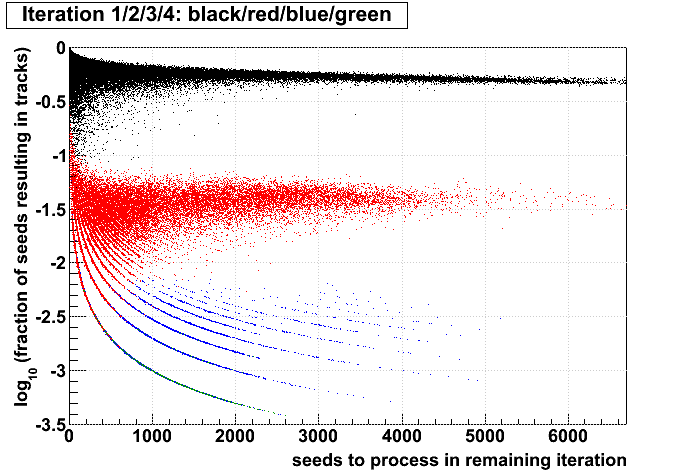
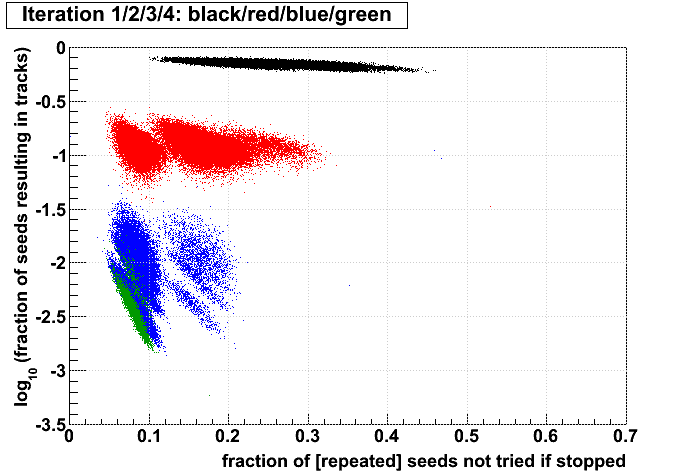
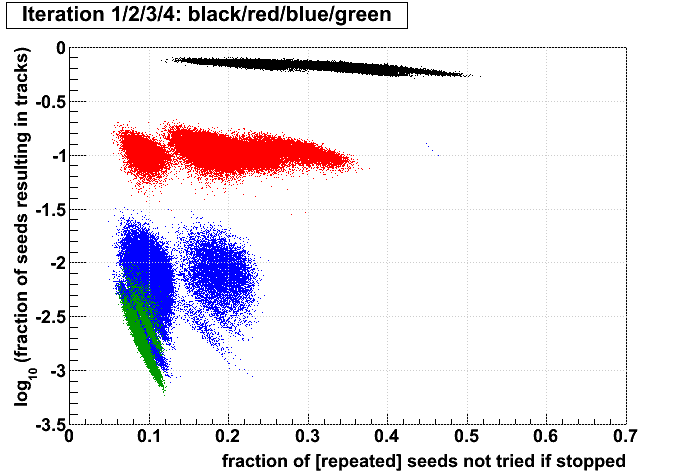
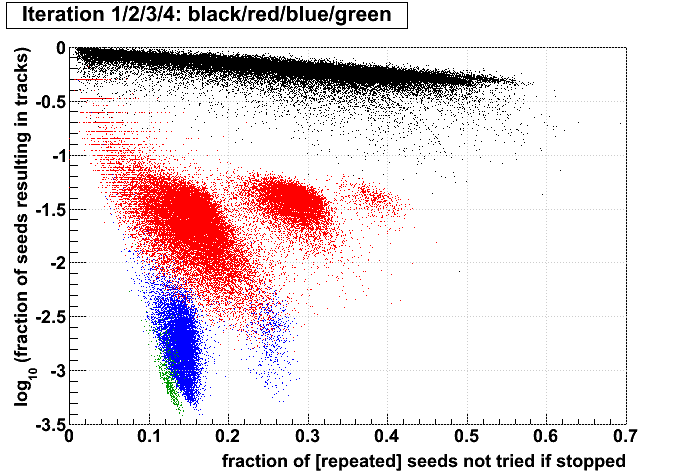
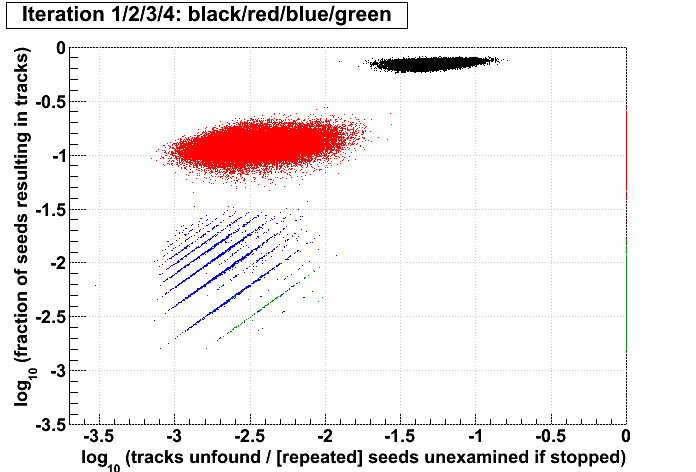
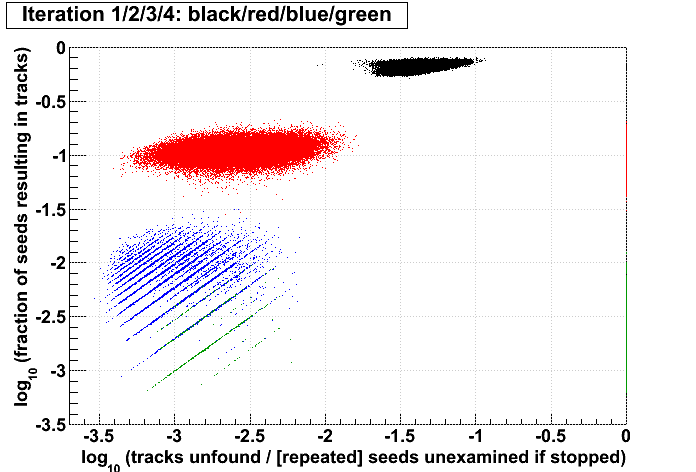
Jason pointed out to me that for each event, Stv currently prints out the number of seeds and subsequently tracks found at each iteration. I put these into an ntuple and made some plots. My conclusions follow the plots. All plots show the iterations in colors 1,2,3,4, and have what I call the iterations' "performance" on the vertical axis (ordinate), which is defined as the fraction of seeds in that iteration which become tracks. The goal here is to understand whether performance is a better tool to decide when to stop iterating rather than simply stopping after iteration 2.
How it was done:
To explain the definitions, for each event is printed out lines like this:
StvMaker:INFO - StvKalmanTrackFinder::FindTracks: : SeedFinder(Default) Seeds=s1 Tracks=t1 ratio=xx%
StvMaker:INFO - StvKalmanTrackFinder::FindTracks: : SeedFinder(Default) Seeds=s2 Tracks=t2 ratio=yy%
...
I have kept s1..6 and t1..6 for each event. The performance of an iteration i is then simply (ti/si), and the ordinate of the plots is always log10(ti/si). Scripts used to generate the plots (StvIterations_*) are attached to this drupal page.
Plots:
Conclusions:
________
-Gene
Jason pointed out to me that for each event, Stv currently prints out the number of seeds and subsequently tracks found at each iteration. I put these into an ntuple and made some plots. My conclusions follow the plots. All plots show the iterations in colors 1,2,3,4, and have what I call the iterations' "performance" on the vertical axis (ordinate), which is defined as the fraction of seeds in that iteration which become tracks. The goal here is to understand whether performance is a better tool to decide when to stop iterating rather than simply stopping after iteration 2.
How it was done:
To explain the definitions, for each event is printed out lines like this:
StvMaker:INFO - StvKalmanTrackFinder::FindTracks: : SeedFinder(Default) Seeds=s1 Tracks=t1 ratio=xx%
StvMaker:INFO - StvKalmanTrackFinder::FindTracks: : SeedFinder(Default) Seeds=s2 Tracks=t2 ratio=yy%
...
I have kept s1..6 and t1..6 for each event. The performance of an iteration i is then simply (ti/si), and the ordinate of the plots is always log10(ti/si). Scripts used to generate the plots (StvIterations_*) are attached to this drupal page.
Plots:
| Run 9 pp500 st_W | Run 9 pp500 W embedding | Run 10 AuAu Ideal MC | Definition of abscissa |
|---|---|---|---|
 |
 |
 |
t1 + ... |
 |
 |
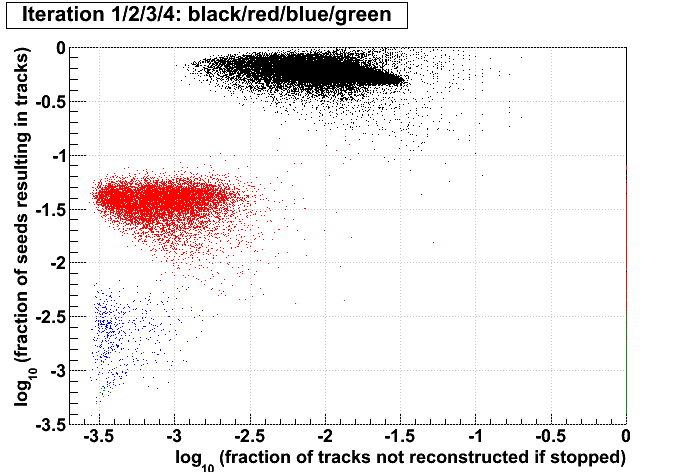 |
log10([ti+1 + ...]/[t1 + ...]) where i is the iteration examined, such that for iteration 2 the quantity plotted is: log10([t3 + ...]/[t1 + ...]) |
 |
 |
 |
si+1 + ... |
 |
 |
 |
log10([si+1 + ...]\[s1 + ...]) |
 |
 |
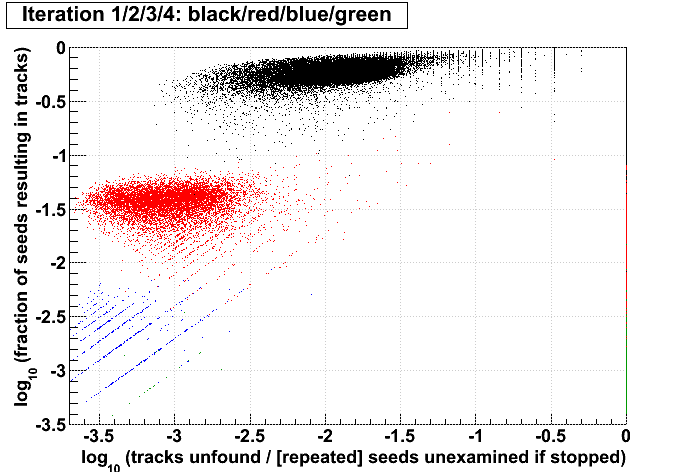 |
log10([ti+1 + ...]/[si+1 + ...]) |
Conclusions:
- The more tracks there are to find, the less performant iteration 1 will be.
- For AuAu200 events in which iteration 2 is performant (converts >10% of seeds into tracks), there are very few total tracks.
- Less than 1% of tracks (in nearly all events) are found after iteration 2.
- There is no notable correlation between fraction of unfound tracks and the performance of iteration 2.
- Using seeds as a proxy for time spent (correlated, but perhaps a poor proxy anyhow), then stopping after a poorly performing iteration saves more time (or a larger fraction of the event's time) at each iteration.
- Each iteration's performance has only a mild correlation with performance or remaining iterations.
________
-Gene
Groups:
- genevb's blog
- Login or register to post comments
