- genevb's home page
- Posts
- 2025
- 2024
- 2023
- 2022
- September (1)
- 2021
- 2020
- 2019
- December (1)
- October (4)
- September (2)
- August (6)
- July (1)
- June (2)
- May (4)
- April (2)
- March (3)
- February (3)
- 2018
- 2017
- December (1)
- October (3)
- September (1)
- August (1)
- July (2)
- June (2)
- April (2)
- March (2)
- February (1)
- 2016
- November (2)
- September (1)
- August (2)
- July (1)
- June (2)
- May (2)
- April (1)
- March (5)
- February (2)
- January (1)
- 2015
- December (1)
- October (1)
- September (2)
- June (1)
- May (2)
- April (2)
- March (3)
- February (1)
- January (3)
- 2014
- December (2)
- October (2)
- September (2)
- August (3)
- July (2)
- June (2)
- May (2)
- April (9)
- March (2)
- February (2)
- January (1)
- 2013
- December (5)
- October (3)
- September (3)
- August (1)
- July (1)
- May (4)
- April (4)
- March (7)
- February (1)
- January (2)
- 2012
- December (2)
- November (6)
- October (2)
- September (3)
- August (7)
- July (2)
- June (1)
- May (3)
- April (1)
- March (2)
- February (1)
- 2011
- November (1)
- October (1)
- September (4)
- August (2)
- July (4)
- June (3)
- May (4)
- April (9)
- March (5)
- February (6)
- January (3)
- 2010
- December (3)
- November (6)
- October (3)
- September (1)
- August (5)
- July (1)
- June (4)
- May (1)
- April (2)
- March (2)
- February (4)
- January (2)
- 2009
- November (1)
- October (2)
- September (6)
- August (4)
- July (4)
- June (3)
- May (5)
- April (5)
- March (3)
- February (1)
- 2008
- 2005
- October (1)
- My blog
- Post new blog entry
- All blogs
Background in Run 24 pp200
Updated on Mon, 2024-05-06 23:19. Originally created by genevb on 2024-05-06 12:51.
Backgrounds, as reported by the trigger (RICH) scalers, have been very high at the beginning of fills so far. I decided to look at what I could see in tracking...
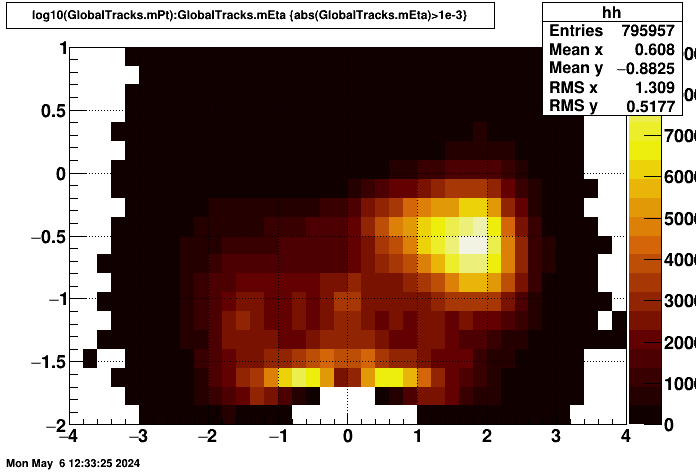
Run 25124010 was at the beginning of a fill, and run 25124028 at the end of the same fill. Here is global track log10(pT) vs. eta, showing a large blob at positive eta with pT in the few hundred MeV range for run 25124010 (left below), which isn't visible in run 25124028 (right below):

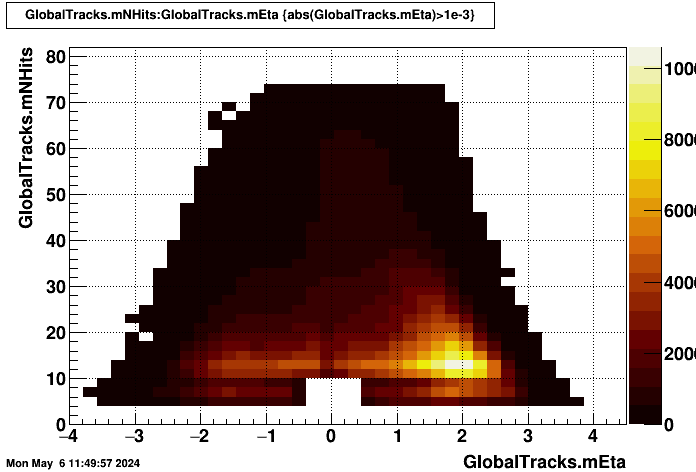
Focusing on run 25124010, the one with the prominent background, here is Nhits vs. eta. We currently keep short tracks (Nhits<10) for high eta (|eta|>0.5) tracks pointing to the EEMC (west) and ETOF (east):
An important question is how this background is distributed azimuthally. QA plots of TPC clusters have shown excesses at phi near +160°, particularly in the outer TPC (i.e. in TPX instead of iTPC). Here, I looked at last point y vs. x for tracks ending in the outer TPC for eta<-2.0 (left), and eta>2.0 (right). Interestingly, it's the negative eta that appears to be more concentrated in the expect phi region, while positive eta looks rather symmetric in phi.


Stepping back the eta window to -2.0<eta<-1.5 and 1.5<eta<2.0, we see (as can be expected) more tracks whose last point is at the outer perimeter, implying that they exited through the barrel of the TPC rather than the endcap. The phi asymmetry remains more notable at negative eta, with positive eta still rather symmetric in phi.


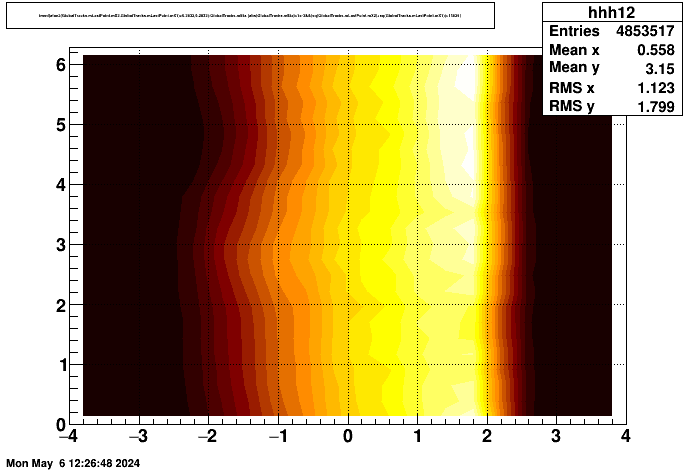
In an effort to get an idea of the eta range of the background with phi of ~160°, (or about 2.8 in radians), I tried looking at the phi of the last hit on global tracks (whose last hit was in the outer TPC) vs. eta. This was about the best I could do, and it shows a prominence at 2.8 radians for all negative eta, and perhaps just a little past eta=0 before it is overcome by the positive eta backgrounds. My inference from this is that the asymmetric-in-phi background may be from the yellow beam going in the negative eta direction, but the larger, symmetric background is from the blue beam going in the positive eta direction.
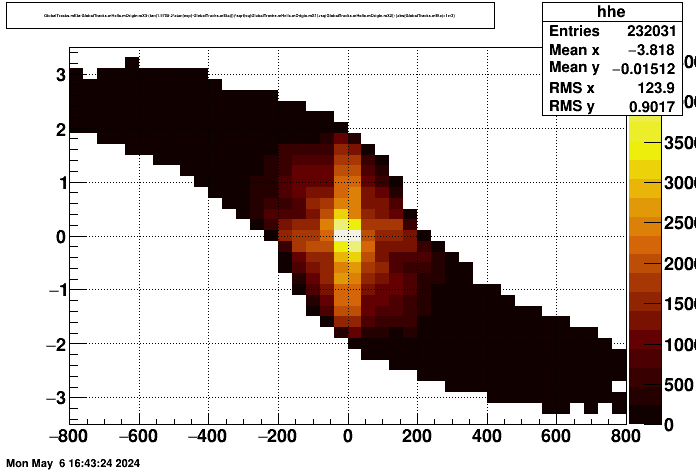
Another observable is to project tracks back to the BeamLine as I did last year. With this it appears again that the highest probability of origin for these background tracks comes from a point at z near -400 cm (i.e. 4 meters to the east of our interaction point), but it is not tightly clustered there (and particles that are from pile-up bunch crossings will create a spread in z with this method). I tried to tease out an origin for the east-bound tracks this way, but couldn't really make anything out. I'm including this plot for run 25124010 (left) and 25124028 (right) for comparison of how low-background data should look.
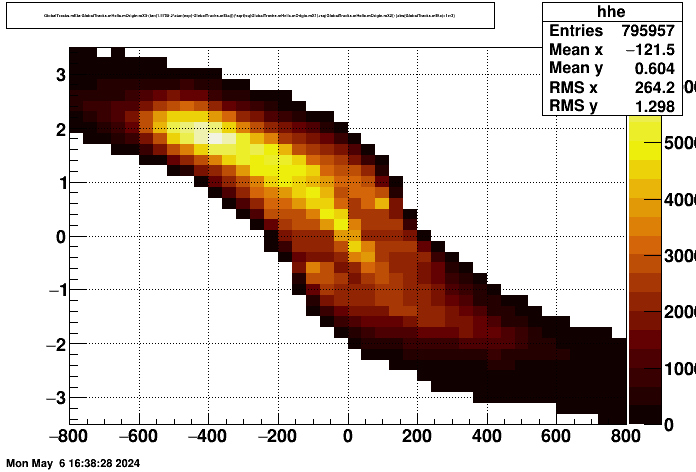
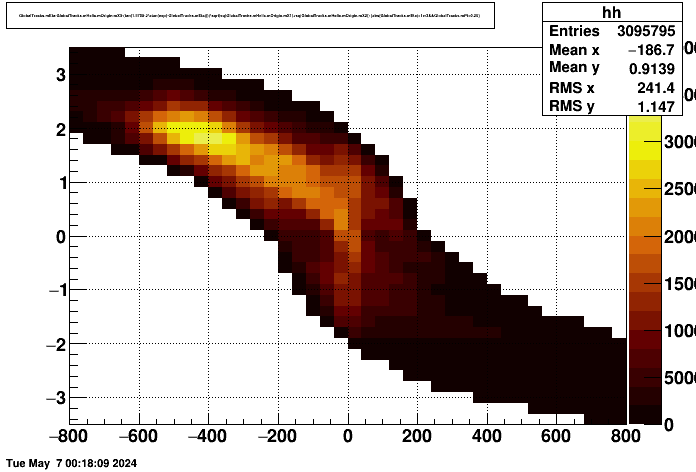
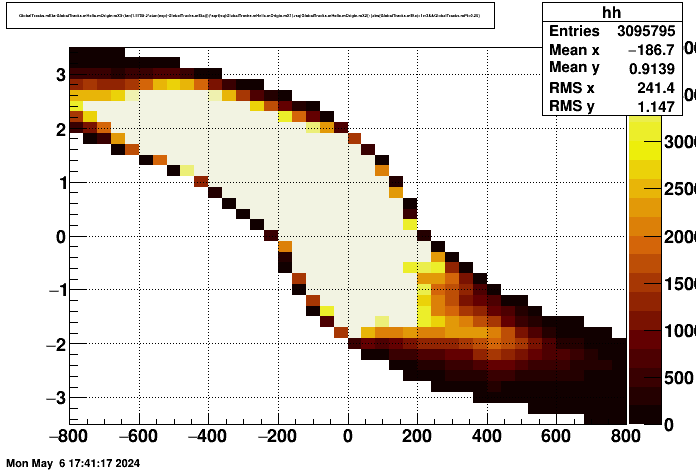
Including a cut on pT>0.25 GeV/c helps enhance the blue beam background further (left below), and the same but reducing the histogram maximum (right below) to better see the features at positive z doesn't really clarify the source for yellow beam background.
-Gene
Run 25124010 was at the beginning of a fill, and run 25124028 at the end of the same fill. Here is global track log10(pT) vs. eta, showing a large blob at positive eta with pT in the few hundred MeV range for run 25124010 (left below), which isn't visible in run 25124028 (right below):


Focusing on run 25124010, the one with the prominent background, here is Nhits vs. eta. We currently keep short tracks (Nhits<10) for high eta (|eta|>0.5) tracks pointing to the EEMC (west) and ETOF (east):

An important question is how this background is distributed azimuthally. QA plots of TPC clusters have shown excesses at phi near +160°, particularly in the outer TPC (i.e. in TPX instead of iTPC). Here, I looked at last point y vs. x for tracks ending in the outer TPC for eta<-2.0 (left), and eta>2.0 (right). Interestingly, it's the negative eta that appears to be more concentrated in the expect phi region, while positive eta looks rather symmetric in phi.


Stepping back the eta window to -2.0<eta<-1.5 and 1.5<eta<2.0, we see (as can be expected) more tracks whose last point is at the outer perimeter, implying that they exited through the barrel of the TPC rather than the endcap. The phi asymmetry remains more notable at negative eta, with positive eta still rather symmetric in phi.


In an effort to get an idea of the eta range of the background with phi of ~160°, (or about 2.8 in radians), I tried looking at the phi of the last hit on global tracks (whose last hit was in the outer TPC) vs. eta. This was about the best I could do, and it shows a prominence at 2.8 radians for all negative eta, and perhaps just a little past eta=0 before it is overcome by the positive eta backgrounds. My inference from this is that the asymmetric-in-phi background may be from the yellow beam going in the negative eta direction, but the larger, symmetric background is from the blue beam going in the positive eta direction.

Another observable is to project tracks back to the BeamLine as I did last year. With this it appears again that the highest probability of origin for these background tracks comes from a point at z near -400 cm (i.e. 4 meters to the east of our interaction point), but it is not tightly clustered there (and particles that are from pile-up bunch crossings will create a spread in z with this method). I tried to tease out an origin for the east-bound tracks this way, but couldn't really make anything out. I'm including this plot for run 25124010 (left) and 25124028 (right) for comparison of how low-background data should look.


Including a cut on pT>0.25 GeV/c helps enhance the blue beam background further (left below), and the same but reducing the histogram maximum (right below) to better see the features at positive z doesn't really clarify the source for yellow beam background.


-Gene
»
- genevb's blog
- Login or register to post comments
