- genevb's home page
- Posts
- 2025
- 2024
- 2023
- 2022
- September (1)
- 2021
- 2020
- 2019
- 2018
- 2017
- December (1)
- October (3)
- September (1)
- August (1)
- July (2)
- June (2)
- April (2)
- March (2)
- February (1)
- 2016
- November (2)
- September (1)
- August (2)
- July (1)
- June (2)
- May (2)
- April (1)
- March (5)
- February (2)
- January (1)
- 2015
- December (1)
- October (1)
- September (2)
- June (1)
- May (2)
- April (2)
- March (3)
- February (1)
- January (3)
- 2014
- 2013
- 2012
- 2011
- January (3)
- 2010
- February (4)
- 2009
- 2008
- 2005
- October (1)
- My blog
- Post new blog entry
- All blogs
Residuals in Run 20 FXT
Updated on Thu, 2024-04-11 15:12. Originally created by genevb on 2024-04-11 14:18.
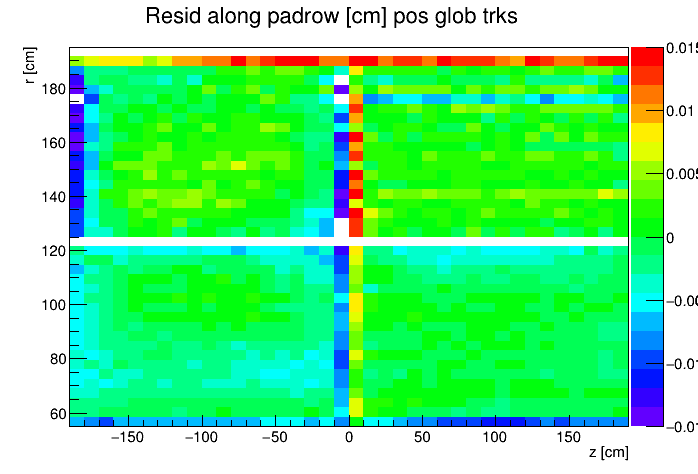
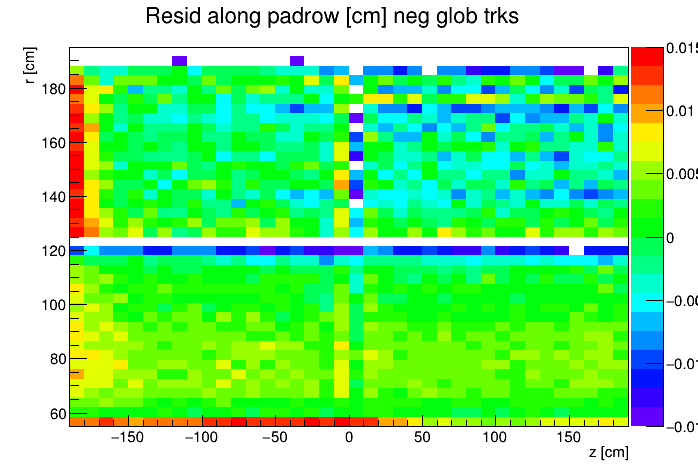
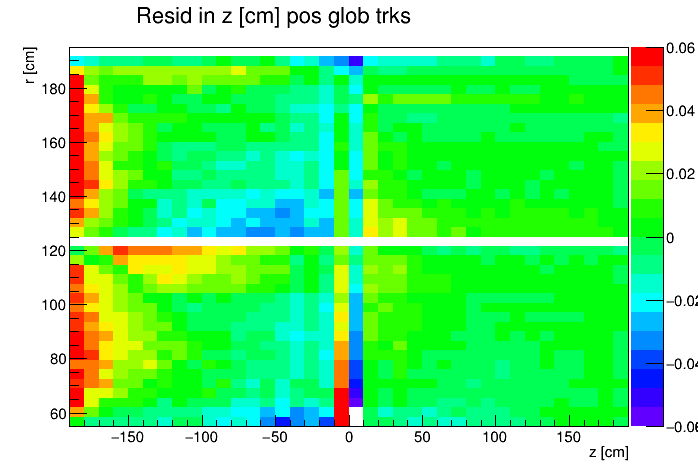
I found a single DAQ file from Run 20 FXT already on disk and used it to generate TPC residuals via StiPulls using the commands listed further down this page. And then from the tags.root files I executed the commands listed at the bottom of this page in ROOT to get the following profile plots of mean residuals for primaries and globals, with essentially no cuts on the tracks. My observations are noted below the plots.
My observations:
Here were the commands used to generate the residuals via StiPulls, taking the chain from the recent P24a production:
| Primaries | Positives | Negatives |
|---|---|---|
| Resid in padrow within ±0.025 cm |
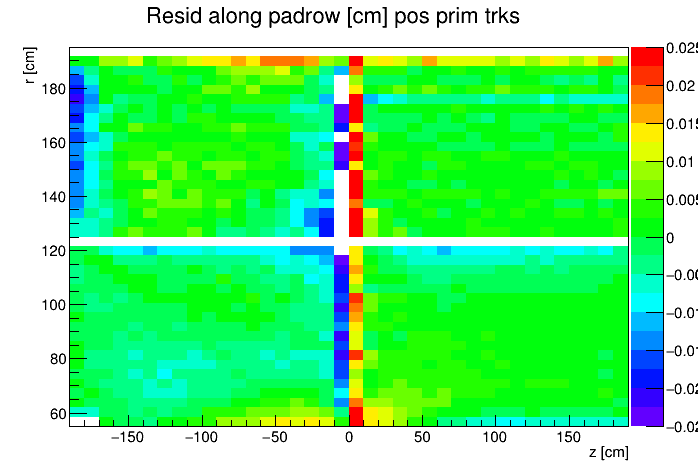 |
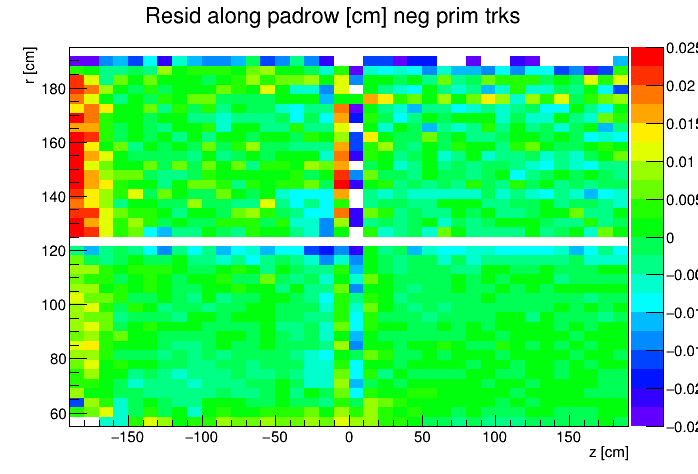 |
| Resid in z within ±0.2 cm |
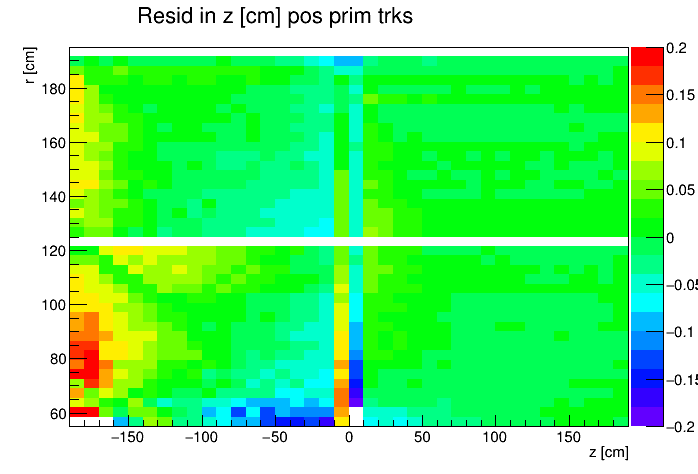 |
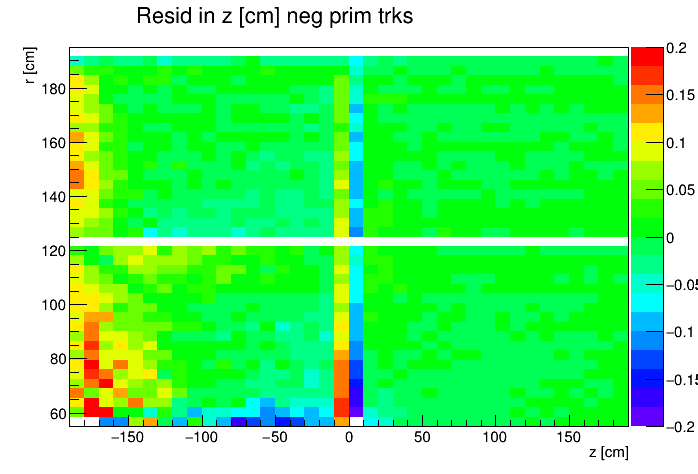 |
| Globals | Positives | Negatives |
| Resid in padrow within ±0.015 cm |
 |
 |
| Resid in z within ±0.06 cm |
 |
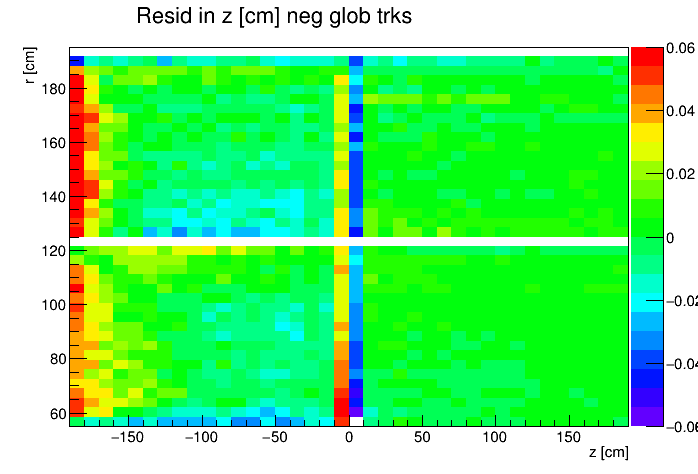 |
My observations:
- Primaries show much larger mean residuals than do globals
- There are mismatches at the central membrane and also at very small radii on the east side (z < 0), consistent with what has been reported elsewhere by the PWGs and in embedding studies
- Near the east endcap (z < -160 cm) there are multiple non-zero mean residual observations:
- In z, at all radii for primaries, though for globals they are bigger for smaller radii
- Along the padrow, mostly for the outer sectors (larger radii) though still a little bit also for the inner sectors (smaller radii)
- In z, positive and negative tracks in the same direction
- Along the padrow, in opposite directions for positive and negative tracks
- There's some bias in mean z residuals notable at the outermost radii of the inner sectors a little further out from the east endcap (-160 < z < -60 cm) and opposingly at the innermost radii of the outer sectors even close to the central membrane (-110 < z < -10 cm)
Here were the commands used to generate the residuals via StiPulls, taking the chain from the recent P24a production:
starver SL24a
root4star -b -q -l 'bfc.C(3600,"DbV20240330 P2020a StiCA FXT -mtd picoVtxFXT PicoCovMtxWrite BEmcChkStat -OSpaceZ2 -OGridLeakFull -hitfilt StiPulls","/tmp/genevb/ETOFOFFSET/st_physics_21036008_raw_3500010.daq")'
And here are the commands used to generate the above plots in ROOT:
TCanvas c1;
TCanvas c2;
TCanvas c3;
TCanvas c4;

TCut goodp = "abs(mHitsP.lYFit-mHitsP.lYHit)<5&&abs(mHitsP.lZFit-mHitsP.lZHit)<5";
c1.cd();
StiPulls.Draw("mHitsP.lYFit-mHitsP.lYHit:mHitsP.lXHit:mHitsP.lZHit>>jp3(38,-190,190,14,55,195)",goodp&&"mHitsP.mCurv>0","prof zcol");
c2.cd();
StiPulls.Draw("mHitsP.lYFit-mHitsP.lYHit:mHitsP.lXHit:mHitsP.lZHit>>jn3(38,-190,190,14,55,195)",goodp&&"mHitsP.mCurv<0","prof zcol");
c3.cd();
StiPulls.Draw("mHitsP.lZFit-mHitsP.lZHit:mHitsP.lXHit:mHitsP.lZHit>>jpz3(38,-190,190,14,55,195)",goodp&&"mHitsP.mCurv>0","prof zcol");
c4.cd();
StiPulls.Draw("mHitsP.lZFit-mHitsP.lZHit:mHitsP.lXHit:mHitsP.lZHit>>jnz3(38,-190,190,14,55,195)",goodp&&"mHitsP.mCurv<0","prof zcol");

jn3.SetMinimum(-0.025);
jn3.SetMaximum(0.025);
jp3.SetMinimum(-0.025);
jp3.SetMaximum(0.025);
jpz3.SetMaximum(0.2);
jpz3.SetMinimum(-0.2);
jnz3.SetMaximum(0.2);
jnz3.SetMinimum(-0.2);
jp3.SetTitle("Resid along padrow [cm] pos prim trks;z [cm];r [cm]");
jn3.SetTitle("Resid along padrow [cm] neg prim trks;z [cm];r [cm]");
jpz3.SetTitle("Resid in z [cm] pos prim trks;z [cm];r [cm]");
jnz3.SetTitle("Resid in z [cm] neg prim trks;z [cm];r [cm]");
c1.Draw();
c2.Draw();
c3.Draw();
c4.Draw();
c1.SaveAs("FXT2020_ResidPadrow_PosPrim.png");
c2.SaveAs("FXT2020_ResidPadrow_NegPrim.png");
c3.SaveAs("FXT2020_ResidZ_PosPrim.png");
c4.SaveAs("FXT2020_ResidZ_NegPrim.png");

TCut goodg = "abs(mHitsG.lYFit-mHitsG.lYHit)<5&&abs(mHitsG.lZFit-mHitsG.lZHit)<5";
c1.cd();
StiPulls.Draw("mHitsG.lYFit-mHitsG.lYHit:mHitsG.lXHit:mHitsG.lZHit>>hp3(38,-190,190,14,55,195)",goodg&&"mHitsG.mCurv>0","prof zcol");
c2.cd();
StiPulls.Draw("mHitsG.lYFit-mHitsG.lYHit:mHitsG.lXHit:mHitsG.lZHit>>hn3(38,-190,190,14,55,195)",goodg&&"mHitsG.mCurv<0","prof zcol");
c3.cd();
StiPulls.Draw("mHitsG.lZFit-mHitsG.lZHit:mHitsG.lXHit:mHitsG.lZHit>>hpz3(38,-190,190,14,55,195)",goodg&&"mHitsG.mCurv>0","prof zcol");
c4.cd();
StiPulls.Draw("mHitsG.lZFit-mHitsG.lZHit:mHitsG.lXHit:mHitsG.lZHit>>hnz3(38,-190,190,14,55,195)",goodg&&"mHitsG.mCurv<0","prof zcol");

hn3.SetMinimum(-0.015);
hn3.SetMaximum(0.015);
hp3.SetMinimum(-0.015);
hp3.SetMaximum(0.015);
hpz3.SetMaximum(0.06);
hpz3.SetMinimum(-0.06);
hnz3.SetMaximum(0.06);
hnz3.SetMinimum(-0.06);
hp3.SetTitle("Resid along padrow [cm] pos glob trks;z [cm];r [cm]");
hn3.SetTitle("Resid along padrow [cm] neg glob trks;z [cm];r [cm]");
hpz3.SetTitle("Resid in z [cm] pos glob trks;z [cm];r [cm]");
hnz3.SetTitle("Resid in z [cm] neg glob trks;z [cm];r [cm]");
c1.Draw();
c2.Draw();
c3.Draw();
c4.Draw();
c1.SaveAs("FXT2020_ResidPadrow_PosGlob.png");
c2.SaveAs("FXT2020_ResidPadrow_NegGlob.png");
c3.SaveAs("FXT2020_ResidZ_PosGlob.png");
c4.SaveAs("FXT2020_ResidZ_NegGlob.png");
-Gene »
- genevb's blog
- Login or register to post comments
