- genevb's home page
- Posts
- 2025
- 2024
- 2023
- 2022
- September (1)
- 2021
- 2020
- 2019
- 2018
- 2017
- December (1)
- October (3)
- September (1)
- August (1)
- July (2)
- June (2)
- April (2)
- March (2)
- February (1)
- 2016
- November (2)
- September (1)
- August (2)
- July (1)
- June (2)
- May (2)
- April (1)
- March (5)
- February (2)
- January (1)
- 2015
- December (1)
- October (1)
- September (2)
- June (1)
- May (2)
- April (2)
- March (3)
- February (1)
- January (3)
- 2014
- 2013
- 2012
- 2011
- January (3)
- 2010
- February (4)
- 2009
- 2008
- 2005
- October (1)
- My blog
- Post new blog entry
- All blogs
h-/h+ in Run 22 pp500 with new TPC alignment
Updated on Mon, 2024-12-02 11:12. Originally created by genevb on 2024-12-02 11:09.
There is considerable interest in understanding whether the Run 22 pp500 production should proceed making use of the prior (older) TPC alignment or the new, as the latter has introduced significant slowing of track reconstruction by a factor of approximately x2 (and consequently a whole-chain slow down by ~x1.5). In an effort to see the impacts of choosing between the alignments, I have attempted to look at the h-/h+ ratio with these two alignments in the Run 22 pp500 data here.
One notable point: While I have used the TPC SpaceCharge calibration that was a result of using the older TPC alignment, SpaceCharge effects are anyhow cancelled out in these double ratios, which only serve to show sector-to-sector variations, hiding anything wrong for the TPC as a whole.
I should also point out that I have already looked at h-/h+ in Run 19 19.6 GeV with new TPC alignment.
Here are the 24 sectors' double ratios (h-/h+ per sector divided by the h-/h+ from all sectors) versus pT for globals (red) and primaries (blue). This first plot is for the older alignment:

And here are the same with the new TPC alignment (reconstructed using the same input data):

Here are my observations on the above plots:
And although the poor high-pT exponential fits imply it isn't worth trying to extract additional understanding from the results of the fits, these are the fit parameters for the older (left) and new (right) TPC alignments:


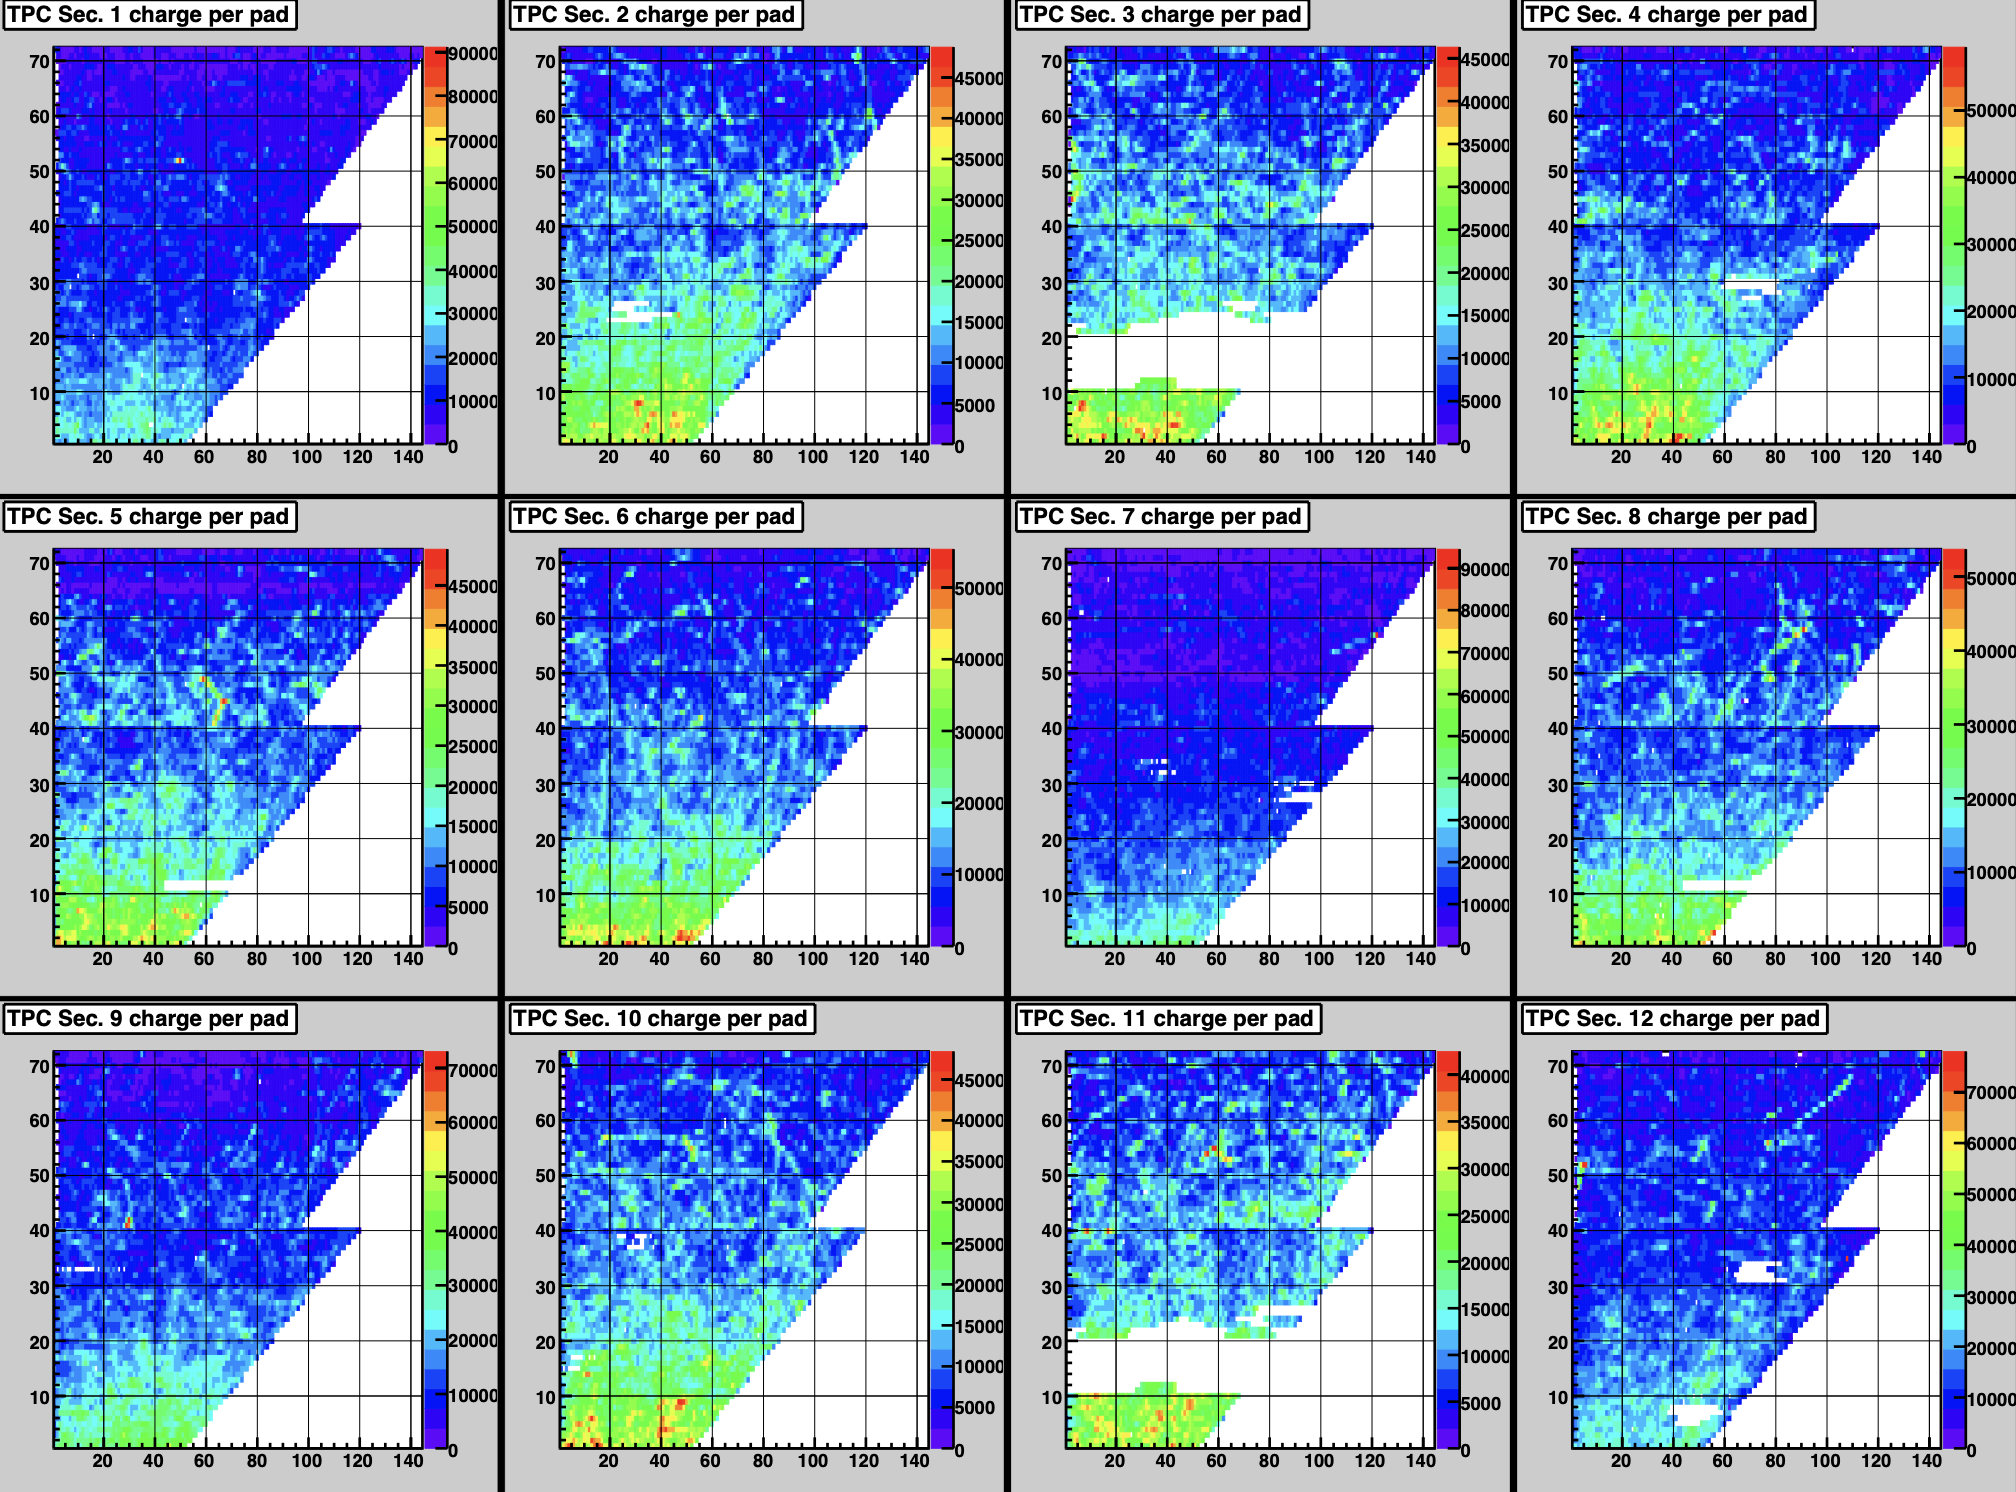
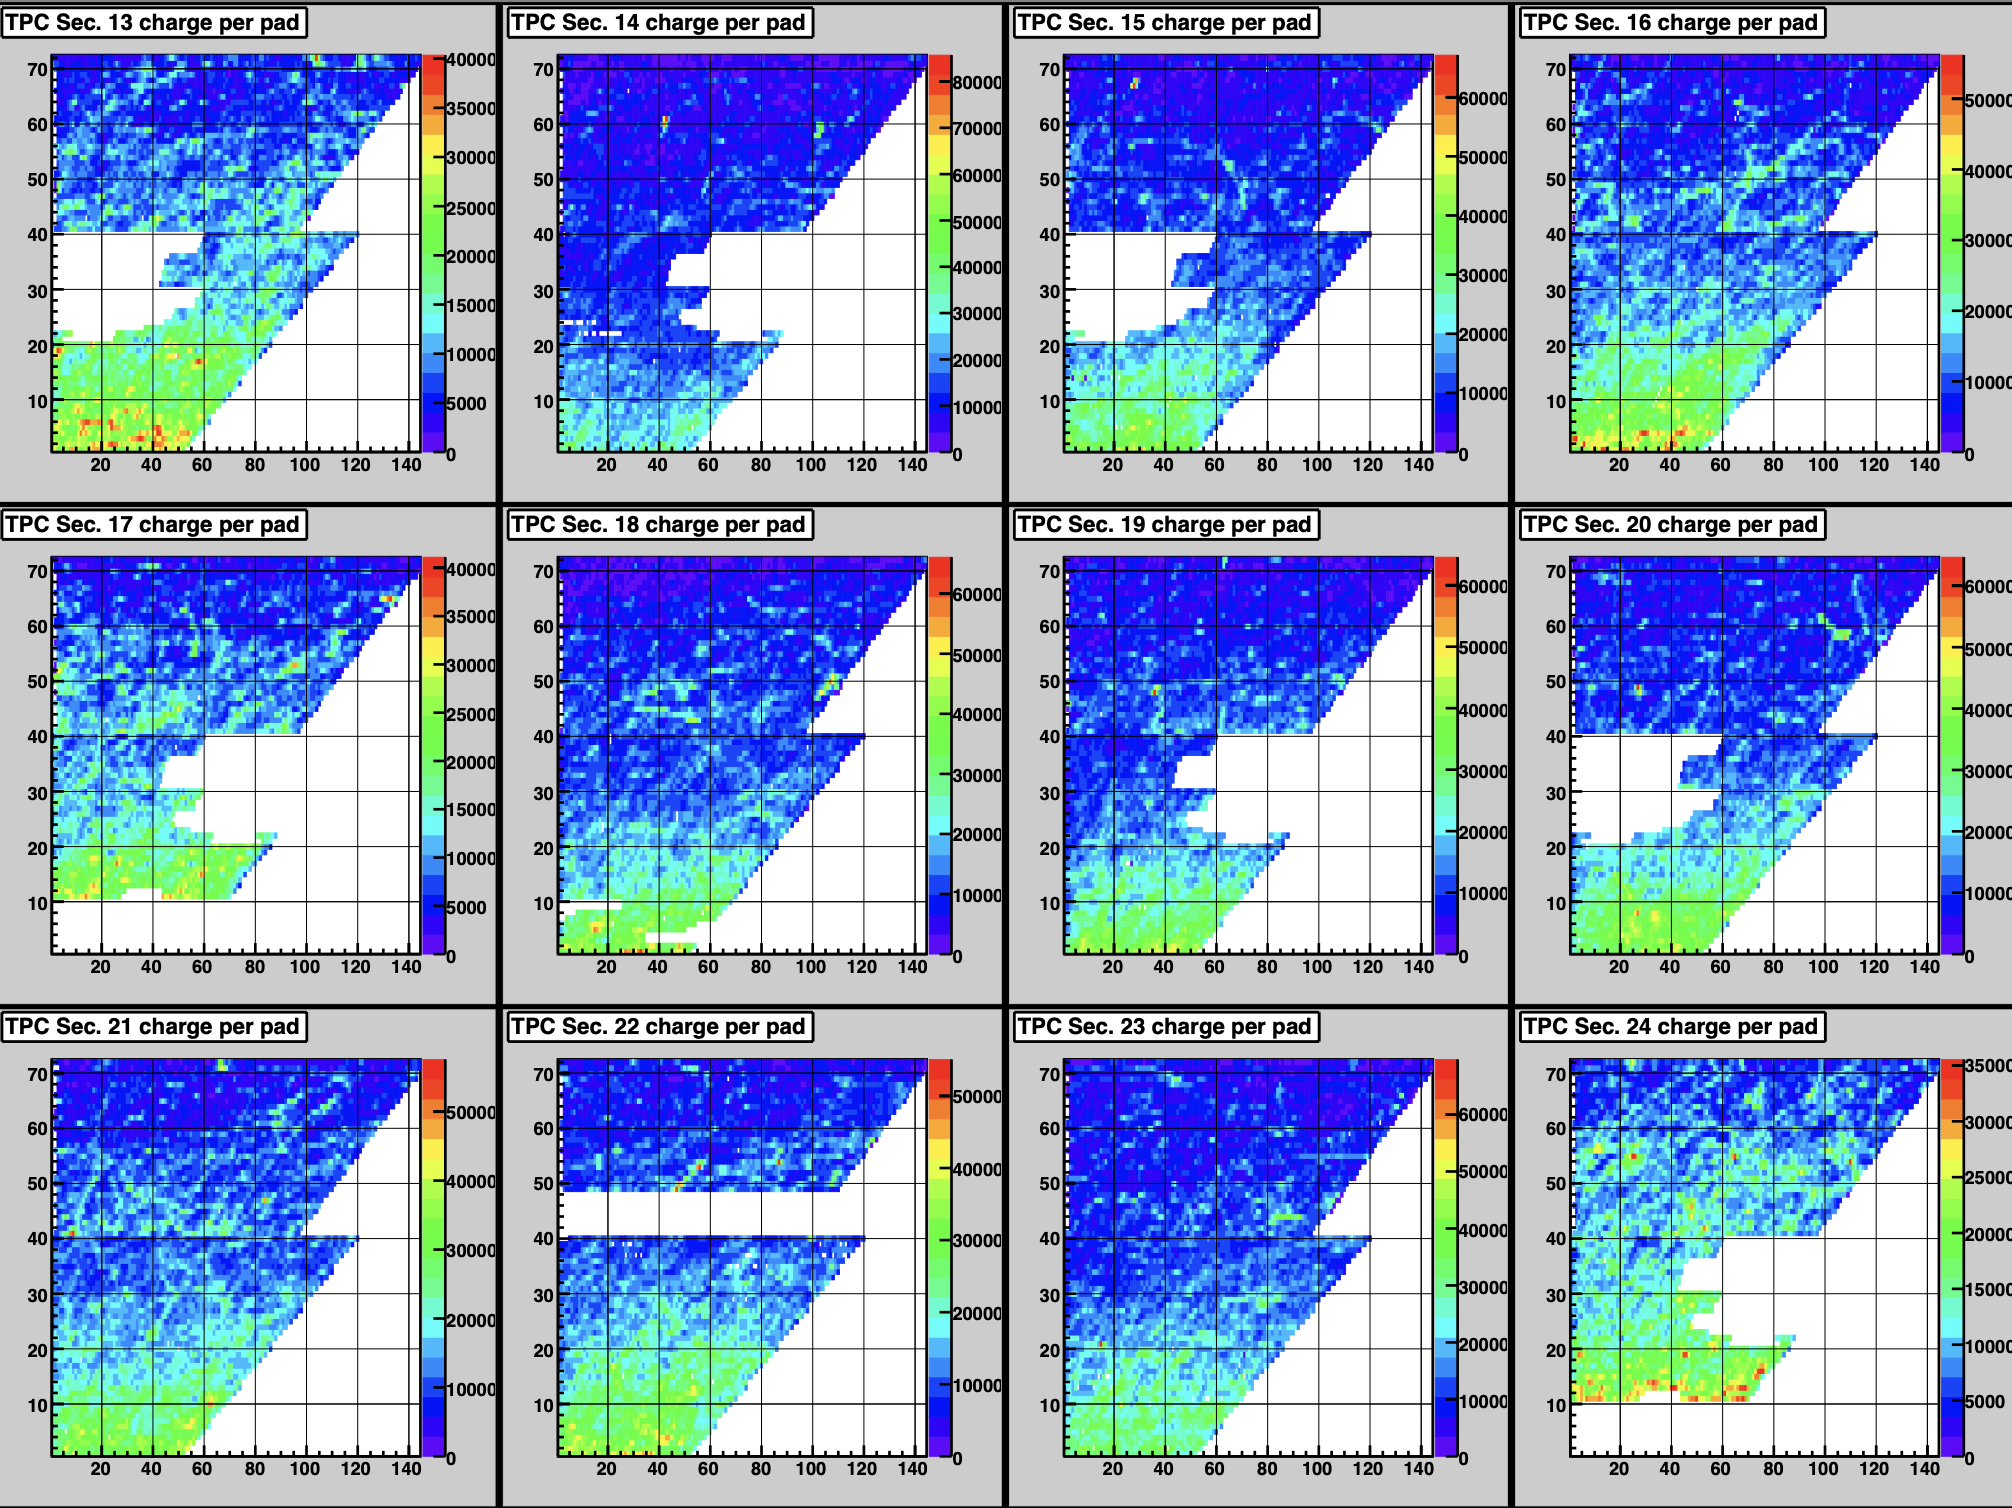
Below are the TPC sector status plots from the online QA that I mentioned earlier. Note that there are outages in sectors 3, 11, and 22 that do not affect the low-pT reconstructed h-/h+ ratios, because these outages are symmetric across the individual sector, not on just one side or the other.


Thanks,
-Gene
One notable point: While I have used the TPC SpaceCharge calibration that was a result of using the older TPC alignment, SpaceCharge effects are anyhow cancelled out in these double ratios, which only serve to show sector-to-sector variations, hiding anything wrong for the TPC as a whole.
I should also point out that I have already looked at h-/h+ in Run 19 19.6 GeV with new TPC alignment.
Here are the 24 sectors' double ratios (h-/h+ per sector divided by the h-/h+ from all sectors) versus pT for globals (red) and primaries (blue). This first plot is for the older alignment:

And here are the same with the new TPC alignment (reconstructed using the same input data):

Here are my observations on the above plots:
- There is almost no difference in these plots between the two alignments
- Both alignments show ratios close to 1.0 for pT > ~1.3 GeV/c
- The low pT artifacts in both cases clearly correlate with dead regions on one side (e.g. sectors 13, 15, 18, 20) or the other (sectors 14, 17, 19, 24), as can be seen in the plots at the bottom of this post from the online QA during Run 22
- The fits aren't so good for either alignment
And although the poor high-pT exponential fits imply it isn't worth trying to extract additional understanding from the results of the fits, these are the fit parameters for the older (left) and new (right) TPC alignments:


Below are the TPC sector status plots from the online QA that I mentioned earlier. Note that there are outages in sectors 3, 11, and 22 that do not affect the low-pT reconstructed h-/h+ ratios, because these outages are symmetric across the individual sector, not on just one side or the other.


Thanks,
-Gene
»
- genevb's blog
- Login or register to post comments
