- genevb's home page
- Posts
- 2025
- 2024
- 2023
- 2022
- September (1)
- 2021
- 2020
- 2019
- 2018
- 2017
- December (1)
- October (3)
- September (1)
- August (1)
- July (2)
- June (2)
- April (2)
- March (2)
- February (1)
- 2016
- November (2)
- September (1)
- August (2)
- July (1)
- June (2)
- May (2)
- April (1)
- March (5)
- February (2)
- January (1)
- 2015
- December (1)
- October (1)
- September (2)
- June (1)
- May (2)
- April (2)
- March (3)
- February (1)
- January (3)
- 2014
- 2013
- 2012
- 2011
- January (3)
- 2010
- February (4)
- 2009
- 2008
- 2005
- October (1)
- My blog
- Post new blog entry
- All blogs
Issues with Run 19 drift velocities
Updated on Fri, 2020-07-24 15:01. Originally created by genevb on 2020-07-24 11:13.
A few people doing QA on the Run 19 19.6 GeV large calibration dataset have found that a few days showed particularly poor performance. See, for example, Ben Kimelman's slides from a TPC meeting: You do not have access to view this node
I have found some correlation of poor performance with large excursions in active TPC drift velocities.
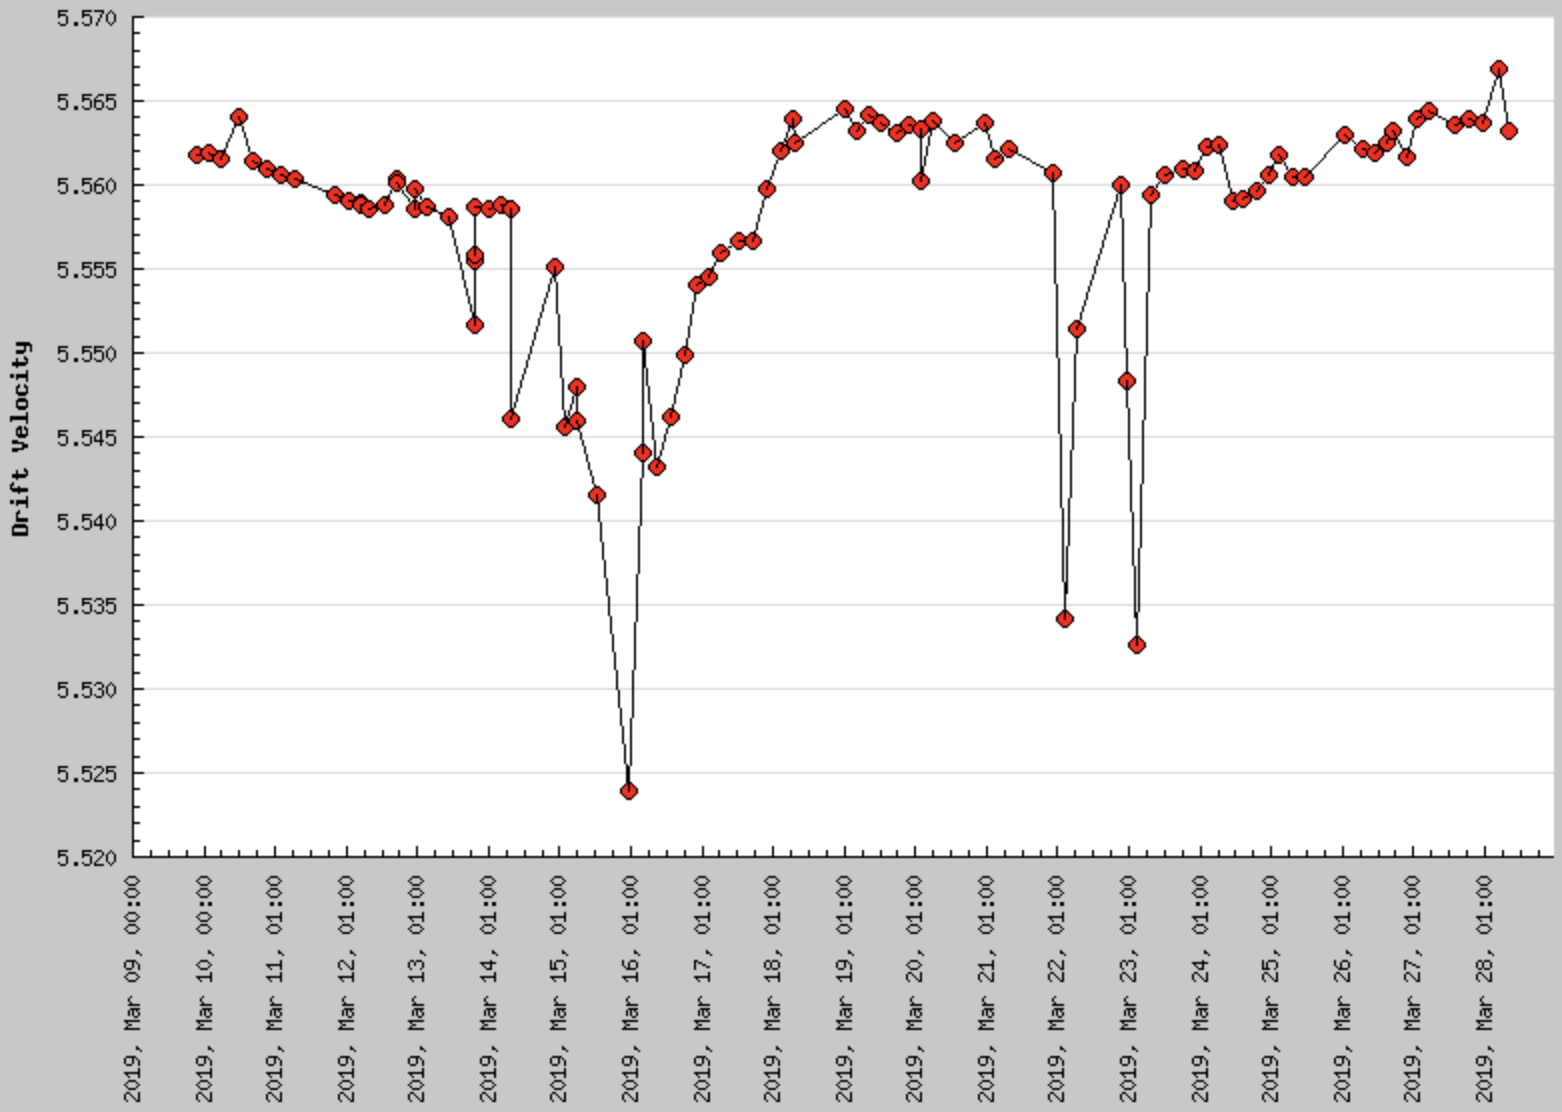
Of note, day 74 in Run 19 corresponds to March 15, 2019. One can figure out the other days vs. dates from there. Ben noted particular issues within this date range on days 74 through the first half of 75, as well as on days 81 and 82.
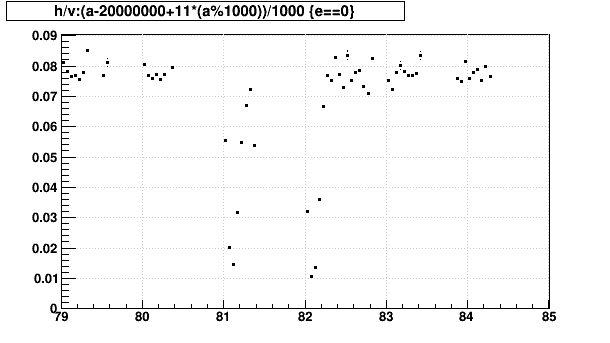
Here are the used drift velocities vs run day (I've crudely expanded the run numbers within each day to spread them out a bit to show time dependence with each day) in the data provided from the calibration production:
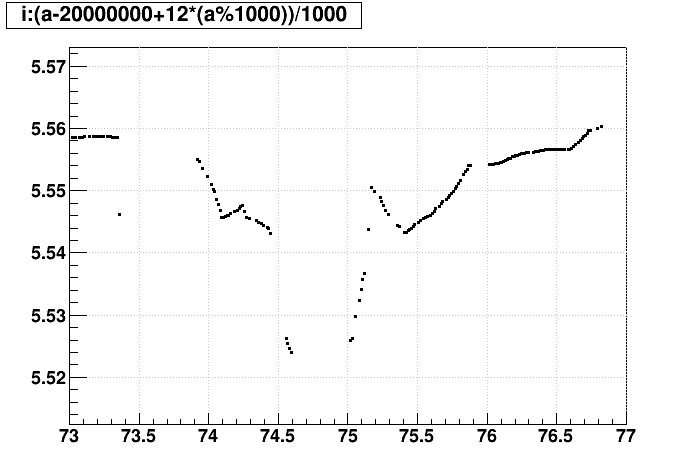
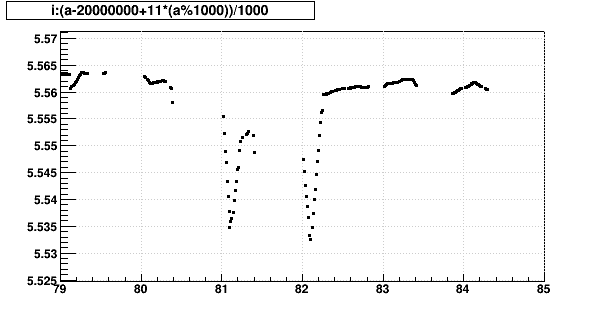
I would like to note in particular that in addition to the largest excursion drift velocity values, which are almost certainly incorrect, there are smaller excursions that we would like to know are OK or not. For example, the largest excursion affects data between run days 74.5 and 75.2 on my plots, but there are smaller excursions around 73.9 to 74.5 and then 75.2 to 75.9. We should keep an eye out for issues there as well, particularly since Ben's QA shows issues for pretty much all runs on day 74.
To get some comparison to what's happening in the data, I also extracted vertex information from the log files. Here, using the same run day scheme for the x-axis, I show several variables, starting with the mean multiplicity of the highest ranked vertex:
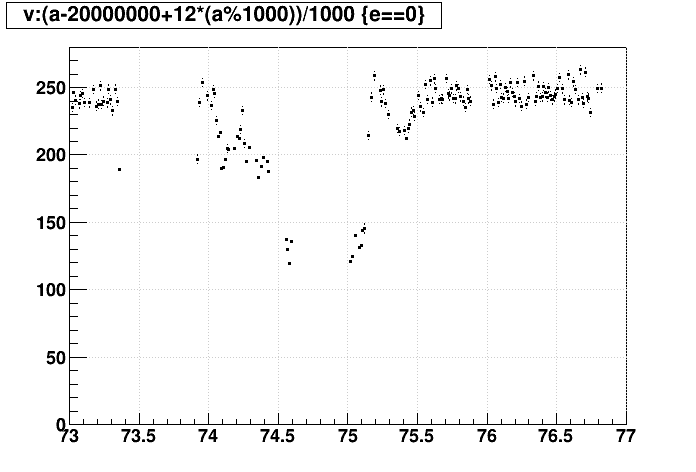
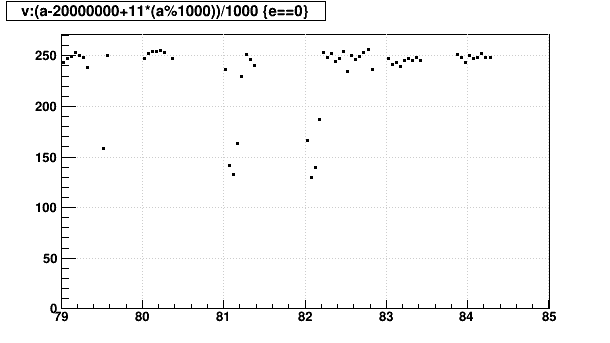
These deviations do show large differences from the norm that correspond with the large drift velocity excursions, but, importantly, also smaller differences that correspond with the smaller drift velocity excursions. This seems to point to many drift velocity records in the database being problematic, not just the large excursions. Similar conclusions can be drawn from further information about the vertices...
Next is the mean multiplicity of the second highest ranked vertex:
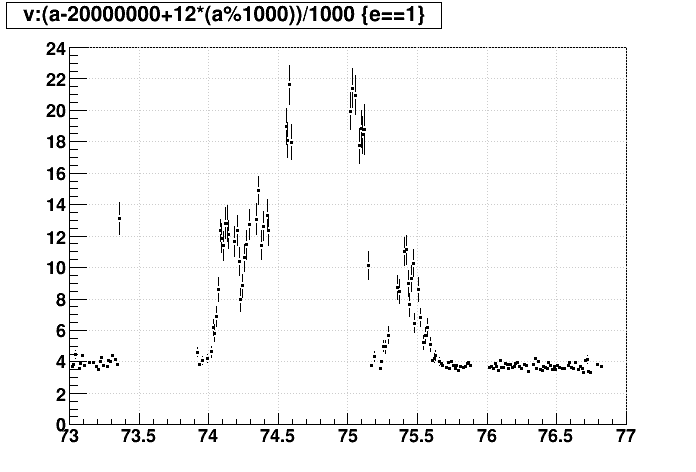
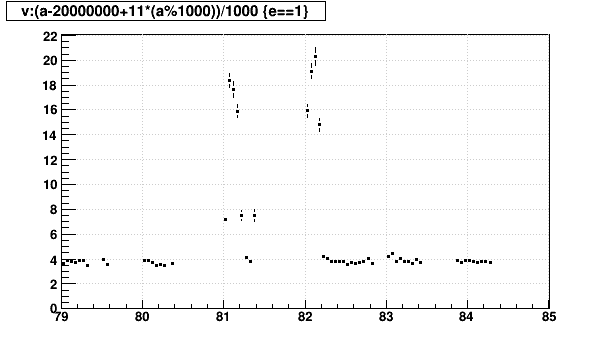
Next is the fraction of primary tracks that cross the central membrane:
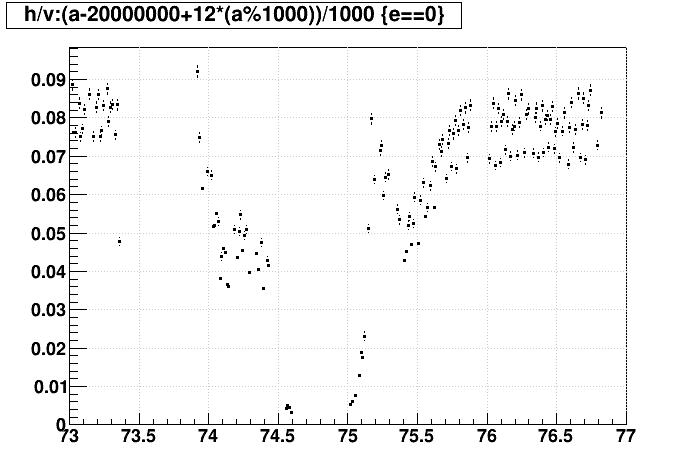
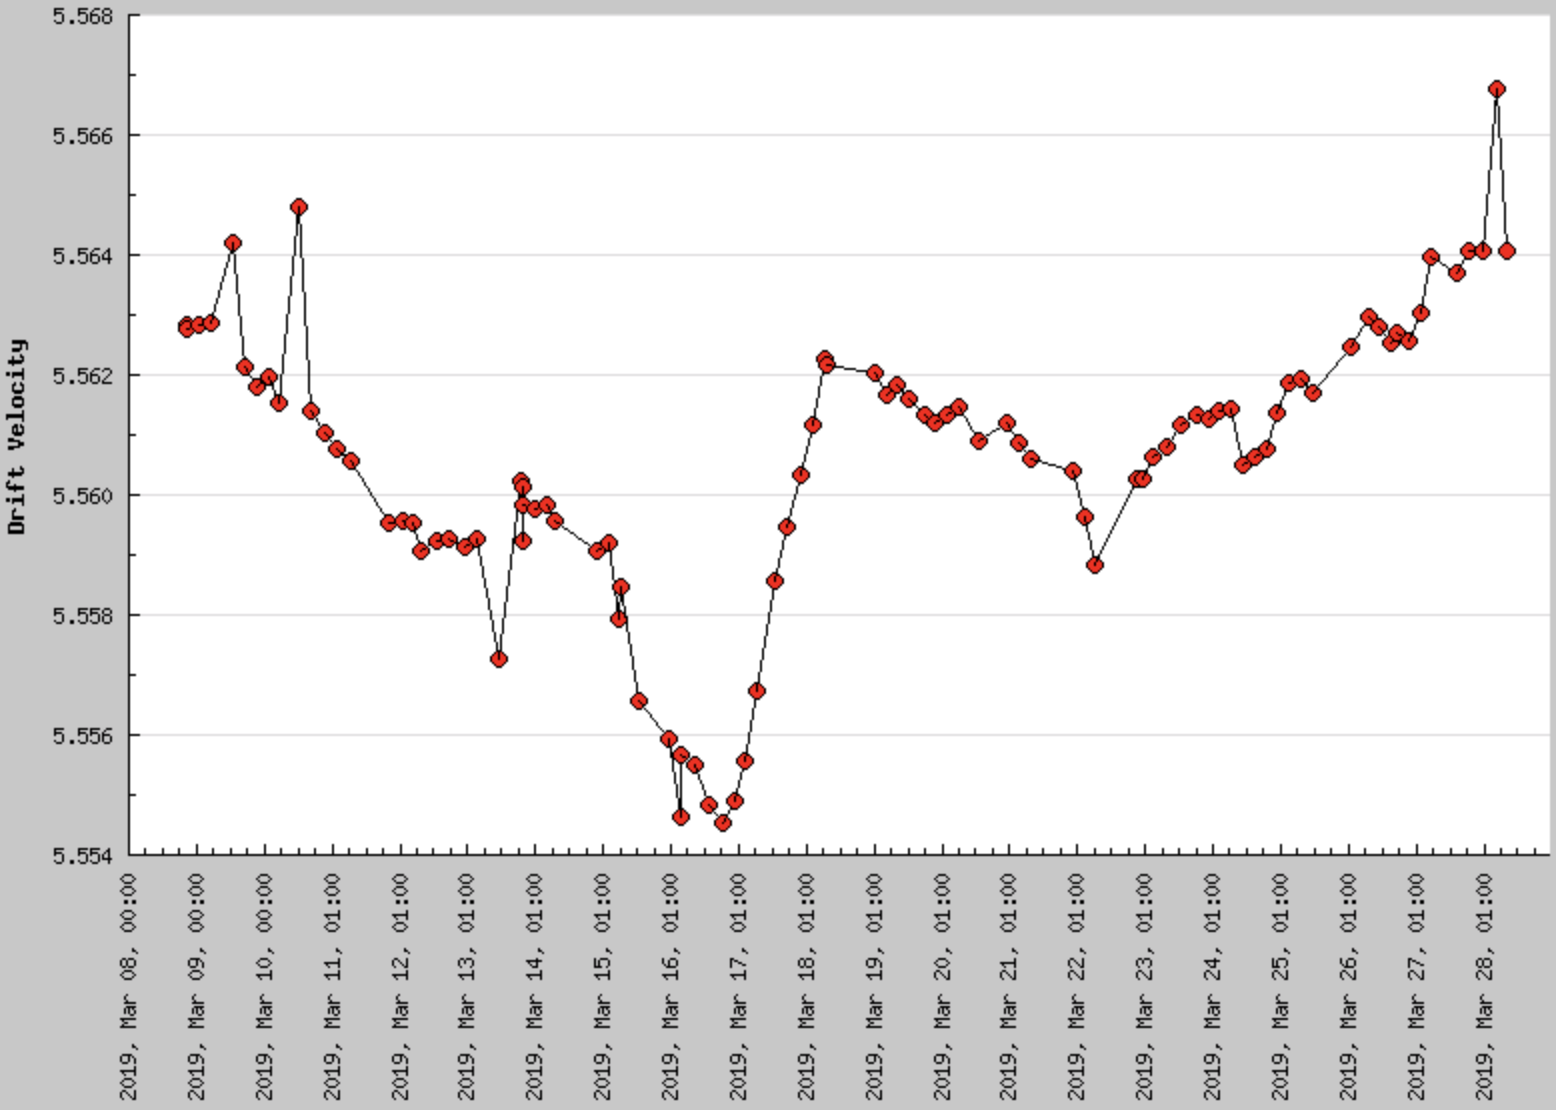
Having convinced Yuri that these drift velocity excursions needed to be re-examined, he re-ran the calibrations of the drift velocity for Run 19. However, as seen in the new values drawn for the same time period as before, the large excursions are gone and the smaller excursions still exist, but are now much smaller than before. We will need to see whether this re-calibration is sufficient to resolve the issues.
_____
I obtained the drift velocities that were active in the database for this data before and after Yuri's recent updates, and then took the ratio of old drift velocity to new drift velocity for timestamps I was able to match up (there were a few in each that weren't in the other, and I dropped those in this comparison). Here is the ratio vs. day, showing that it has changed by as much as 0.6%, which corresponds to a ~1.2 cm displacement at the full drift length, and a splitting of tracks by twice that of ~2.4 cm (~1.2 cm on each side of z=0).
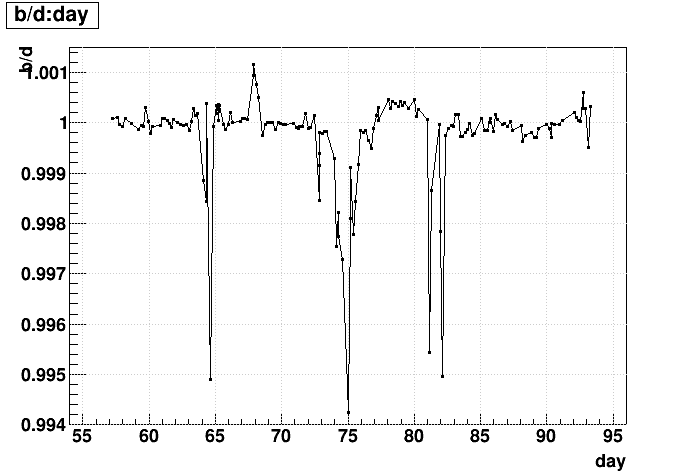
One thing I will point out from this is that the TPC SpaceCharge & GridLeak calibration included runs from days 72-76 that are among the notably impacted by this drift velocity re-calibration (and other runs that weren't so impacted). That calibration will certainly need to be re-done.
-Gene
I have found some correlation of poor performance with large excursions in active TPC drift velocities.

Of note, day 74 in Run 19 corresponds to March 15, 2019. One can figure out the other days vs. dates from there. Ben noted particular issues within this date range on days 74 through the first half of 75, as well as on days 81 and 82.
Here are the used drift velocities vs run day (I've crudely expanded the run numbers within each day to spread them out a bit to show time dependence with each day) in the data provided from the calibration production:


I would like to note in particular that in addition to the largest excursion drift velocity values, which are almost certainly incorrect, there are smaller excursions that we would like to know are OK or not. For example, the largest excursion affects data between run days 74.5 and 75.2 on my plots, but there are smaller excursions around 73.9 to 74.5 and then 75.2 to 75.9. We should keep an eye out for issues there as well, particularly since Ben's QA shows issues for pretty much all runs on day 74.
To get some comparison to what's happening in the data, I also extracted vertex information from the log files. Here, using the same run day scheme for the x-axis, I show several variables, starting with the mean multiplicity of the highest ranked vertex:


These deviations do show large differences from the norm that correspond with the large drift velocity excursions, but, importantly, also smaller differences that correspond with the smaller drift velocity excursions. This seems to point to many drift velocity records in the database being problematic, not just the large excursions. Similar conclusions can be drawn from further information about the vertices...
Next is the mean multiplicity of the second highest ranked vertex:


Next is the fraction of primary tracks that cross the central membrane:


Having convinced Yuri that these drift velocity excursions needed to be re-examined, he re-ran the calibrations of the drift velocity for Run 19. However, as seen in the new values drawn for the same time period as before, the large excursions are gone and the smaller excursions still exist, but are now much smaller than before. We will need to see whether this re-calibration is sufficient to resolve the issues.

_____
I obtained the drift velocities that were active in the database for this data before and after Yuri's recent updates, and then took the ratio of old drift velocity to new drift velocity for timestamps I was able to match up (there were a few in each that weren't in the other, and I dropped those in this comparison). Here is the ratio vs. day, showing that it has changed by as much as 0.6%, which corresponds to a ~1.2 cm displacement at the full drift length, and a splitting of tracks by twice that of ~2.4 cm (~1.2 cm on each side of z=0).

One thing I will point out from this is that the TPC SpaceCharge & GridLeak calibration included runs from days 72-76 that are among the notably impacted by this drift velocity re-calibration (and other runs that weren't so impacted). That calibration will certainly need to be re-done.
-Gene
»
- genevb's blog
- Login or register to post comments
