- genevb's home page
- Posts
- 2025
- 2024
- 2023
- 2022
- September (1)
- 2021
- 2020
- 2019
- December (1)
- October (4)
- September (2)
- August (6)
- July (1)
- June (2)
- May (4)
- April (2)
- March (3)
- February (3)
- 2018
- 2017
- December (1)
- October (3)
- September (1)
- August (1)
- July (2)
- June (2)
- April (2)
- March (2)
- February (1)
- 2016
- November (2)
- September (1)
- August (2)
- July (1)
- June (2)
- May (2)
- April (1)
- March (5)
- February (2)
- January (1)
- 2015
- December (1)
- October (1)
- September (2)
- June (1)
- May (2)
- April (2)
- March (3)
- February (1)
- January (3)
- 2014
- December (2)
- October (2)
- September (2)
- August (3)
- July (2)
- June (2)
- May (2)
- April (9)
- March (2)
- February (2)
- January (1)
- 2013
- December (5)
- October (3)
- September (3)
- August (1)
- July (1)
- May (4)
- April (4)
- March (7)
- February (1)
- January (2)
- 2012
- December (2)
- November (6)
- October (2)
- September (3)
- August (7)
- July (2)
- June (1)
- May (3)
- April (1)
- March (2)
- February (1)
- 2011
- November (1)
- October (1)
- September (4)
- August (2)
- July (4)
- June (3)
- May (4)
- April (9)
- March (5)
- February (6)
- January (3)
- 2010
- December (3)
- November (6)
- October (3)
- September (1)
- August (5)
- July (1)
- June (4)
- May (1)
- April (2)
- March (2)
- February (4)
- January (2)
- 2009
- November (1)
- October (2)
- September (6)
- August (4)
- July (4)
- June (3)
- May (5)
- April (5)
- March (3)
- February (1)
- 2008
- 2005
- October (1)
- My blog
- Post new blog entry
- All blogs
Production time difference with pile-up protection
Updated on Mon, 2016-01-11 01:50. Originally created by genevb on 2016-01-11 01:46.
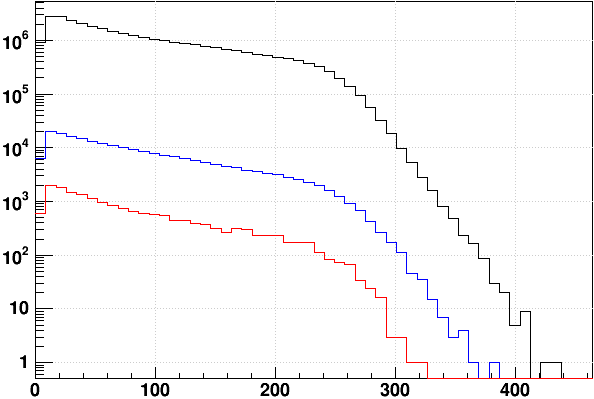
I looked at the following two triggers found in st_physics (not _adc) files in AuAu_200_production_mid_2014 runs from Run 14, days 153-167:

Histogram means:
As I used the same files to look at all the triggers, it is probably close to true that the acquisition time (e.g. day 153 vs. day 167), luminosity, and reconstruction CPU (e.g. different nodes run at different speeds) sampling of the triggers is rather similar within this study. Nevertheless, here are mean reconstruction times for the two triggers vs. luminosity, as represented by the VPD coincidence rate [Hz]. Note that the spread in luminosity is not large as these are all "mid" luminosity after all.

There are some systematics (likely not directly related to the pile-up protection) that obscure the (expected) luminosity dependence. But the 12% figure seems a reasonable description for the entire range of luminosities sampled in this study.
-Gene
- VPDMB-5-nobsmd (offline ID 450014) [blue]
- VPDMB-5-p-nobsmd [pile-up protected] (offine ID 450025) [red]
- all triggers [black]

Histogram means:
- VPDMB-5-nobsmd: 85.87 ± 0.14 CPU-sec/event
- VPDMB-5-p-nobsmd: 76.91 ± 0.48 CPU-sec/event
- all triggers: 87.49 ± 0.01 CPU-sec/event
As I used the same files to look at all the triggers, it is probably close to true that the acquisition time (e.g. day 153 vs. day 167), luminosity, and reconstruction CPU (e.g. different nodes run at different speeds) sampling of the triggers is rather similar within this study. Nevertheless, here are mean reconstruction times for the two triggers vs. luminosity, as represented by the VPD coincidence rate [Hz]. Note that the spread in luminosity is not large as these are all "mid" luminosity after all.

There are some systematics (likely not directly related to the pile-up protection) that obscure the (expected) luminosity dependence. But the 12% figure seems a reasonable description for the entire range of luminosities sampled in this study.
-Gene
»
- genevb's blog
- Login or register to post comments
