Attempt to duplicate Vladimir's Theses in 2003
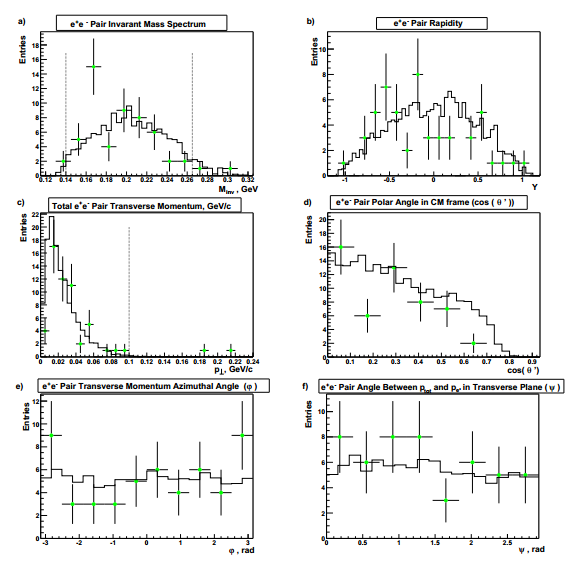
Figure 1. Plots copied from Vladimir's theses. Real data produced by cuts (Figure 2) is represented by dots and the simulation is represented by lines.
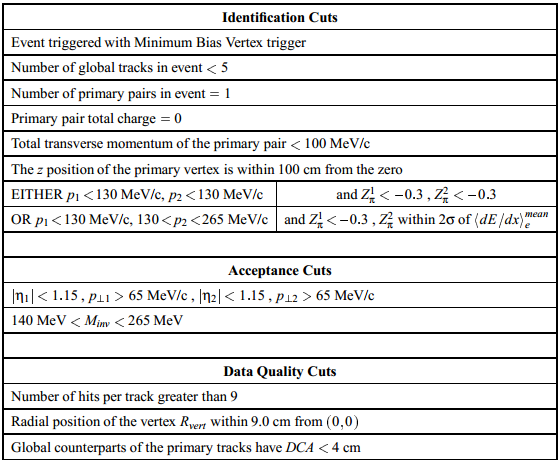
Figure 2. Cuts.
At first glance, when getting ready to replicate these cuts I had assumed that the dedxZ he was using would be for electron, however, this is not the case. He is using an outside cut for dedxZ for pion instead. Being nine years ago, it appears that the filling for this variable has been changed. It appears that there is now an absolute value cut on this cut. I still tried to replicate using pion outside .3 in general.
Cuts:
pPairs_pPt<0.15, nPrimaryTPC==2, Abs(zVertex)<100, .05<pPairs_electronH_yrap<1
tr1+tr2 momentum <0.13 and dedxZpi>0.3
or
tr1 momentum <0.13 and dedxZpi>0.3 with tr2 momentum 0.13<p<0.26 and nSigmaEl<2
WITH THESE CUTS, ONLY ONE TREE WAS USED TO SAVE TIME COMPILING.

Figure 3. Invariant Mass (GeV/c2).
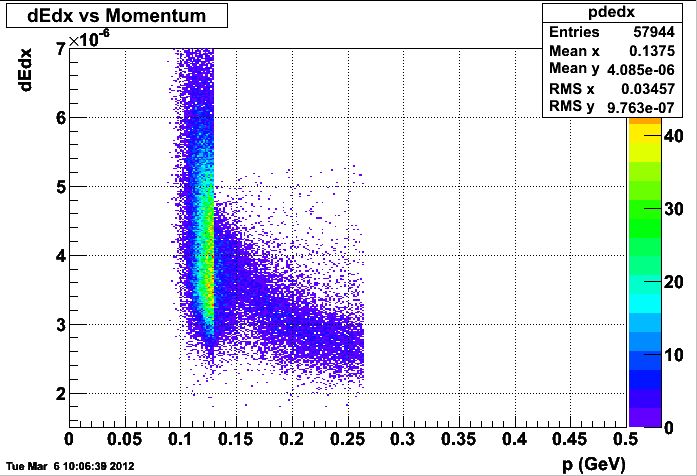
Figure 4. dE/dx vs Momentum (GeV/c).
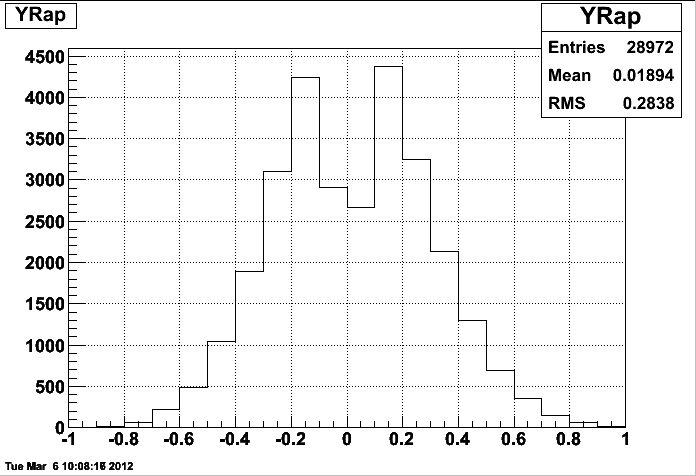
Figure 5. yRapidity.
When looking at the dE/dx vs momentum graph a second time there may have been a slight problem with my coding so I will have to run this again. Unfortunately this was just before I started to save my entire code each time I compiled it so I do not know if I actually had my nSigmaEl as nSigmaPi or not. It appears like this is possible and this could explain why the peak doesnt quite look like the simulation or his data but has a rather larger peak around .25. I don't expect to get exactly Vladimir's results or his simulations. Removing all of the pions at this point has proven very difficult which makes replicating the simulations a problem. Also, a problem found when comparing to both of these is lack of data that has the magnetic field set at .25T. Our data is all ran at 0.5T. I expect to see a cut off and, in general, less events at low mass because lower momentum events are not able to reach the TPC.
Regardless of the possible mistakes, it appears that the cut made on dedxZ is not doing everything it needs to do because there is much to broad of a range of "electrons" below a momentum of 130 MeV/c. Given that the collisions produce a majority of pions and the pion band is in the region above electron's dE/dx at momentum less than 130 MeV/c, we can assume these cuts allow a good amount of pions to be included.
~~~~~~~~~~~~~~~~~~~~~~~~~~~~~~~~~~~~~~~~~~~~~~~~~~~~~~~~~~~~~~~~~~~~~~~~~~~~~~~~~~~~~~~~~~~~~~~~~~~~~~~~~~
~~~~~~~~~~~~~~~~~~~~~~~~~~~~~~~~~~~~~~~~~~~~~~~~~~~~~~~~~~~~~~~~~~~~~~~~~~~~~~~~~~~~~~~~~~~~~~~~~~~~~~~~~~
A second try I again could have the same problem with nSigmaEl and nSigmaPi being exchanged in the second track of momentums between .13 and .26 but these are the cuts made and the results anyway.
Cuts:
pPairs_pPt<0.15, nPrimaryTPC==2, Abs(zVertex)<100, .05<pPairs_electronH_yrap<1
tr1+tr2 momentum <0.13 and nSigmaEl<1
or
tr1 momentum <0.13 and nSigmaEl<1 with tr2 momentum 0.13<p<0.26 and nSigmaEl<1
This should be the last set of cuts that the exact cuts come into question. They will be remade and checked where necessary or significant.
.png)
Figure 6. Invariant Mass (GeV/c2).

Figure 7. dE/dx vs Momentum.
.png)
Figure 8. yRapidity.
When looking at the second group of graphs compared to the first group, it appears that not much has changed other than the number of events. Of course the dE/dx vs momentum graph is significantly different, it appears the rapidity and invariant mass are essentially the same. When looking at the dE/dx vs momentum from each group it appears that the correct cuts were made. This is based on the pions not being centralized but on the lower half of the accepted region. This just shows the amount of contamination rather than a improper cut.
~~~~~~~~~~~~~~~~~~~~~~~~~~~~~~~~~~~~~~~~~~~~~~~~~~~~~~~~~~~~~~~~~~~~~~~~~~~~~~~~~~~~~~~~~~~~~~~~~~~~~~~~~~
~~~~~~~~~~~~~~~~~~~~~~~~~~~~~~~~~~~~~~~~~~~~~~~~~~~~~~~~~~~~~~~~~~~~~~~~~~~~~~~~~~~~~~~~~~~~~~~~~~~~~~~~~~
Replication of the two above groups of cuts are shown below in order. The number of bins has been altered but the problem with the nSigma has been fixed. It appears that the cuts were done correctly other than the nSigma electron cut was done without an absolute value. This means that more pions were included. I say more pions because by looking at both dE/dx vs momentum graphs below it is obvious that the pion band is still present and therefore pion+ pion- were still included in the invariant mass and rapidity plots (with the electron's mass assumed instead of the mass of a pion).
Cuts:
pPairs_pPt<0.15, nPrimaryTPC==2, Abs(zVertex)<100, .05<Abs(pPairs.electronH.yrap)<1
tr1+tr2 momentum <0.13 and dedxZpi>0.3
or
tr1 momentum <0.13 and dedxZpi>0.3 with tr2 momentum 0.13<p<0.26 and Abs(nSigmaEl)<2
.png)
Figure 9. Invariant Mass.
.png)
Figure 10. dE/dx vs Momentum.
.png)
Figure 11. yRapidity.
Cuts:
pPairs_pPt<0.15, nPrimaryTPC==2, Abs(zVertex)<100, .05<Abs(pPairs.electronH.yrap)<1
tr1+tr2 momentum <0.13 and Abs(nSigmaEl)<1
or
tr1 momentum <0.13 and Abs(nSigmaEl)<1 with tr2 momentum 0.13<p<0.26 and Abs(nSigmaEl)<1
.png)
Figure 12. Invariant Mass.
.png)
Figure 13. dE/dx vs momentum.
.png)
Figure 14. yRapidity.
- jkb03669's blog
- Login or register to post comments