Using the TOF to Complete PID with TPC
Macro used /star/u/jkb03669/PID6.txt
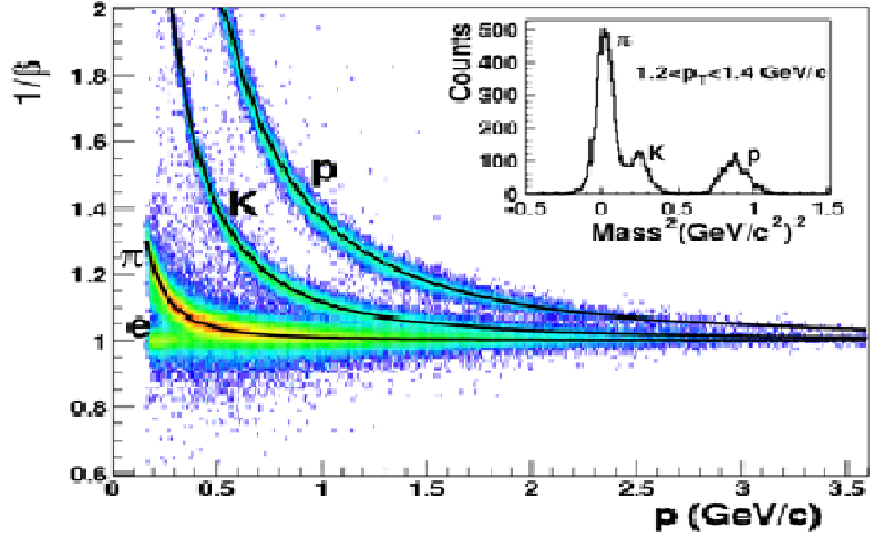
Figure 1. Ideal TOF (1/speed vs momentum) plot. (Generated by Zhangbou Xu)
.png)
Figure 2. No cuts applied. Left TOF(1/speed vs momentum). Right TPC(dE/dx vs momentum).
.png)
Figure 3. Left TOF(1/speed vs momentum). Right TPC(dE/dx vs momentum).
Cuts: At least one TPC track vertex matched to the TOF vertex.
vertices.mNTracksUsed<10
pPairs.tr1.charge != pPairs.tr2.charge
vertices.mPosition.mX3<50
0.05<pPairs.tr1(2).eta<1.5
pPairs.pPt<0.15
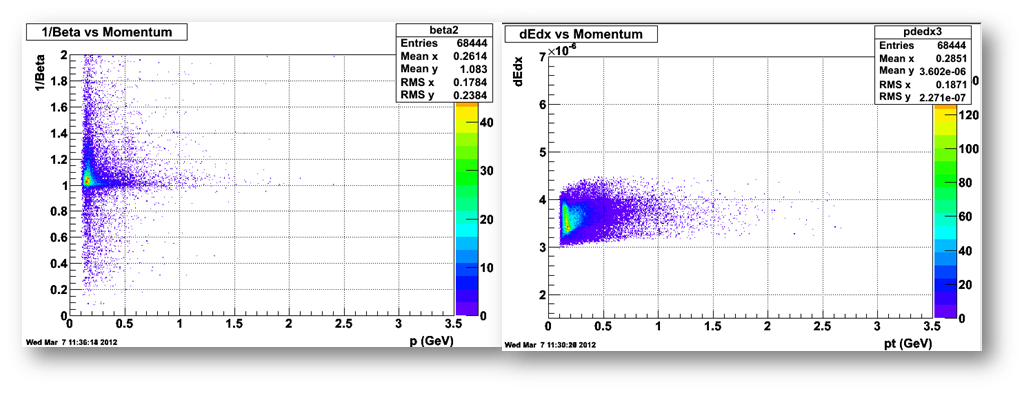
Figure 4. Assuming electron through TPC cuts alone: Left TOF(1/speed vs momentum). Right TPC(dE/dx vs momentum).
Cuts: At least one TPC track vertex matched to the TOF vertex.
vertices.mNTracksUsed<10
pPairs.tr1.charge != pPairs.tr2.charge
Abs(vertices.mPosition.mX3)<50
0.05<Abs(pPairs.tr1(2).eta)<1.5
pPairs.pPt<0.15
Abs(pPairs.tr1(2).nSigmaEl)<1
.png)
Figure 5. Assuming pion through TPC cuts alone: Left TOF(1/speed vs momentum). Right TPC(dE/dx vs momentum).
Cuts: At least one TPC track vertex matched to the TOF vertex.
vertices.mNTracksUsed<10
pPairs.tr1.charge != pPairs.tr2.charge
Abs(vertices.mPosition.mX3)<50
0.05<Abs(pPairs.tr1(2).eta)<1.5
pPairs.pPt<0.15
Abs(pPairs.tr1(2).nSigmaPi)<1
.png)
Figure 6. Assuming kaon through TPC cuts alone: Left TOF(1/speed vs momentum). Right TPC(dE/dx vs momentum).
Cuts: At least one TPC track vertex matched to the TOF vertex.
vertices.mNTracksUsed<10
pPairs.tr1.charge != pPairs.tr2.charge
Abs(vertices.mPosition.mX3)<50
0.05<Abs(pPairs.tr1(2).eta)<1.5
pPairs.pPt<0.15
Abs(pPairs.tr1(2).nSigmaK)<1
.png)
Figure 7. Assuming proton through TPC cuts alone: Left TOF(1/speed vs momentum). Right TPC(dE/dx vs momentum).
Cuts: At least one TPC track vertex matched to the TOF vertex.
vertices.mNTracksUsed<10
pPairs.tr1.charge != pPairs.tr2.charge
Abs(vertices.mPosition.mX3)<50
0.05<Abs(pPairs.tr1(2).eta)<1.5
pPairs.pPt<0.15
Abs(pPairs.tr1(2).nSigmaP)<1
Problem was discovered with my coding for matching the momentum and the 1/speed data points. Essentially, the plots were generated by random designation between the two variables in all but Figure 1 (not mine). Probability created some of the ordered bands observed while the random designation created the distortion. This explains why in Figures 4-7 the TOF represents many more particles outside of their expected regions than we expect. We expect some contamination of other particles (hence why the TOF is necessary for a cleaner PID) but much more is observed in unexpected regions than there should be.
- jkb03669's blog
- Login or register to post comments