FMS Run 15 Analysis: BBC vertex calibration
Updated on Thu, 2016-03-17 10:07. Originally created by oleg on 2016-03-17 10:06.
(A)
Vertex reconstruction: correlation of TPC tracks and BBC time
- only using highest ranked primary vertex
- distributions clearly not very Gaussian
- tried different fits (slices for fixed z_TPC, rotated elliptical Gaussian)
Difference in slope
- from TAC hardware, slope should be -0.3
- fit result for central region (white) is roughly -0.5
- fit result from ellipse is shallower (from the tails at z_TPC=0 )
- fit result for large TAC region (gray) has the correct slope but misses the peak
Peak position
- how reliable is the peak when the distributions are not Gaussian?
- for the correlation, only JP triggers are used
- shape for all triggers (red curve in bottom right plot, no primary track required) looks different
.gif)
(B)
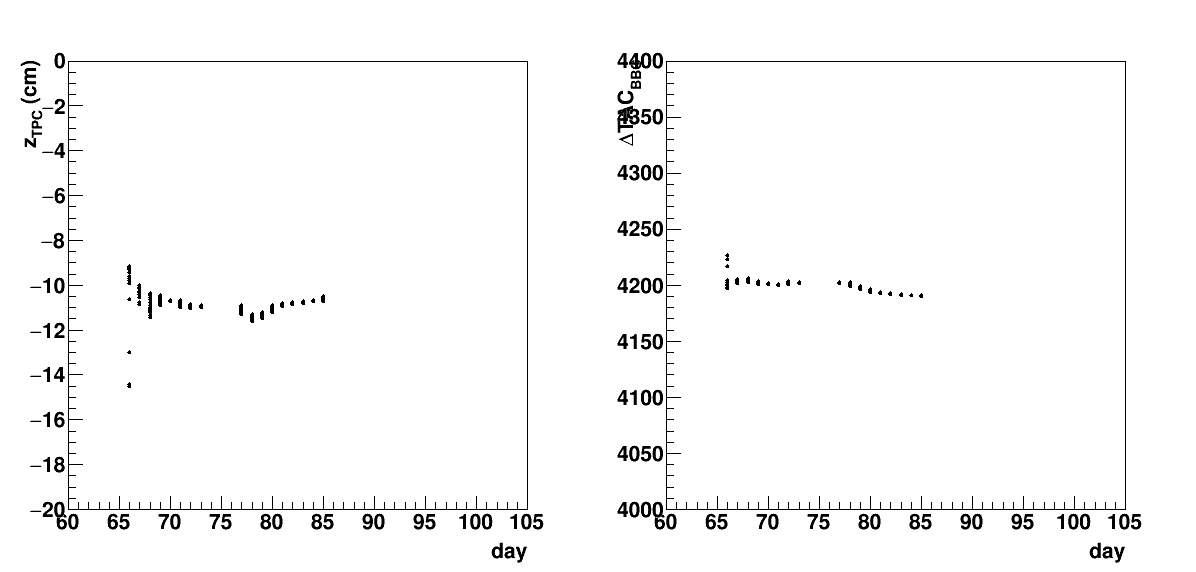
Vertex QA
- run-by-run stability of peak positions
- using mean of available range due to non-Gaussian shape
- outliers may be low statistics
- generally stable with correlated trends in days 80+

(A)
Vertex reconstruction: correlation of TPC tracks and BBC time
- only using highest ranked primary vertex
- distributions clearly not very Gaussian
- tried different fits (slices for fixed z_TPC, rotated elliptical Gaussian)
Difference in slope
- from TAC hardware, slope should be -0.3
- fit result for central region (white) is roughly -0.5
- fit result from ellipse is shallower (from the tails at z_TPC=0 )
- fit result for large TAC region (gray) has the correct slope but misses the peak
Peak position
- how reliable is the peak when the distributions are not Gaussian?
- for the correlation, only JP triggers are used
- shape for all triggers (red curve in bottom right plot, no primary track required) looks different
.gif)
(B)
Vertex QA
- run-by-run stability of peak positions
- using mean of available range due to non-Gaussian shape
- outliers may be low statistics
- generally stable with correlated trends in days 80+

»
- oleg's blog
- Login or register to post comments
