BDT numbers for different pT thresholds
BDT numbers for different pT thresholds
I have obtained these numbers for three different pT thresholds i.e 5 GeV, 6 GeV and 7 GeV.
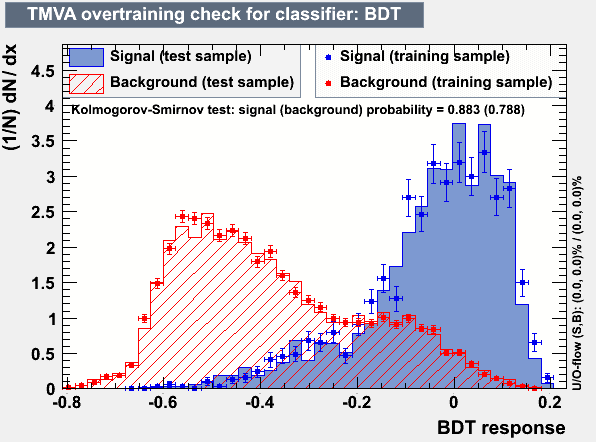
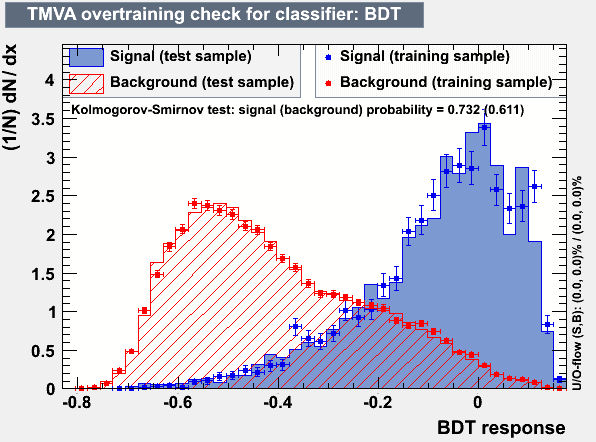
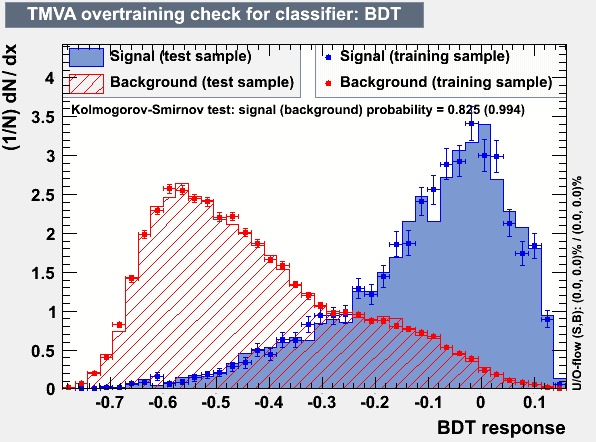
(I) Overtraining Check Plots
(a) pT > 7 GeV (b) pT > 6 GeV
(c) pT > 5 GeV
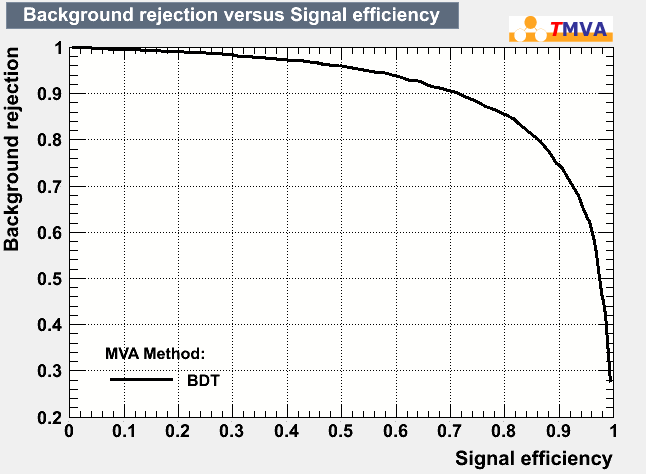
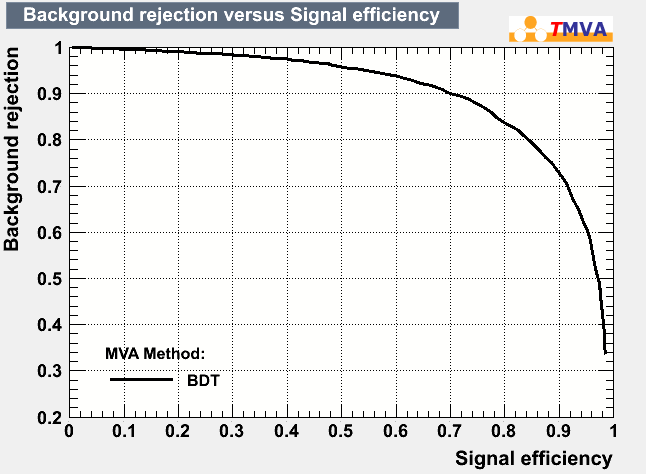
II) Background rejection vs signal efficiency plots
(a) pT > 7 GeV (b) pT > 6 GeV
(c) pT > 5 GeV

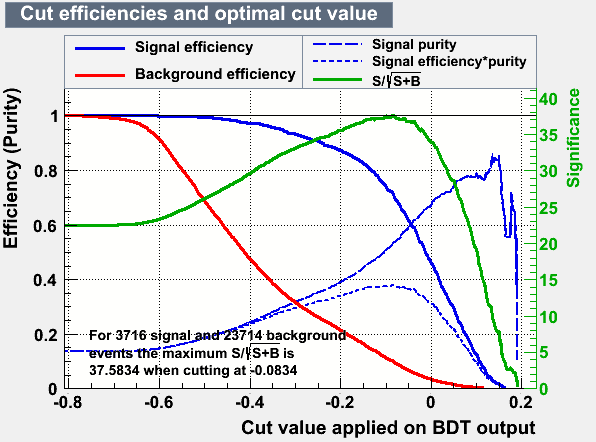
(III) Efficiency plots
(a) pT > 7 GeV (b) pT > 6 GeV
.png)
(c) pT > 5 GeV
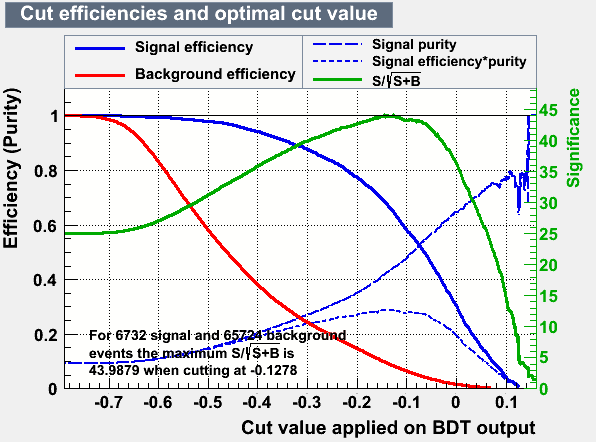
Table I
| pT | #signal, #background | Optimal-cut | S/sqrt(S+B) | Nsig | Nbkg | EffSig | Effbkg |
| >7 GeV | 3716, 23714 | -0.083 | 37.58 | 2647 | 2313 | 0.712 | 0.098 |
|
>6 GeV |
5538, 47116 | -0.120 | 42.31 | 3760 | 4136 | 0.679 | 0.088 |
| > 5GeV | 6732, 65724 | -0.128 | 43.99 | 4375 | 5516 | 0.65 | 0.084 |
Table 2 : BDT Setup
| pT | NTrees | MaxDepth | AdaBoostBeta | nCuts | |
| >7 GeV | 120 | 1 | 0.70 | 50 | |
| >6 GeV | 120 | 1 | 0.71 | 50 | |
| >5 GeV | 120 | 1 | 0.70 | 50 | |
Groups:
- sdhamija's blog
- Login or register to post comments