2008.05.15 Vertex z distribution for pp2006 data, MC gamma-jet and QCD jets events
Ilya Selyuzhenkov May 15, 2008
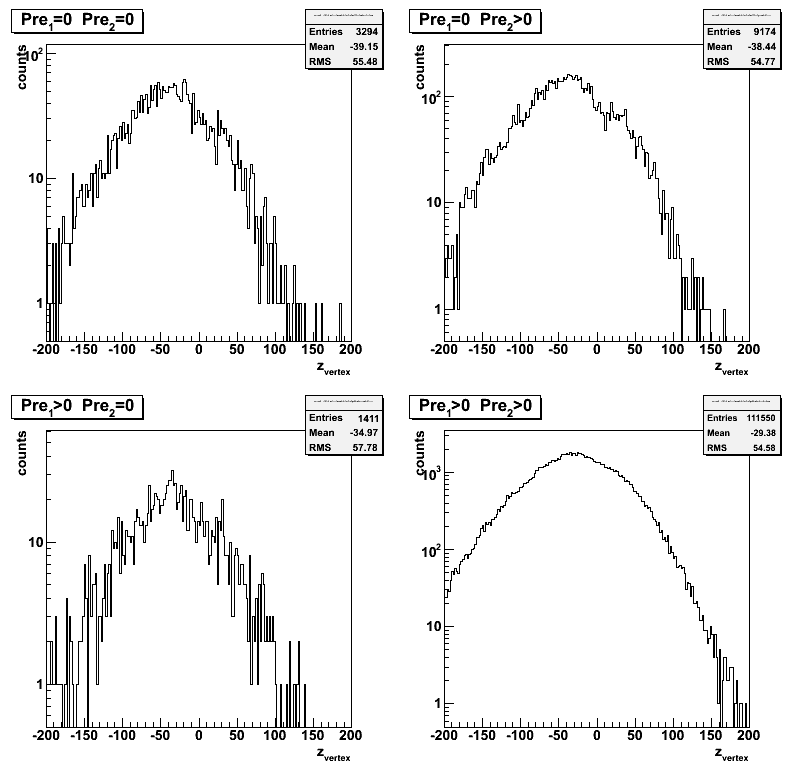
Figure 1:Vertex z distribution for pp2006 (long) data [eemc-http-mb-l2gamma:137641 trigger]
Note: In the upper right plot (pre1=0, pre2>0) one can see
a hole in the acceptance in the range bweeeen z_vertex -10 to 30 cm (probably due to SVT construction)

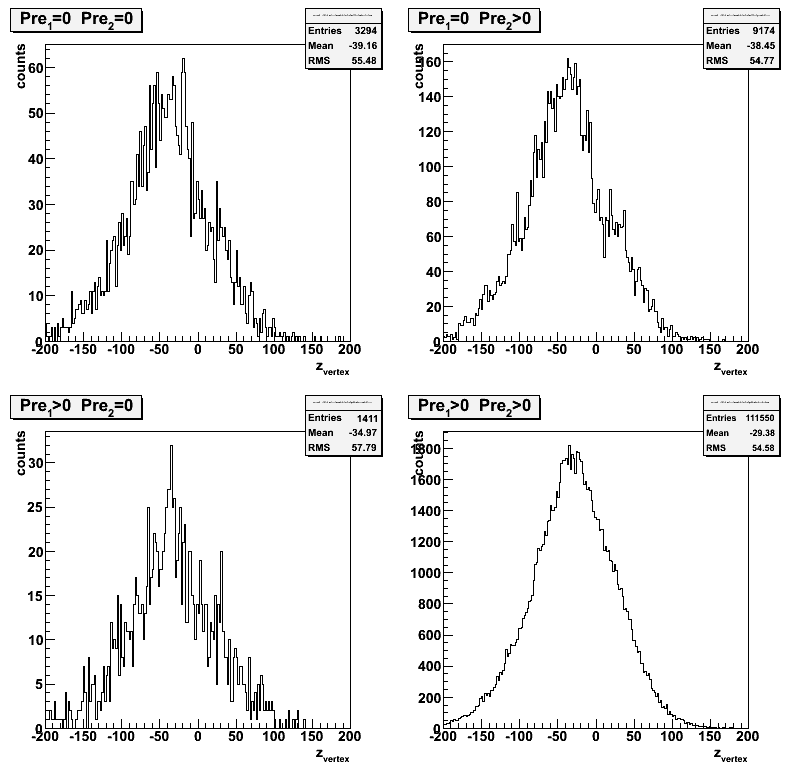
Figure 1b:Vertex z distribution for pp2006 (same as Fig. 1, but on a linear scale)

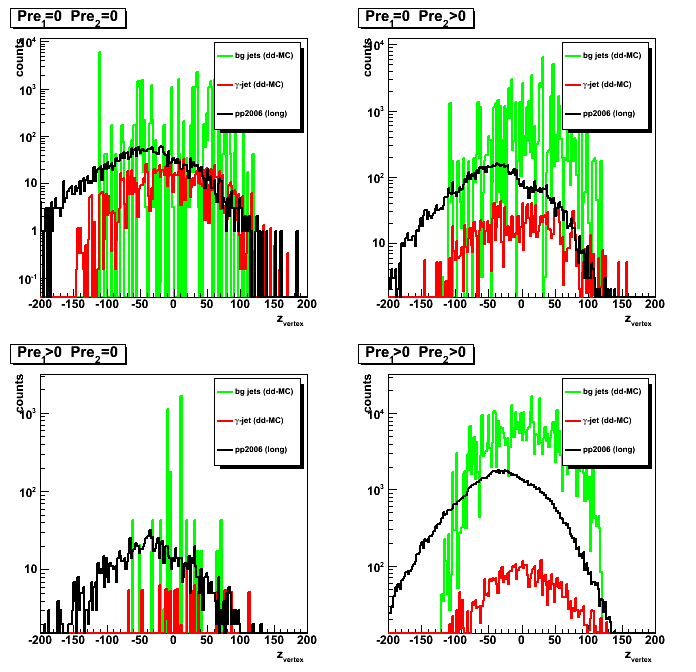
Figure 2:Vertex z distribution for three different data samples
MC results scaled to the same luminosity as data

Figure 3:Vertex z distribution for three different data samples
pt cut of 7 GeV for gamma and 5GeV for the away side jet has been applied.
