Vertex finders
This section relates to vertex finder algorithm in STAR and some model / approach and evaluation results. Vertex finder studies have been historically part of PWG activities under lose technical guidance from S&C, providing framework and a generic approach to include / add more algorithm as our understanding gwo with time.
Performance of ppLMV- historic note from 2001, by Jan
References for vertex finder review:
Event Reconstruction Techniques in NOvA (CHEP 2015)
http://indico.cern.ch/event/304944/session/2/contribution/277/attachments/578475/796605/chep_reconstruction_2015.pdf
Vertex finding by sparse model-based clustering (ACAT 2016)
https://indico.cern.ch/event/397113/session/22/contribution/209/attachments/1215150/1774584/ACAT2016_RF.pdf
Vertex Reconstruction in the ATLAS Experiment at the LHC
http://cds.cern.ch/record/1176154/files/ATL-INDET-PUB-2009-001.pdf
Efficiency of Primary Vertex Reconstruction ATLAS
http://www.phy.bnl.gov/~partsem/fy12/kirill_slides.pdf
KFParticle Vertex Finder
Summary
J. Lauret, V. Perevoztchikov, D. Smirnov, G. Van Buren, J. C. Webb
The Goal
- Re-evaluate performance of the KF and PP vertex finders by reproducing results reported in 2012 by Amilkar/Jonathan/Yuri (see KVF vs PPV, 2012)
- Conclusions from that study:
- Overall the KFV primary vertex finding efficiency is somewhat better than that of PPV for the W signal with zero-bias pile-up
- In case of clean simulated W-boson signal (no pile-up), PPV is better in finding the right vertex. In other words, KFV efficiency does not degrade as much as the PPV one in noisy environment
- There is an indication that KFV also provides better than PPV vertex efficiency when the vertex rank is taken into account
- TMVA ranking scheme further significantly improves primary vertex finding efficiency
- Unaddressed issues
- Statistically inconsistent samples make it hard to compare the efficiency curves and draw conclusions
- High impurity of KFV and TMVA ranking schemes at low vertex track multiplicities may lead to selection of fake verticies in some analyses
- Conclusions from that study:
The Strategy (this study)
- Data. We started KFV evaluation by performing the standard W analysis of the spin PWG (Jinlong)
- The W analysis was carried out using a sub-sample reconstructed using the KFV finder. The only requirement on the vertex to have a positive rank (standard for PPV) was dropped
- The number of final selected signal events (with identified primary vertices matching a high-E tower) went down by 10% comparing to the PPV finder
This is inconsistent with 2012 pile-up studies but consistent with expectations from clean MC W-boson samples
- Simulation. We proceeded with an MC study similar to the 2012 one
(Due to lost data samples and lack of complete documentation from the 2012 study it is impossible to exactly reproduce the original plots)- To get as close as possible to the reported results we use the following setup:
- The code from the HEAD of CVS as of October, 2015 (that includes KF, Sti, and other event reconstruction code)
- For the primary vertex we simulate W events with the setup used by the Spin PWG (Jinlong). Run 13 geometry
- For pile-up embedding we use Run 13 zero bias data (Currently ~50k events from day 150 only)
- The code and scripts recovered from various sources has been collected in the following repository: https://github.com/star-bnl/star-travex
...a tag will be added when ready to fix the code
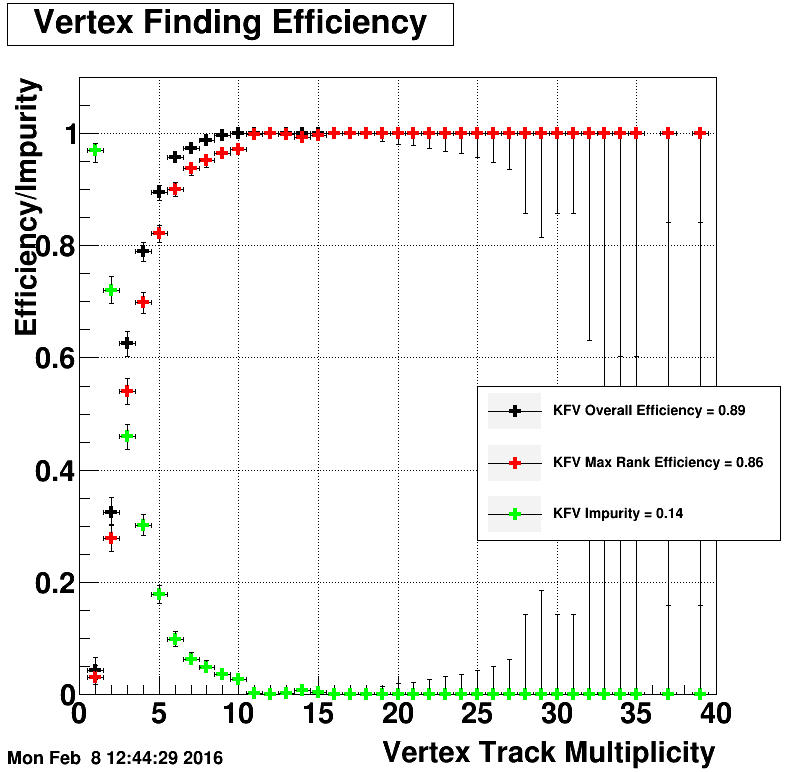
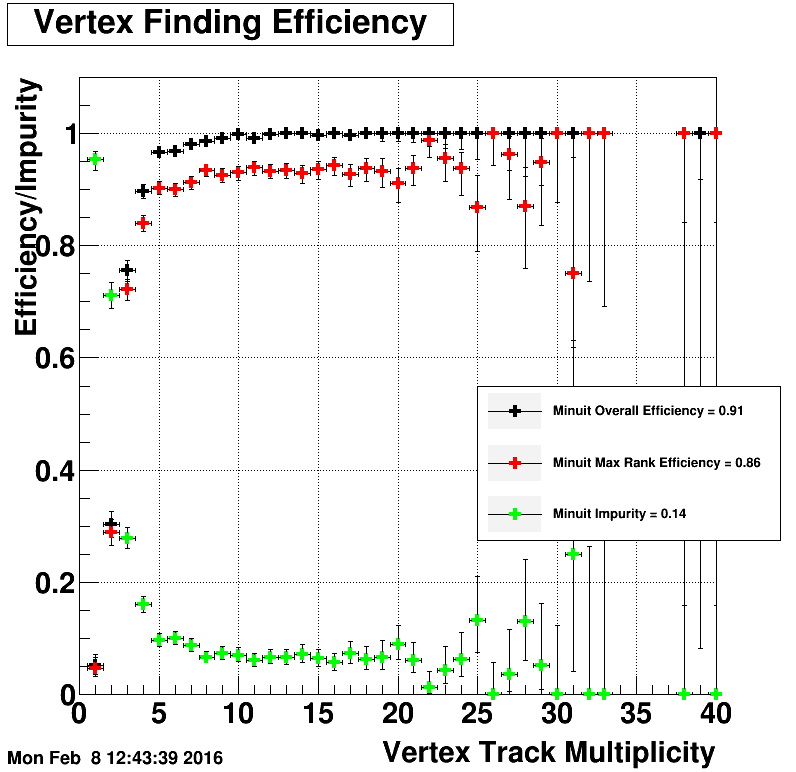
- In this simulation-based study we use the same vertex finding efficiencies as in the 2012 study. They are defined as:
- The denominator is common and filled with the number of primary MC vertices having tracks with TPC hits >= 15
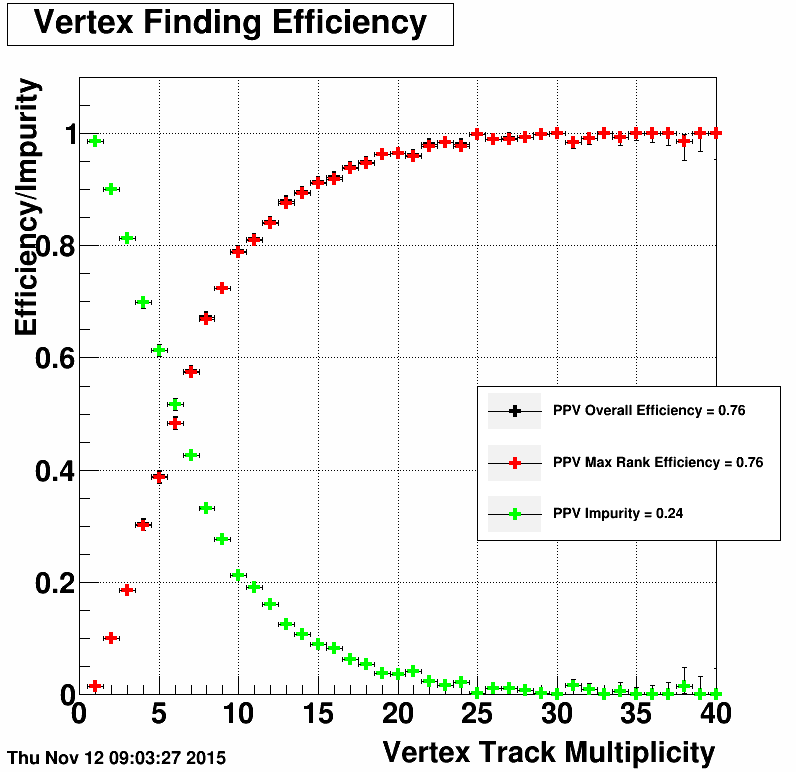
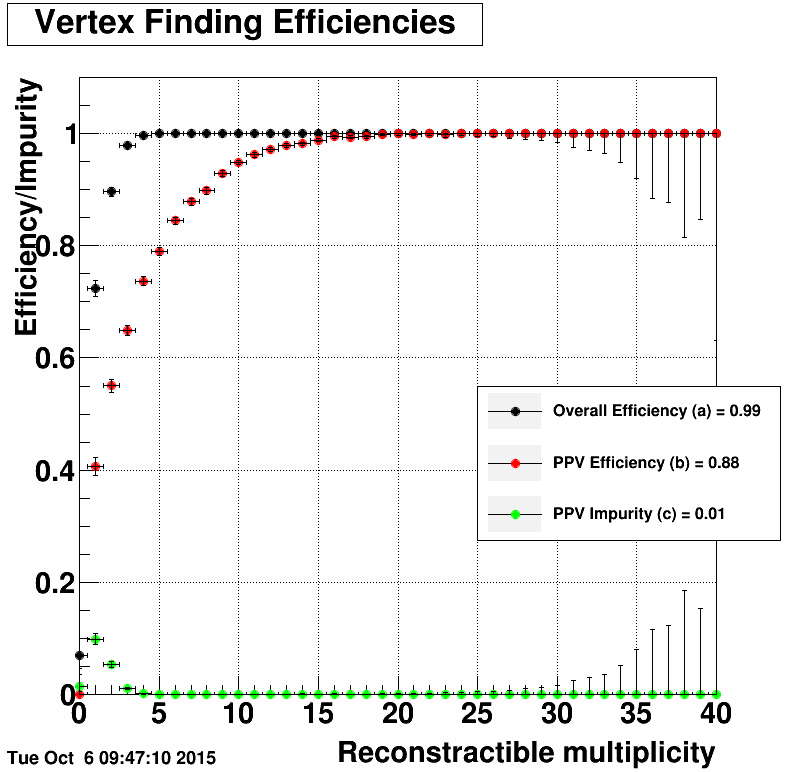
- The Overall Efficiency is calculated by counting the number of reconstructed vertices (regardless of their rank) which have been matched to the primary MC vertex (based on idTruth == 1). In other words, the efficiency gives the probability of the vertex finder to reconstruct the true MC vertex in the event
- The Max Rank Efficiency is similar to the Overall Efficiency but only for the vertices having the maximum rank
- The Impurity counts the maximum rank reconstructed vertices which do not match the primary MC vertex
- To get as close as possible to the reported results we use the following setup:
Conclusions and Findings
- Without pile-up
- PPV outperforms KFV in finding the primary vertex. KFV has lower efficiency of finding the correct primary vertex with fewer tracks attached to it
- However, KFV show better efficiency for finding the primary vertex when the ranking is used. The highest rank reconstructed vertex is more likely to be the true primary vertex
(Note: PPV was not designed to rank the found vertices properly other than assigning a negative rank to likely pile-up vertices)
- With pile-up
- In the new W-boson embedding sample (2013) we find significantly better vertex finding efficiencies for KFV over PPV. This is true for both overall finding and ranked vertex efficiencies
- Finding #1: The impurity is still high and is something to worry about for low multiplicity vertices where the analyzer with a high probability may select a fake vertex if rely on the KFV ranking scheme
- Finding #2:
- PPV internaly constraints the number of verticies released to the user based on an early ranking cuts. It means that if the ranking is not optimized there is a good chance to miss the true primary vertex
- PPV shows the same overall vertex finding efficiency as KFV (86% vs 87%) when the above constraint is removed
- Data
- The Spin PWG reports a 10% lower W selection efficiency with KFV vs PPV
- The Spin PWG reports a 10% lower W selection efficiency with KFV vs PPV
- Finding #3:
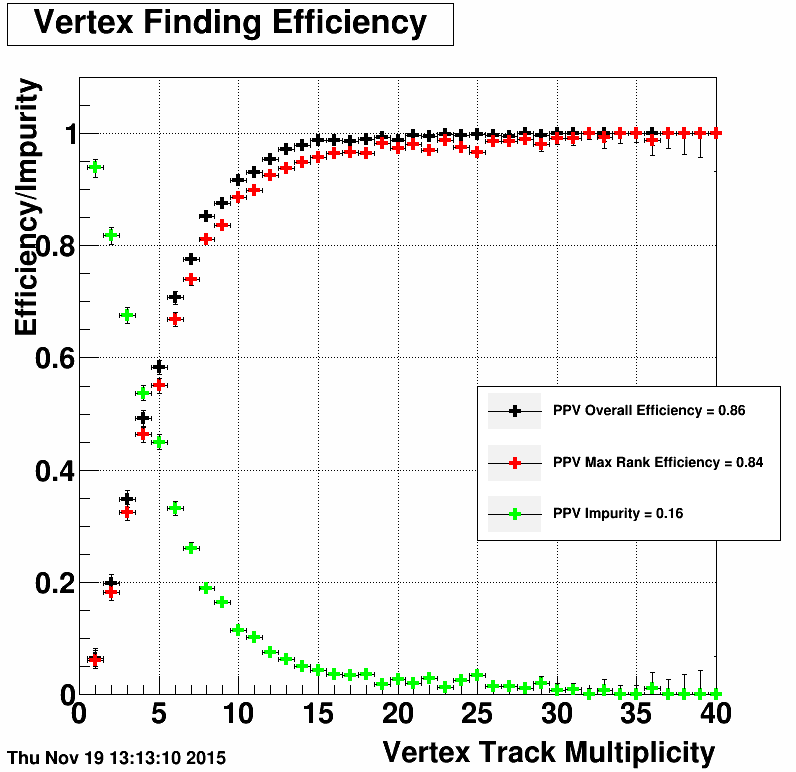
- As we found out the calculation of the Impurity for ranked vertices does not correspond to the original definition. We corrected it, and as expected the following now holds true: Impurity = (1 - Max Rank Efficiency)
Recommendations
- Investigate if a procedure for running vertex finders as afterburners on muDst files can be established (given global tracks and their errors are saved)
November 18, 2015
The hard coded limit on the number of "bad" vertices has been raised from 5 to 150 in PPV
 |
.png) |
November 12, 2015
Here we looked at a few basic distributions for event observables to see if the embedding sample is consistent with the data. The intention is to understand why PPV and KFV relative performance is reversed in embedding and data samples.
| PPV Embedding | PPV Data | KFV Embedding | KFV Data |
|---|---|---|---|
 |
 |
 |
 |
 |
 |
 |
 |
 |
 |
 |
 |
 |
 |
 |
 |
 |
 |
 |
 |
November 11, 2015
In this test we made sure to use the same primary vertex cuts in PPV finder as in the original W analysis. As the result the average efficiency increased from 0.62 to 0.76. It is still lower than the KFV efficiency of 0.81 (0.87) (see below0
 |
.png) |
November 10, 2015
In the code calculating the impurity, reconstructed verticies which do not have a matching MC vertex were incorrectly ignored from the total count. After fixing this the "red" and "green" curves now add up to 1 as expected.
PPV (left) vs KFV (right)
.png) |
.png) |
November 5, 2015
Removed requirement on the minimum value of the Max Rank vertex rank (<0). PPV (left) vs KFV (right)
.png) |
.png) |
November 1, 2015
Results from the new 2013 W embedding samples: PPV (left) vs KFV (right)
.png) |
.png) |
The file list used for this embedding sample is: filelist_wbos_embed.txt
October 6, 2015
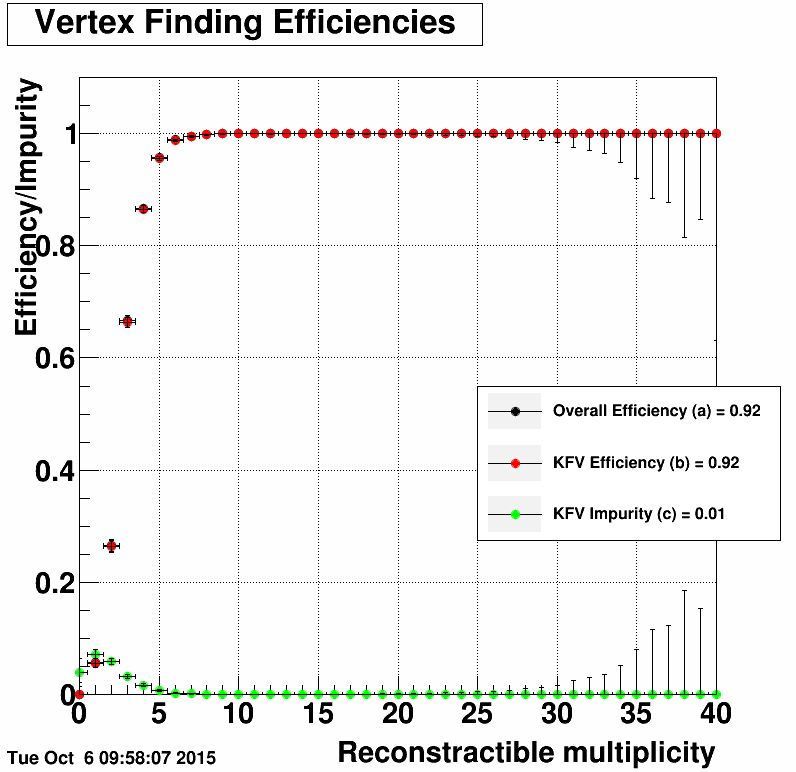
The following plots show vertex finding efficiencies for PPV (left) and KFV (right) as determined from a 50k event sample of Pythia simulated W-boson events without pileup located at:
/star/institutions/bnl_me/smirnovd/public/w_sim_nopileup_fzd/
/star/institutions/bnl_me/smirnovd/public/w_sim_nopileup_ppv/
/star/institutions/bnl_me/smirnovd/public/w_sim_nopileup_kfv/
The following options were used to reconstruct the samples
BFC_OPTIONS="fzin tpcRS y2014a AgML pxlFastSim istFastSim usexgeom FieldOn MakeEvent VFPPVnoCTB beamline
Sti NoSsdIt NoSvtIt StiHftC TpcHitMover TpxClu Idst BAna l0 Tree logger genvtx tpcDB bbcSim btofsim tags emcY2
EEfs geantout evout -dstout IdTruth big clearmem"

BFC_OPTIONS="fzin tpcRS y2014a AgML pxlFastSim istFastSim usexgeom FieldOn MakeEvent KFVertex beamline
Sti NoSsdIt NoSvtIt StiHftC TpcHitMover TpxClu Idst BAna l0 Tree logger genvtx tpcDB bbcSim btofsim tags emcY2
EEfs geantout evout -dstout IdTruth big clearmem"
 |
 |
September 24, 2015 Updated: October 1, 2015
The following plots show vertex finding efficiencies for PPV (left) and KFV (right) as determined from a 50k event sample of Pythia simulated W-boson events without pileup located at:
/star/institutions/bnl_me/smirnovd/public/amilkar/MuDst/
/star/institutions/bnl_me/smirnovd/public/amilkar/PPV2012/
The distribution for KFV is somewhat comparable to the 2011 and 2012 results shown below
The PPV case was reconstructed without the 'beamline' option.
.png) |
.png) |
September 14, 2015
The following plot with vertex finding efficiencies (default = PPV) was created using the refactored code from Amilkar (github.com/star-bnl/star-travex)
Here I used 10k events from Run 13 W-boson Pythia embedding simulation from Jinlong located at:
/star/data19/wEmbedding2013/pp500_production_2013/Wminus-enu_100_20145001/P14ig.SL14g/2013/
Comparing to the 2011 and 2012 results shown below the efficiency appears to be slightly better for lower multiplicity vertices. The overall average efficiency is slightlyt higher 0.50 vs 0.46
.png) |
August 05, 2015
What We Know
- Recent studies
- KFV is ~10% less efficient than PPV in finding the primary vertex as established by the STAR W analysis (Jinlong Zhang, You do not have access to view this node)
- The jet spin analysis seems to be insensitive to the choice of VF... Both PPV and KFV show comparable results (Zilong Chang)
- Some details below
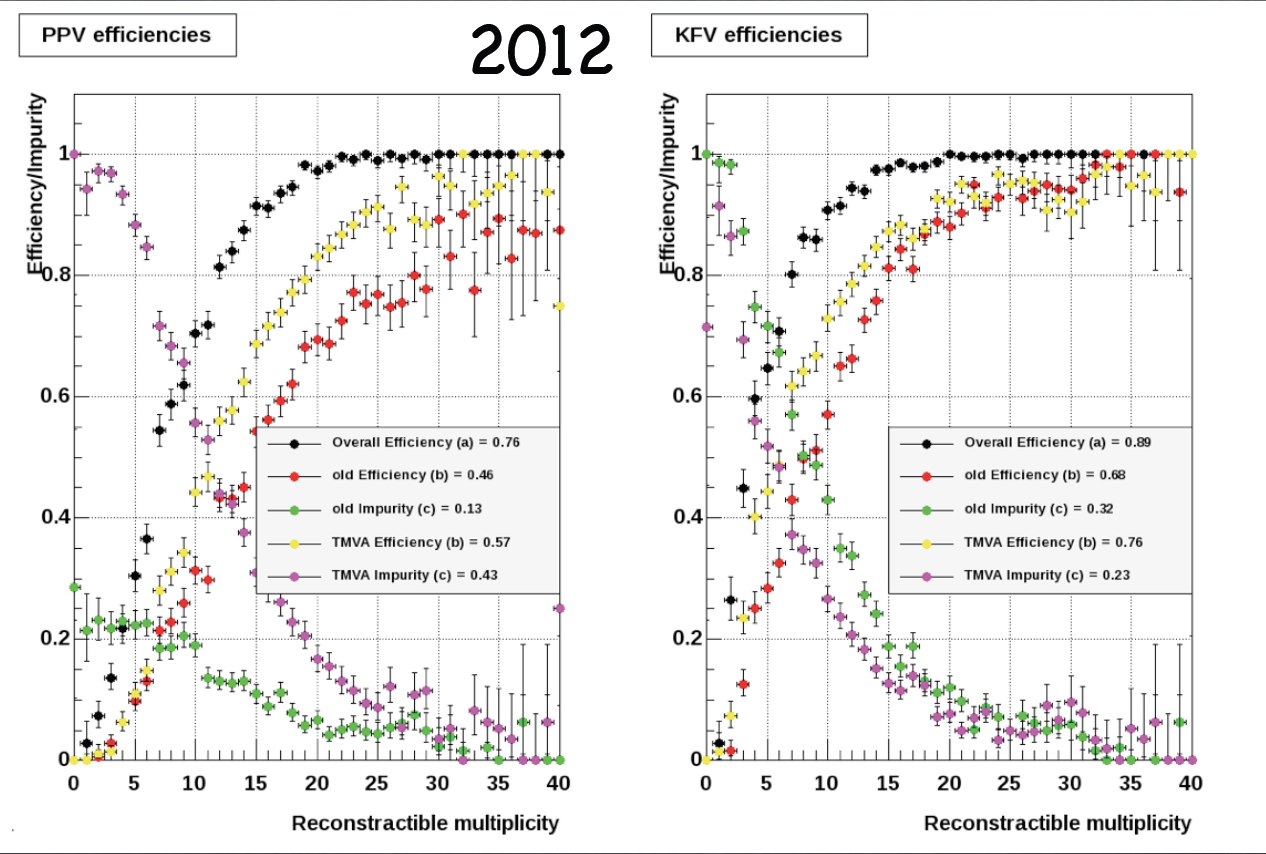
- Past studies (Amilkar/Jonathan/Yuri, 2012)
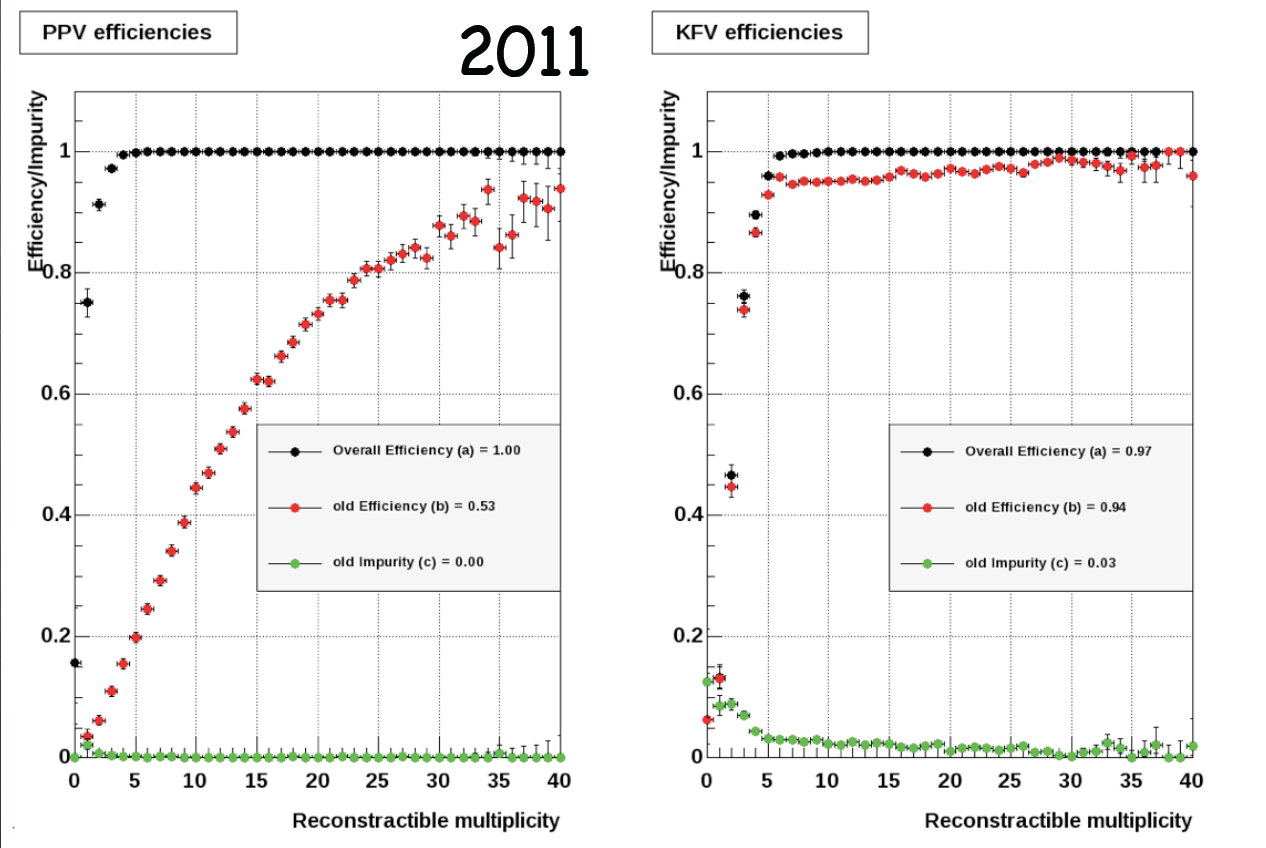
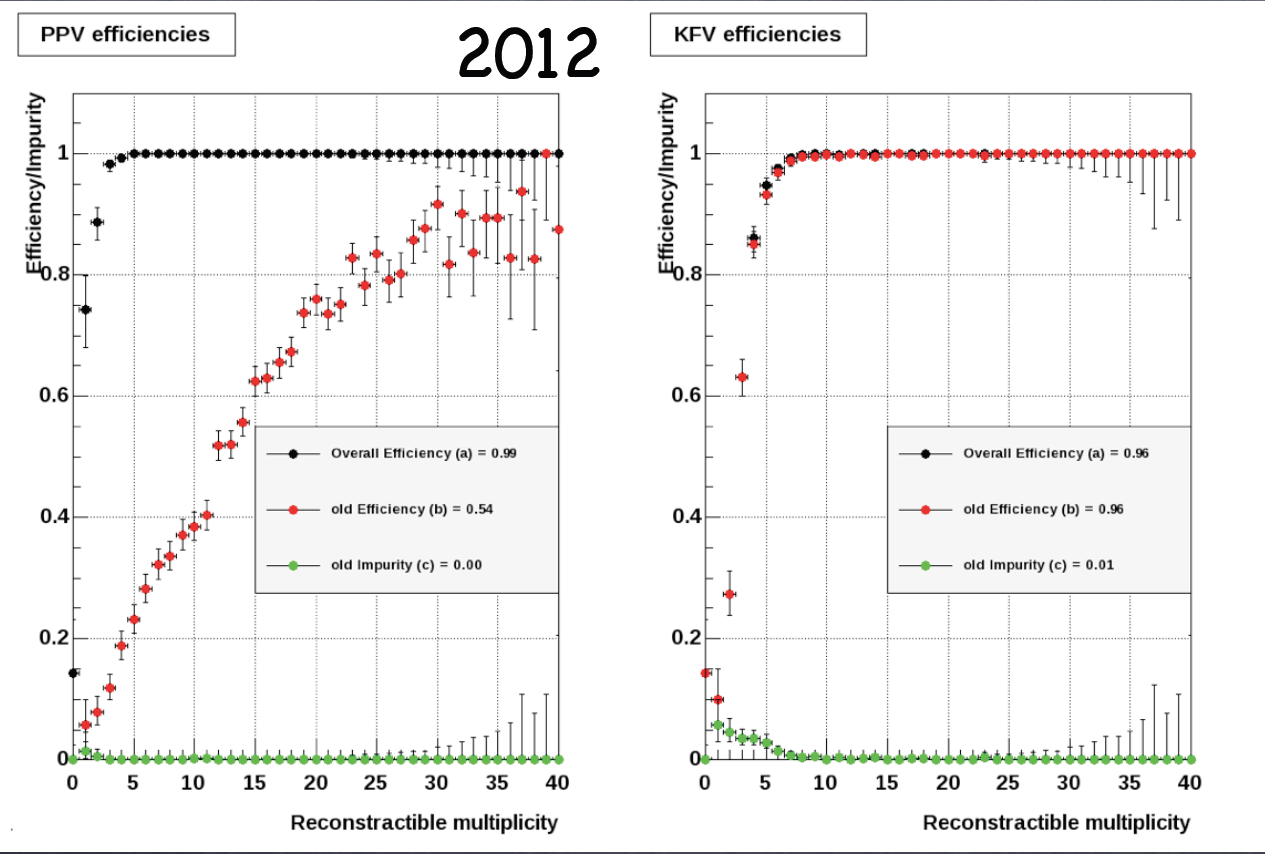
- p+p 200GeV W simulation without pileup
Black points: MC vertex was found;
Red points: MC vertex matched the highest rank vertex;
Yellow points: MC vertex matched the highest TMVA rank vertex
Questions:
What exactly is the difference between 2011 and 2012 years?
Why KFV shows significantly different efficiency for 2011 and 2012?
From the above right handside plots: Does it actually mean that the KFV ranking works and works better than the PPV one?
KFV does give lower efficiency for low multiplicity vertices than PPV But this is with no pileup! Could this explain the 10% loss in the W efficiency? See below for the case with pileup - p+p 200GeV W simulation with pileup: 2011 and 2012 embedding
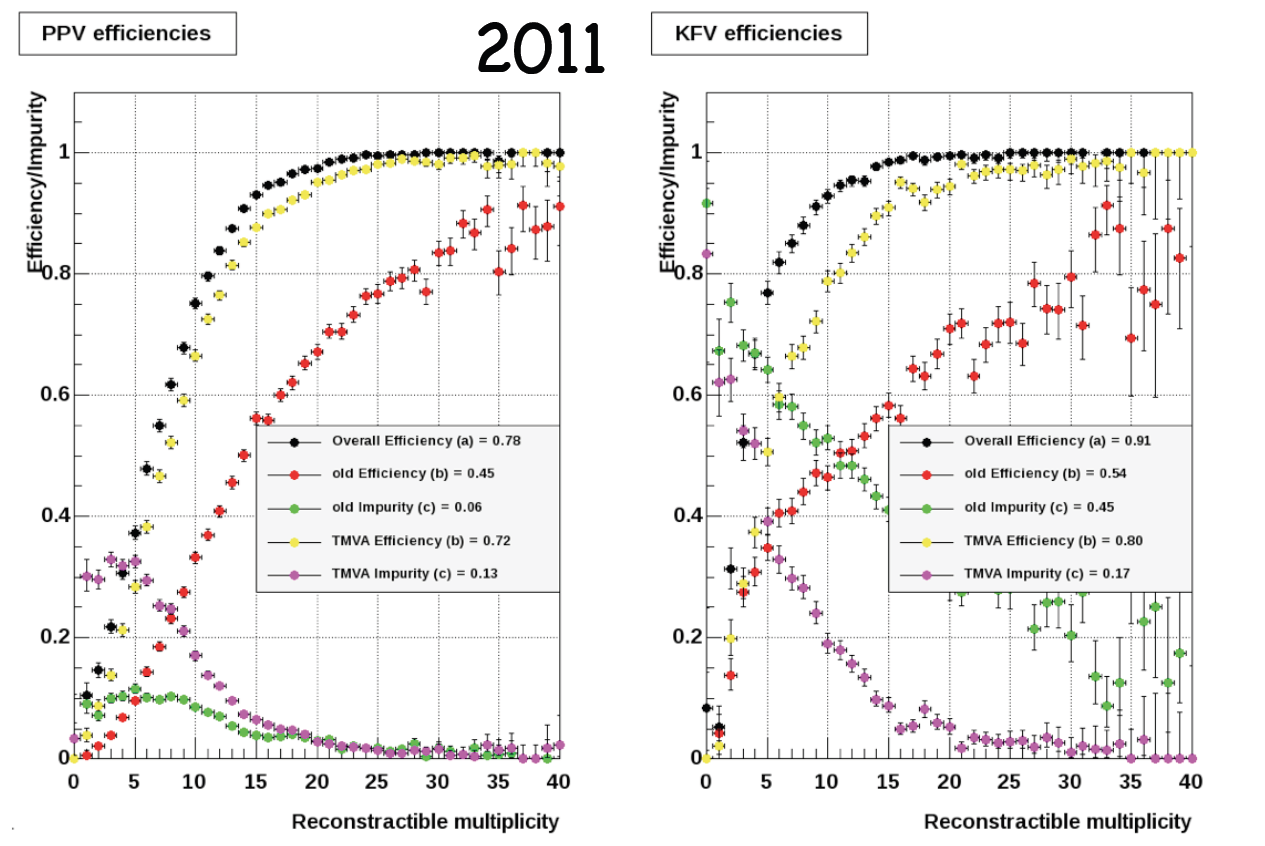
Black points: MC vertex was found;
Red points: MC vertex matched the highest rank vertex;
Yellow points: MC vertex matched the highest TMVA rank vertex
Questions:
From the above plots it does look that KFV also outperforms PPV even at low multiplicities with pileup.
TMVA ranking is better than default one?
- p+p 200GeV W simulation without pileup
- Heavy flavor analysis uses KFParticle code to refit the primary vertices found by their default vertex finder (MinuitVF?)
Where we are
- Reproduce the results presented by Amilkar/Jonathan/Yuri in 2012
- We established a repository to collect the code needed for this study
https://github.com/star-bnl/star-travex- Amilkar has provided a few macros to create trees for TMVA (Many thanks!) but the code to create the efficiency histograms seems to be missing
- Use the same data set from 2012 or create a new one using recent library/data for embedding (I think whichever is easier/readily accessible)
- The recent W embedding request is still being established (Grant Webb, KFParticle Vertex Finder Production Request )
- We established a repository to collect the code needed for this study
- In addition to reproducing/confirming the results of the 2012 study we can do a more direct comparison
- We can build this functionality in star-travex (some basic histograms already available)
- This study could confirm the results from the evaluation with the W analysis but without the overhead of the analysis
- An event-by-event comparison seems to be most attractive
July 22, 2015
KFParticle Vertex Finder Evaluation with W Analisys
For the KFV finder test we used the W analysis performed on the p+p 500 GeV data sets reconstructed using the PPV and KFV finders correspondingly:/star/data23/reco/pp500_production_2013/ReversedFullField/P15ic_VFPPV/2013/ /star/data26/reco/pp500_production_2013/ReversedFullField/P15ic_KFvertex_BL/2013/More details can be found in the following email from Lidia:
http://www.star.bnl.gov/HyperNews-star/protected/get/starprod/648/1/1/1/1/1/1/3/1.html
The summary: We compared the output yields of the W analyses and found that KFV finds about 10% less W events than the PPV finder. Although, in the standard W analysis (using PPV) the considered vertices required to have a positive rank we removed that requirement and let the framework to consider ALL vertices found by KFV
References:
PPV and KFVertex performance comparison based on simulation for y2011 & y2012 pp200 with pile-up - Amilkar/Jonathan/Yuri
PPV vertex
Full documentation of PPV vertex evaluation prior to production of 2008 pp data
We want to answer the following questions in this prioritize order.
For now use the following BFC chain:
"DbV20080712 pp2008 ITTF OSpaceZ2 OGridLeak3D beamLine VFPPVnoCTB debug logger"
Run 8 (200 GeV dAu and pp) , by Gene
2008 evaluation
Status: Evaluation of current BFC, no changes to PPV code yet
2008 PPV evaluation plan
Run #9069005 will be used
http://online.star.bnl.gov/RunLog/Summary.php?run=9069005
| Trigger Name | Trigger ID | # Events | daq source file | needed daq files | expected # triggers |
| zerobias | 9300 | 525 | st_zerobias | all | 525 |
| toftpx | 220710 | 354459 | st_toftpx | 5 | 90000 |
| fms-slow | 220981 | 29914 | st_fmsslow | 20 | 20000 |
| bbc | 220000 | 2646 | st_physics | all | 2646 |
| bh1-mb | 220510 | 8612 | st_physics | all | 8612 |
| etot-mb-l2 | 7 | 2853 | st_physics | all | 2853 |
| jp1-mb-l2 | 8 | 5676 | st_physics | all | 5676 |
| bh2-mb-slow | 220520 | 14236 | st_physics | all | 14236 |
daq files are located at
/star/data03/daq/2008/069/
9069005f 9069005t 9069005z 9069005p
bfc.C will be run in stardev with options:
root4star -b -q bfc.C'(1,1e6,"DbV20080820 pp2008 ITTF OSpaceZ2 OGridLeak3D beamLine VFPPVnoCTB debug logger","/star/data03/daq/2008/069/*")'
The verision of PPV includes the August 2008 change that Post Crossing Tracks are dropped which was enacted in response to the change of the TPC cluster finder
MuDst files will be placed at:
/star/data05/scratch/rjreed/PPV2008Eval/*
Observables to Monitor:
# primary vertices
Z location primary vertices
delta Z between primary vertex z position and bbc or vpd z position
# tracks associated with each primary vertex
Cuts to Monitor:
mMinTrkPt (Currently 0.20)
mMinFitPfrack (Currently at 0.70)
Include all EEMC rings
mMaxZradius
Weights for TPC, EEMC, BEMC
2008 PPV performance Revision 1.29
PPV performance Revision 1.29
Updated 9/7/2008
| Trigger Name | Trigger ID # | # Events Expected | # Events Run |
| zerobias | 9300 | 525 | 525 |
| toftpx | 220710 | 90000 | 28720 |
| fms-slow | 220981 | 20000 | 14299 |
| bbc | 220000 | 2646 | 938 |
| bh1-mb | 220510 | 8612 | 7507 |
| etot-mb-l2 | 7 | 2853 | 2506 |
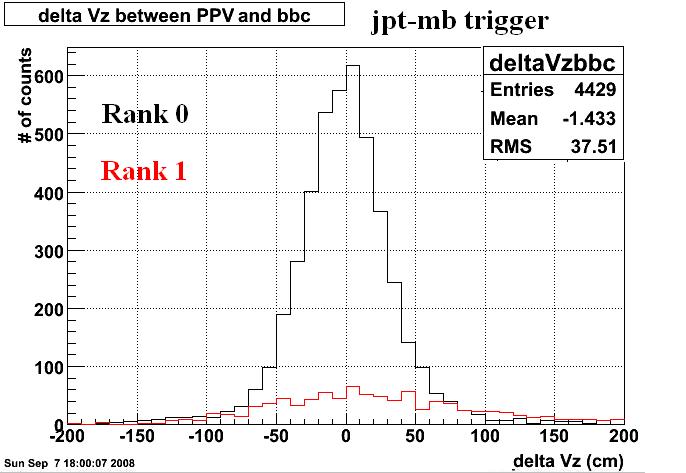
| jpt-mb-l2 | 8 | 5676 | 4983 |
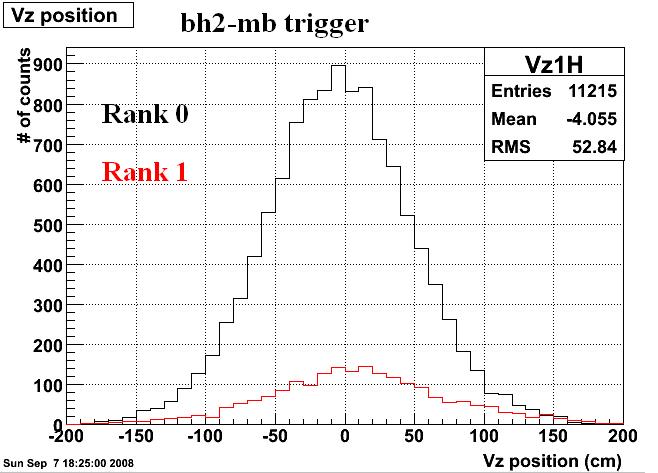
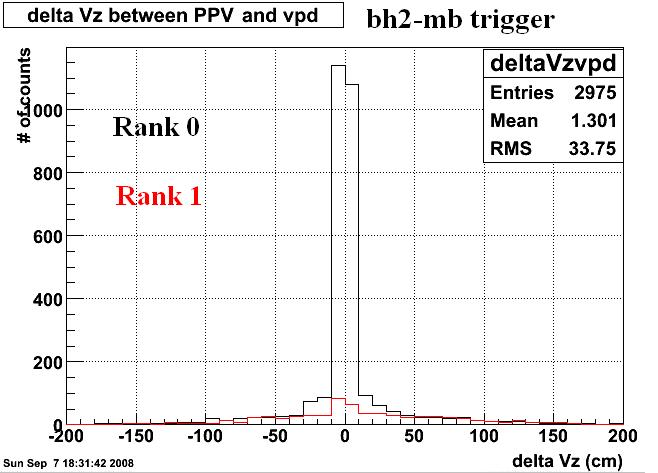
| bh2-mb-slow | 220520 | 14236 | 12507 |
Table 2: Summary of Vertex finding efficiency and vertex matching with events processed by Sept 2. For the vpd, matched is defined as the 0 ranked PPV vertex is within 8 cm of the vpd vertex. For the bbc, matched is defined as the 0 ranked PPV vertex is within 32 cm of the bbc vertex.
.jpg)
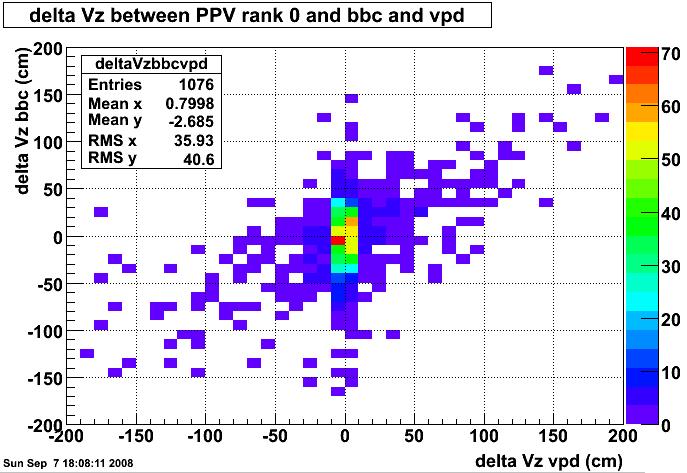
Table 3: Summary of Vertex finding efficiency and vertex matching with events processed by Sept 7. For the vpd, matched is defined as the 0 ranked PPV vertex is within 20 cm of the vpd vertex. For the bbc, matched is defined as the 0 ranked PPV vertex is within 60 cm of the bbc vertex.
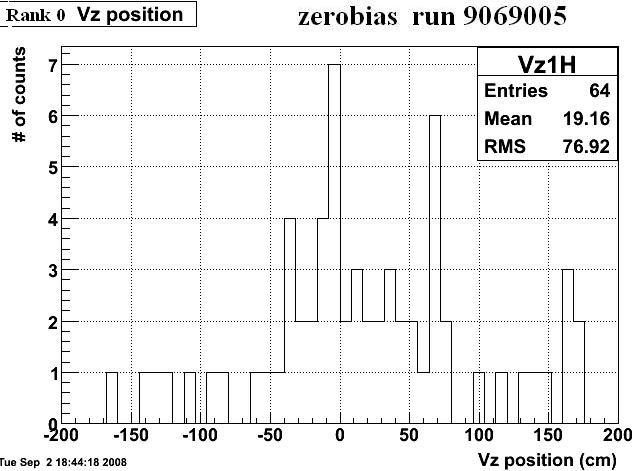
zero bias
525 Events
# vertices,#events
0,461
1,62
2,2
5 Events with vpd + PPV vertex
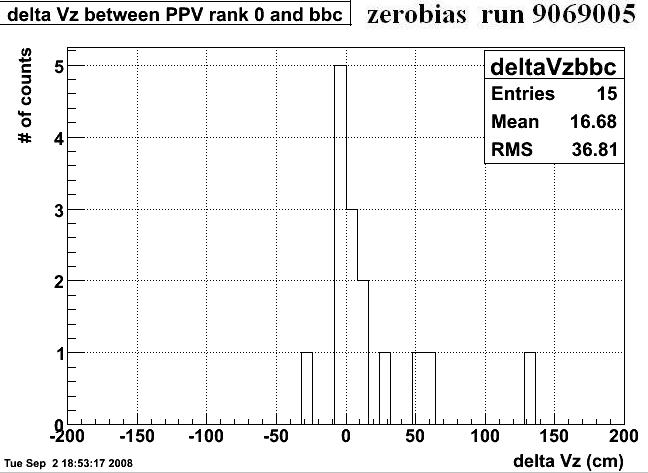
15 Events with bbc + PPV vertex
Figure 2: Z postition of rank 0 vertex for zero bias trigger. Rank 1 and above excluded due to low statistics.
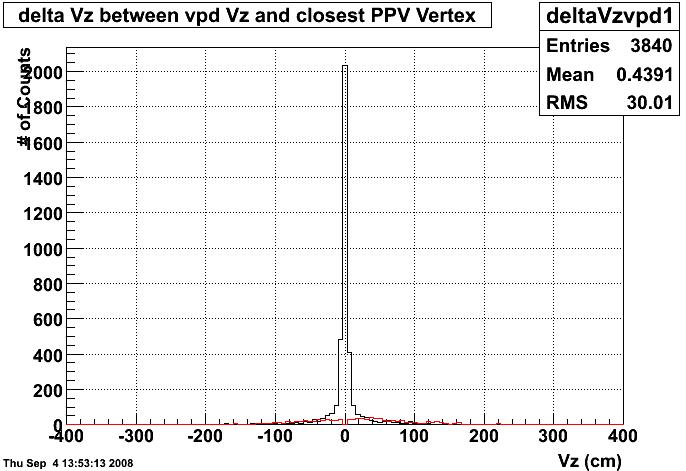
Figure 3: Rank 0 PPV vertex Vz - vpd Vz for zero bias trigger.
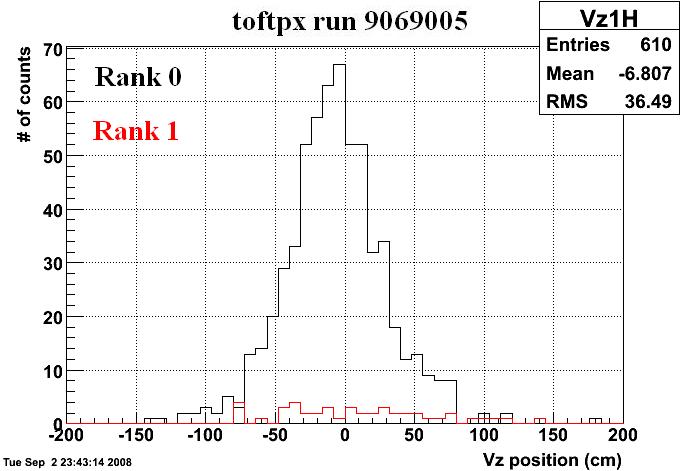
toftpx
28720 Events
# Vertices, # Events
0,28110
1,565
2,39
3,6
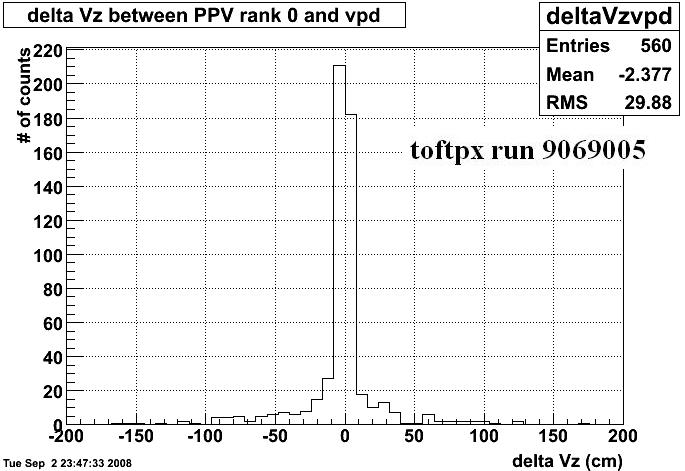
559 Events with PPV rank 0 + vpd
393 Events match (within 8 cm)
41 Events with PPV rank 1 + vpd
7 Events match (within 8 cm)
558 Events with PPV rank 0 + bbc
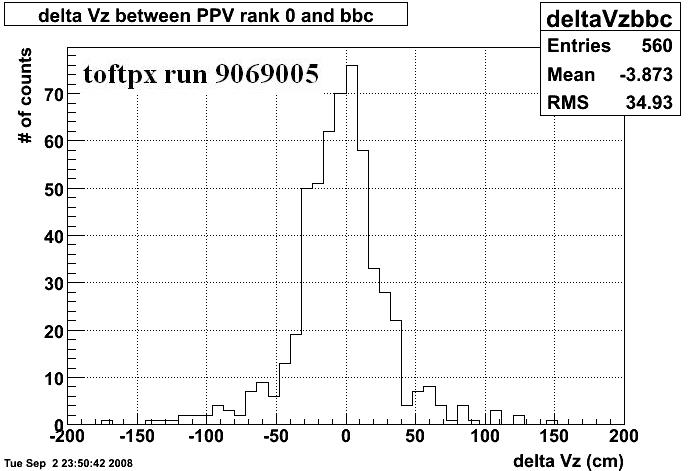
428 Events match (within 32 cm)
44 Events with PPV rank 1 + bbc
20 Events match (within 32 cm)
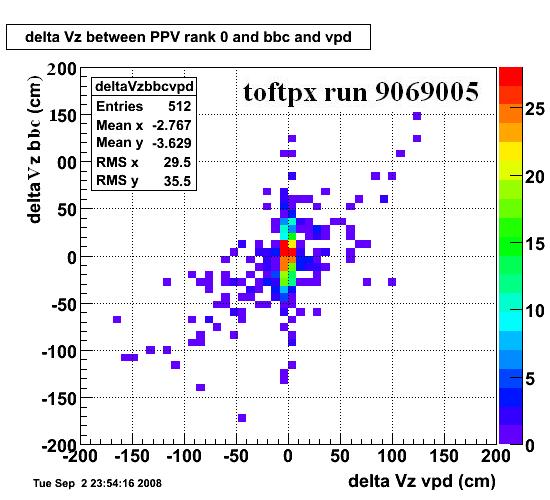
509 Events with PPV rank 0 + bbc + vpd
296 Events match both vpd and bbc
Figure 5: Z position of rank 0 and rank 1 vertices for tof trigger.
Figure 6: Rank 0 PPV Vz - vpd Vz for tof trigger
Figure 7: Rank 0 PPV Vz - bbc Vz for the tof trigger
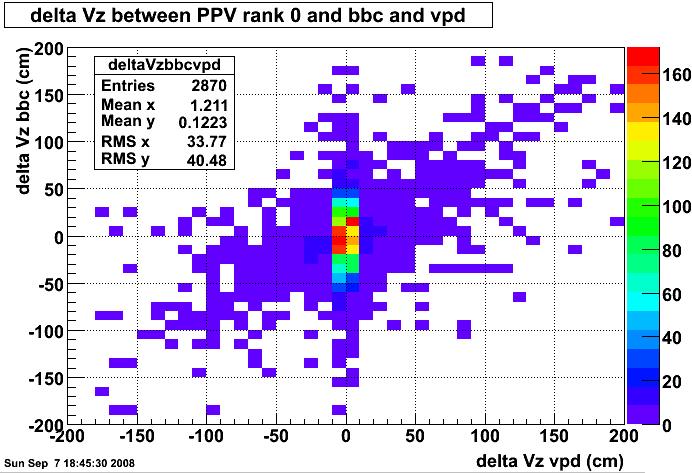
Figure 8: Delta Vz(PPV - vpdVz) vs delta Vz(PPV-bbc) for the tof trigger.
fms-slow
#Vertices,#Events
0,5504
1,7503
2,1173
3,110
4,8
5,1
2162 Events with PPV rank 0 + vpd
1435 Events match (within 8 cm)
389 Events with PPV rank 1 + vpd
98 Events match (within 8 cm)
6679 Events with PPV rank 0 + bbc
4617 Events match (within 32 cm)
1026 Events with PPV rank 1 + bbc
453 Events match (within 32 cm)
1954 Events with PPV rank 0 + bbc + vpd
992 Events match both vpd and bbc
Figures to be added later.
bbc
2646 Events
# Vertices, # Events
0,1157
1,1293
2,183
3,12
500 Events with PPV rank 0 + vpd
392 Events match (within 20 cm)
71 Events with PPV rank 1 + vpd
27 Events match (within 20 cm)
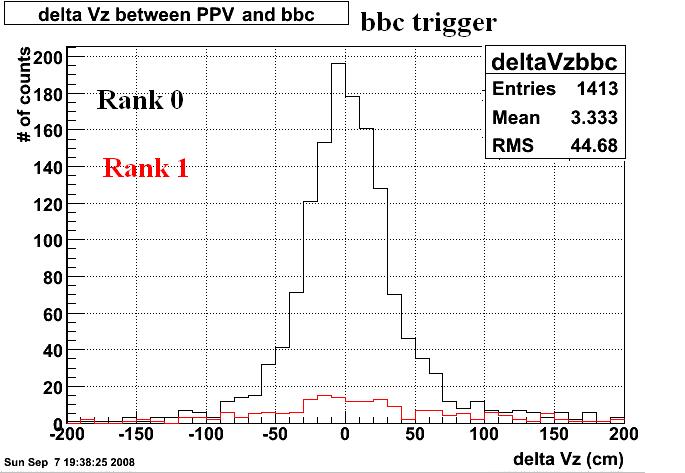
1409 Events with PPV rank 0 + bbc
1232 Events match (within 60 cm)
185 Events with PPV rank 1 + bbc
114 Events match (within 60 cm)
484 Events with PPV rank 0 + bbc + vpd
360 Events match both vpd and bbc
Figure 10: Vz position of PPV rank 0 and rank 1 vertices for the bbc trigger.
Figure 11: PPV Vz - vpd Vz for both rank 0 and rank 1 vertices for the bbc trigger.
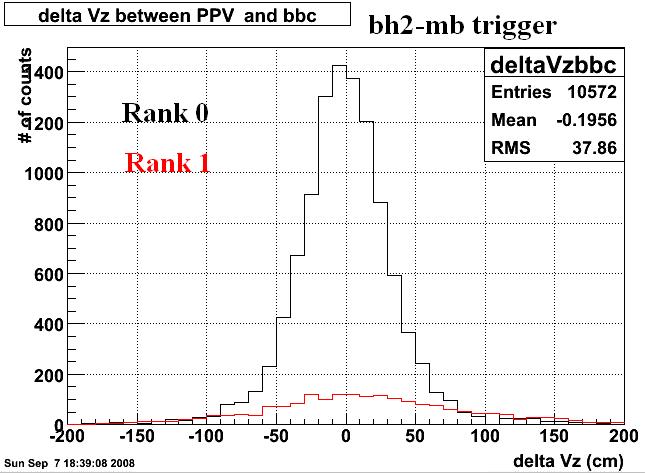
Figure 12: PPV Vz - bbc Vz for both rank 0 and rank 1 vertices for bbc trigger
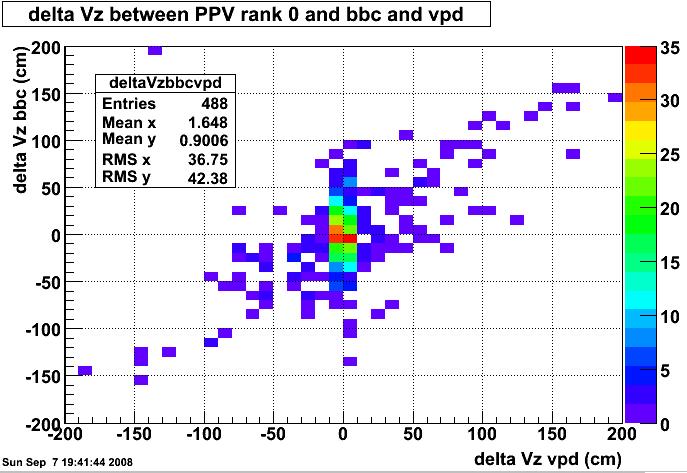
Figure 13: Delta Vz(PPV - vpdVz) vs delta Vz(PPV-bbc) for the bbc trigger.
bh1-mb
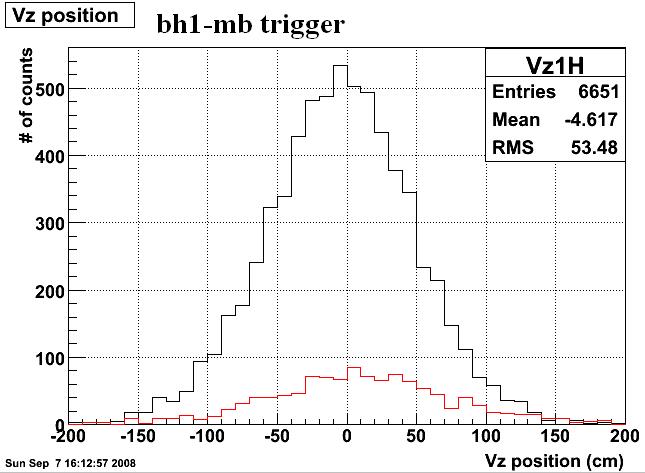
7507 Events
# Vertices, # Events
0,856
1,5494
2,1032
3,122
4,3
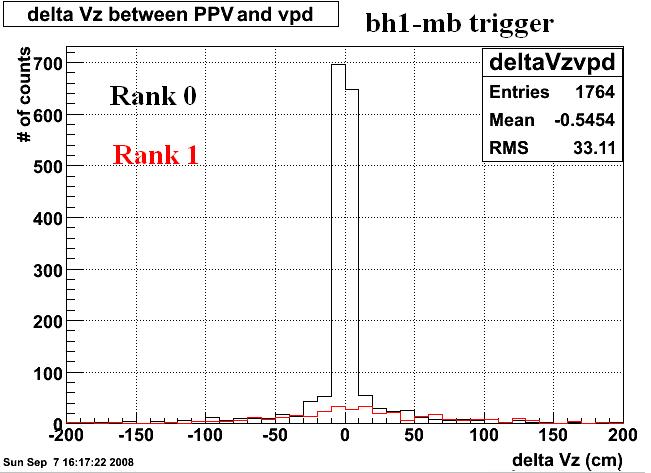
1761 Events with PPV rank 0 + vpd
1452 Events match (within 20 cm)
356 Events with PPV rank 1 + vpd
120 Events match (within 20 cm)
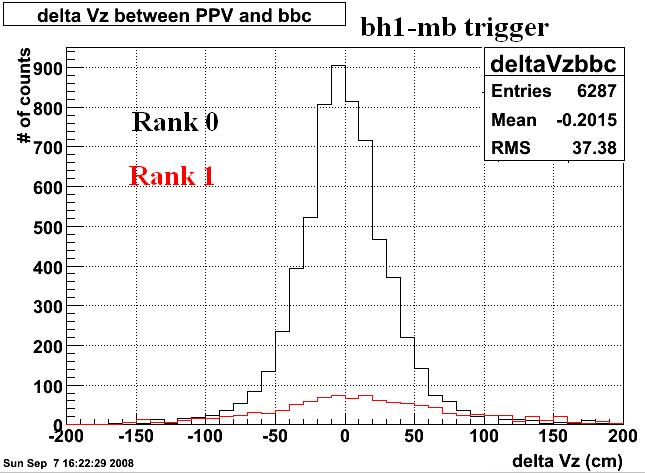
6275 Events with PPV rank 0 + bbc
5729 Events match (within 60 cm)
1082 Events with PPV rank 1 + bbc
676 Events match (within 60 cm)
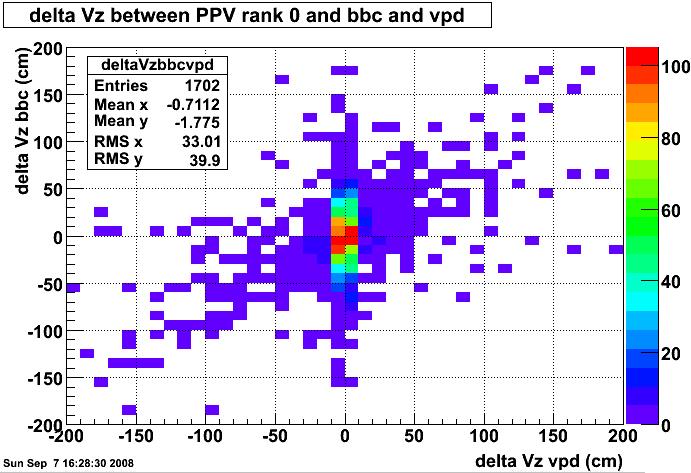
1699 Events with PPV rank 0 + bbc + vpd
1309 Events match both vpd and bbc
Figure 15: Vz position of PPV rank 0 and rank 1 vertices for bh1 trigger
Figure 16: PPV Vz - vpd Vz for Rank 0 and Rank 1 vertices for bh1 trigger.
Figure 17: PPV Vz - bbc Vz for rank 0 and rank 1 vertices for bh1 trigger
Figure 18: Delta Vz(PPV - vpdVz) vs delta Vz(PPV-bbc) for the bh1 trigger.
etot-mb-l2
2506 Events
# Vertices, # Events
0,95
1,1768
2,539
3,96
4,7
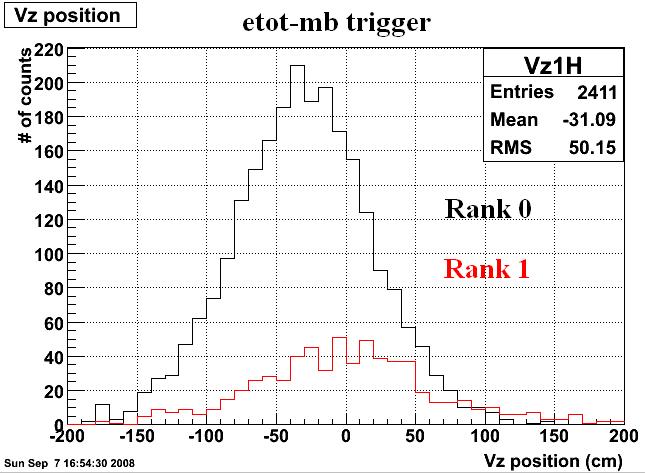
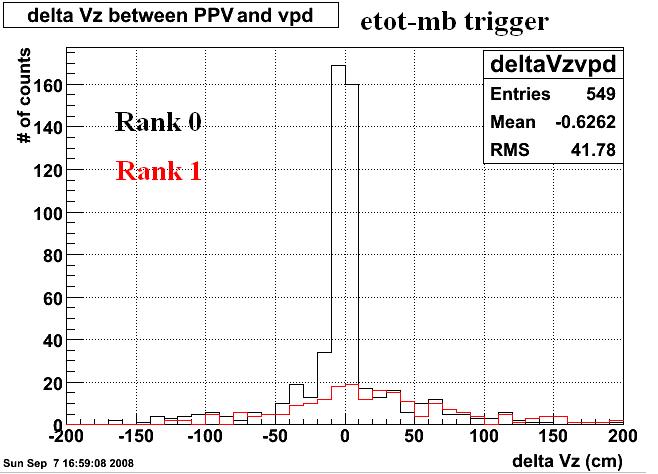
549 Events with PPV rank 0 + vpd
380 Events match (within 20 cm)
204 Events with PPV rank 1 + vpd
61 Events match (within 20 cm)
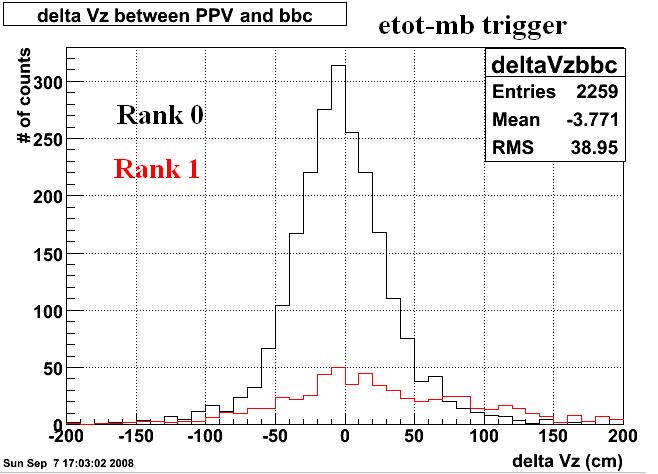
2252 Events with PPV rank 0 + bbc
2013 Events match (within 60 cm)
599 Events with PPV rank 1 + bbc
367 Events match (within 60 cm)
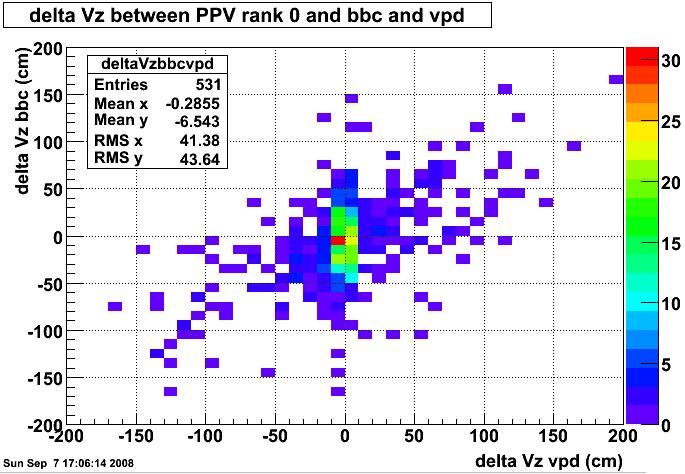
530 Events with PPV rank 0 + bbc + vpd
339 Events match both vpd and bbc
Figure 20: Vz position of rank 0 and rank 1 vertices for etot trigger
Figure 21: PPV Vz - vpd Vz for rank 0 and rank 1 vertices for etot trigger
Figure 22: PPV Vz - bbc Vz for rank 0 and rank 1 vertices for etot trigger
Figure 23: Delta Vz(PPV - vpdVz) vs delta Vz(PPV-bbc) for the etot trigger.
jpt-mb-l2
4983 Events
# Vertices, # Events
0,240
1,3751
2,860
3,120
4,12
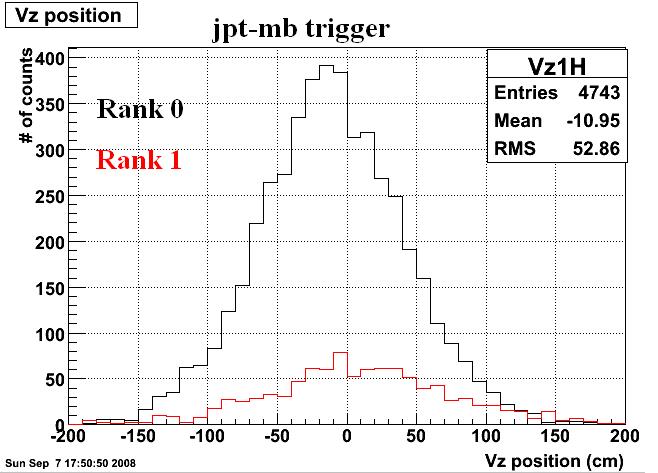
1114 Events with PPV rank 0 + vpd
869 Events match (within 20 cm)
292 Events with PPV rank 1 + vpd
84 Events match (within 20 cm)
4419 Events with PPV rank 0 + bbc
4040 Events match (within 60 cm)
927 Events with PPV rank 1 + bbc
553 Events match (within 60 cm)
1072 Events with PPV rank 0 + bbc + vpd
777 Events match both vpd and bbc
Figure 25: Vz position of rank 0 and rank 1 vertices for jp1 trigger.
Figure 26: PPV Vz - vpd Vz for jp1 trigger
Figure 27: PPV Vz - bbc Vz for jp1 trigger
Figure 28: Delta Vz(PPV - vpdVz) vs delta Vz(PPV-bbc) for the jp1 trigger.
bh2-mb-slow
12507 Events
# Vertices, # Events
0,1292
1,9168
2,1830
3,209
4,7
2970 Events with PPV rank 0 + vpd
2402 Events match (within 20 cm)
649 Events with PPV rank 1 + vpd
216 Events match (within 20 cm)
10555 Events with PPV rank 0 + bbc
9625 Events match (within 60 cm)
1929 Events with PPV rank 1 + bbc
1200 Events match (within 60 cm)
2861 Events with PPV rank 0 + bbc + vpd
2164 Events match both vpd and bbc
Figure 20: Vz position of rank 0 and rank 1 vertices for etot trigger
Figure 26: PPV Vz - bbc Vz for jp1 trigger
Figure 23: Delta Vz(PPV - vpdVz) vs delta Vz(PPV-bbc) for the etot trigger.
Figure 27: PPV Vz - vpd Vz for jp1 trigger
Comparison between PPV revision 1.29 and track pT change
This compares the effiiciency of the current PPV vertex finder (revision 1.29 which includes PCT fix) to the suggested change of including tracks with 0.1 GeV < pT < 0.2 GeV to the algorithim. Currently PPV only uses tracks with pT > 0.2 GeV. Since tracks with 0.1 GeV will not reach the BEMC and would be rejected with the PPV algorithim, we've included only tracks with 0.1 < pT <0.2 which cross the central membrane and we did not require them to point to a tower.
The bfc code is at:
/star/data05/scratch/rjreed/PPV2008Eval/Vertex5/
The daq files processed as of 9/7/2008 are at:
/star/data05/scratch/rjreed/PPV2008Eval/MuDstPt100/

Table 1: Efficiency comparison between PPV revision 1.29 and altered PPV which accepts lower pT tracks. Matching with the vpd is defined as the rank 0 PPV vertex is with 20 cm of the vpd vertex, and matching with the bbc is defined as the rank 0 PPV vertex is within 60 cm of the bbc vertex.
Table 2: Break down of the number of events used to calculate the efficiencies of the altered PPV vertex algorithim.
Table 3: PPV revision 1.29 statistics posted here for ease of comparison
PPV Revision 1.29 high luminosity trigger details
The following data was taken with triggers: bh1-mb (ID 220510), etot-mb-l2 (ID 7). jpt-mb-l2 (ID 8), and bh2-mb-slow (ID 220520). The total number of events in this set was 16351.
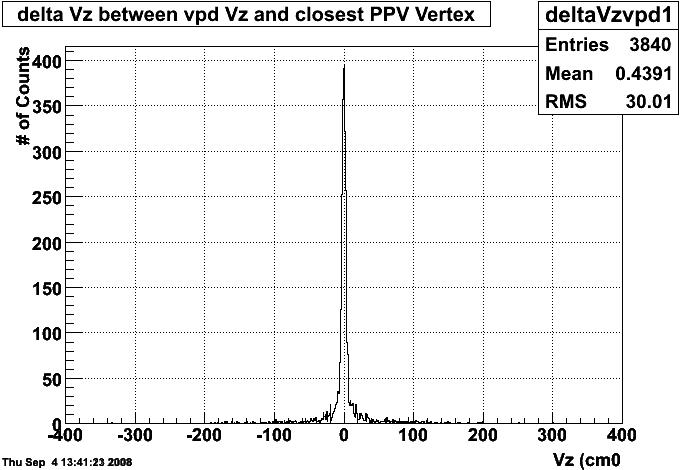
Figure1 : Delta Vz between PPV Vertex closest to the VPD vertex and the vpd. PPV ranking was ignored.
Figure 2. Delta Vz between second closest PPV vertex and vpd vertex.
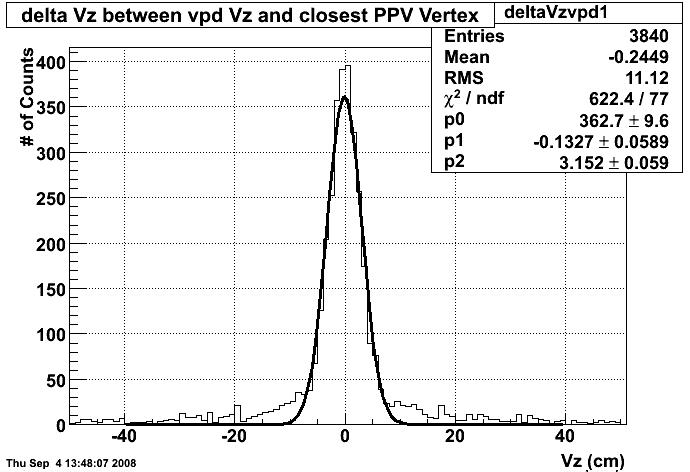
Figure 3: This is figure 1 fitted with an unrestrained gaussian.
Figure 4: This is Figure 1 and 2 (red) plotted on top of each other with a bin width of 6.3 cm (2 times the sigma fitted in Figure 3.)
Detailed event comparison PPV & VPD vertex, (Rosi)
BFC
"DbV20080712 pp2008 ITTF OSpaceZ2 OGridLeak3D beamLine >VFPPVnoCTB debug logger"
star/data05/scratch/balewski/2008-daq/st_fmsslow_9060086_raw_1090001.MuDst.root
Detailed event count
1271 Events , 256 Events with no PPV vertex, 271 Events with vpd vertex, 144 with at least one PPV vertex matching the vpd, 136 events with the 0 ranked vertex matching the vpd, 10 Events with the 1 ranked vertex matching the vpd , 49 Events with no PPV vertex and a vpd Vertex, 5 Events with multiple vertices matching the vpd , 1 Event with 2 ranked Vertex matching the vpd (multiple match), 1 Event with 3 ranked vertex matching the vpd (multiple match)44 Events out of 222 with both PPV and vpd vertex have all vertices
outside of 50 cm of vpd. 11 of these have more than 1 PPV vertex
Conclusion: out of 271 events with VPD vertex:
- 49 (18%) has no PPV vertex
- 151 (56%) has one of PPV vertex closer than 8 cm from VPD vertex
- 71 (26%) none of PPV vertices is closer than 8 cm to VPD vertex
VertexAnalysis8cm.txt file lists (for the events with a vpd vertex) the event #, # of vertices, rank of each vertex that matches vpd.
Details of Events with mismatched PPV VPD vertices with vertex location forced
I've run through 5 events where the vpd and the PPV vertices don't match. daq file location is:
star/data05/scratch/balewski/2008-daq/st_fmsslow_9060086_raw_1090001.daq
Here are the PPV Vz values prior to "forcing" the values. For the histograms, the solid red lines indicate the location of the vpd vertex and the circles indicate the location(s) of the PPV vertices.
EventID = 749 vpdVz = 98.2939 PPV vertices at Vz = -48.75 140.85
EventID = 2115 vpdVz = -34.348 PPV vertices at Vz = -106.55
EventID = 3346 vpdVz = -33.7838 PPV vertices at Vz = 129.35
EventID = 3952 vpdVz = 0.664319 PPV vertices at Vz =
EventID = 4447 vpdVz = 25.5813 PPV vertices at Vz = -99.95
For comparison, here is an event where the VPD vertex and PPV vertex were within 8 cm of each other:
All the important files (including the likelihood histograms and track multiplicities) can be found at:
/star/u/rjreed/Vertex3/Eventdaq*
Here are the results:
daq #7 EventID = 749 vpdVz = 98.2939 # PPV vertices = 10 at Vz = 90 92 94 96 98 100 102 104 106 108
Primaries that passed the cut (flag>0, pt>0.2GeV, nFitP/nPoss>0.51):
id = 277 flag = 801 Nhits = 7 Npos = 11 pt = 0.370926 frac = 0.636364
id = 278 flag = 801 Nhits = 6 Npos = 11 pt = 0.250512 frac = 0.545455
id = 279 flag = 801 Nhits = 6 Npos = 11 pt = 0.271426 frac = 0.545455
id = 281 flag = 801 Nhits = 8 Npos = 11 pt = 1.57357 frac = 0.727273
id = 283 flag = 801 Nhits = 6 Npos = 11 pt = 0.638242 frac = 0.545455
id = 292 flag = 801 Nhits = 5 Npos = 9 pt = 0.292521 frac = 0.555556
id = 295 flag = 801 Nhits = 7 Npos = 11 pt = 0.213841 frac = 0.636364
daq #22 EventID = 2115 vpdVz = -34.348 N PPV vertices = 10 at Vz = -42 -40 -38 -36 -34 -32 -30 -28 -26 -24
Primaries that passed the cut:
id = 48 flag = 301 Nhits = 40 Npos = 45 pt = 0.362589 frac = 0.888889
id = 63 flag = 301 Nhits = 26 Npos = 34 pt = 0.602728 frac = 0.764706
id = 64 flag = 301 Nhits = 35 Npos = 45 pt = 0.392374 frac = 0.777778
id = 66 flag = 301 Nhits = 32 Npos = 45 pt = 0.772336 frac = 0.711111
id = 288 flag = 801 Nhits = 6 Npos = 11 pt = 2.56192 frac = 0.545455
id = 290 flag = 801 Nhits = 9 Npos = 11 pt = 0.206602 frac = 0.818182
id = 291 flag = 801 Nhits = 10 Npos = 11 pt = 0.556056 frac = 0.909091
id = 292 flag = 801 Nhits = 8 Npos = 11 pt = 0.722384 frac = 0.727273
id = 296 flag = 801 Nhits = 6 Npos = 11 pt = 0.236179 frac = 0.545455
id = 297 flag = 801 Nhits = 6 Npos = 11 pt = 0.267664 frac = 0.545455
id = 298 flag = 801 Nhits = 6 Npos = 11 pt = 0.9994 frac = 0.545455
id = 299 flag = 801 Nhits = 5 Npos = 8 pt = 0.332944 frac = 0.625
id = 300 flag = 801 Nhits = 9 Npos = 11 pt = 0.389091 frac = 0.818182
id = 310 flag = 801 Nhits = 5 Npos = 9 pt = 0.236941 frac = 0.555556
daq #44 EventID = 3346 vpdVz = -33.7838 N PPV vertices = 10 at Vz = -42 -40 -38 -36 -34 -32 -30 -28 -26 -24
Primaries that passed the cut:
id = 129 flag = 301 Nhits = 38 Npos = 42 pt = 0.352418 frac = 0.904762
id = 433 flag = 801 Nhits = 6 Npos = 9 pt = 0.73871 frac = 0.666667
id = 436 flag = 801 Nhits = 6 Npos = 11 pt = 4.33162 frac = 0.545455
id = 441 flag = 801 Nhits = 7 Npos = 11 pt = 1.19905 frac = 0.636364
id = 446 flag = 801 Nhits = 6 Npos = 11 pt = 2.52832 frac = 0.545455
daq #63 EventID = 3952 vpdVz = 0.664319 N PPV vertices = 10 at Vz = -8 -6 -4 -2 0 2 4 6 8 10
Primaries that passed the cut:
id = 177 flag = 301 Nhits = 35 Npos = 40 pt = 0.751434 frac = 0.875
id = 433 flag = 801 Nhits = 7 Npos = 11 pt = 1.16509 frac = 0.636364
id = 437 flag = 801 Nhits = 6 Npos = 10 pt = 0.277501 frac = 0.6
id = 440 flag = 801 Nhits = 6 Npos = 11 pt = 6.03469 frac = 0.545455
daq #70 EventID = 4447 vpdVz = 25.5813 N PPV vertices = 10 at Vz = 18 20 22 24 26 28 30 32 34 36
Primaries that passed the cut:
id = 324 flag = 311 Nhits = 9 Npos = 10 pt = 0.50257 frac = 0.9
id = 391 flag = 801 Nhits = 6 Npos = 11 pt = 0.332764 frac = 0.545455
Jan's notes
-------- Loose notes, needs cleanup, Jan
Lidia's most recent test prodcution of 3 runs (89 files) also had
CTB matching off
Low Lumi (run9060086), Mid Lumi (run9069059), High Lumi (run 9068124)
/star/data10/reco/ppProduction2008/ReversedFullField/P08ic_test/2008/*/*
log files on /star/rcf/prodlog/P08ic_test/log/daq
/star/data10/reco/ppProduction2008/ReversedFullField/P08ic_test/2008/*/*
log files on /star/rcf/prodlog/P08ic_test/log/daq
--------------
Akio's event classification txt file from 3 files (with differnt luminosity) at the bottom of
http://www.star.bnl.gov/protected/spin/akio/200806/index_5th.html
from Lidia's test production. I checked that I get identical results
with Jan's production and Lidia's for the low lumi run.
-------------
Just remind you that there is "accidental match" between VPD and
TPC vertex up to ~25% (@ high lumi) under the peak.
--------------
* could you show Rosi how to print VPD & BBC vertex position in BFC?
Once Mudst is created, you can get VPD vertex (from TOF electronics) by
StMuEvent->vpdVz()
For BBC I have not yet implemented the calibrated vertex. Once done,
one should be able to get it from
StEvent->triggerDetectorCollection()->bbc()->zVertex()
--------- Rosi ---------
While I was doing this, I spun a macro over the MuDst in the folder
above and duplicated some of Akio's results, just to make sure I
understand.
So here are the z positions of the ranks 1 and 2 vertices and the vpd:
Fig 1.

Locations of Akio's pages in protected/spin
August 13, 3 runs produced with PPV w/o using CTB
-----
PPV vs. VPD , by Xin
Fig 1. VPD-Minuit, d-Au 2008 events, minB events: ZDC East+VPD

Fig 2. VPD-PPV, p-p 2008 events, st_physics , no trig selection, mostly E & BEMC triggers

Hi Jan, Akio,

Xiaoping helped me to check the test 2008 pp production data Jan suggested. Please take a look at the attached plot. Basically what is plotted here is vz difference between vpd vertex and tpc vertex for different vpd hit configuration, similar to that in Akio's web page, but using the TOF electronics for vpd hit configuration selection.

So firstly we didn't see the ~30cm width gaussian component. The two narrow gaussian components are attributed to the VPD resolution. In the VPD timing resolution, we see a double gaussian structure, and with about a factor of 2-3 difference in widths. This is consistent with what we see here.  The largest ~50-60 cm gaussian component should be due to the fail of TPC VF and it is related to the beam vz distribution.

And secondly, the resolution in the (E,W)>(1,1) configuration is expected better than the configuration of (E,W)=(1,1). The "dilution" in vpd resolution with more hits seems not true to us.

Generally, we don't see an obvious issue on the VPD side. I am not sure if how the result will change when you use the DSM for selection. Or maybe your statistics is not good enough? Or the data are from some bad TOF runs?

Thanks and Best Regards

/xin

Jan Balewski wrote:
Hi Xin,
Those 2 analysis do not need to be contradicting.
There is much less pileup in dAu than in pp. There may be beam background in pp.

Can you investigate this effect in 2008 pp data from production requested by Matt  ~2 weeks ago, it is done, files are on data09,10.
http://www.star.bnl.gov/HyperNews-star/get/starprod/249/4/1/1/1/1/2.html
It is 3K daq files, 1M events w/ TPC , 1/4 of events have VPD vertex, ~90 % have TPC vertex produced by  fixed PPV.

Thanks
Jan


On Oct 1, 2008, at 11:40 PM, Xin Dong wrote:

Hi Akio,

Thanks for this message. Actually we always see the resolution will be improved if we require more VPD hits. I don't quite understand the ~25cm gaussian distribution at this step. Xiaoping helped me check the dAu data (we don't have TPC vertex in pptoftpx triggered data), you can find the distribution from the attached plot. It shows that with more VPD hit requirement, the vertex resolution is better. No 25cm-width gaussian contribution appears.

So  let me answer your questions directly, see them inline.
Akio Ogawa wrote:
Hello

I posted this yesterday to vertex mailing list. I'd like to make
sure you know this since you may be more intersted than us.

In zVPD-zTPC distribution at pp, we see 3 structures. See Fig 2 (2 gaussian fit) and Fig6 (3 gaussian fit) of
http://drupal.star.bnl.gov/STAR/blog-entry/rjreed/2008/sep/11/ppv-revision-1-29-high-luminosity-fmsslow-trigger-evaluation

First is sigma ~3cm peak where TPC and VPD vertex matches. Quite
reasonable with resolutions of those two vertex finding.

2nd is sigma ~80cm, which is understandable if TPC and VPD picked
up 2 different vertex. Vertex distribution is ~gaussian with sigma
~60cm. If we pick 2 randomly and take difference, then sigma should be sqrt(2)*60cm ~ 85cm.

3rd one is the mistery. Sigma is around 25-30cm. So its much
narrower than random. Its hard for TPC to "miss" vertex by
10-20cm, since all track's DCA_z is <3cm.

Rosi changed selection of TPC vertex (more matched tracks) to
make TPC vertex better, she saw no difference in the structure.

Now if look at the plot at bottom of http://www.star.bnl.gov/protected/spin/akio/200806/index_8th.html

which is essentially same plot but divided by # of VPD hits.
This 3rd structure with sigma~25cm is most evident when both VPD-E
and VPD-W has 2 or more hits.

This suggests (at least to me) that when you have more than one hit
in VPD and taking time average, sometimes you are diluting VPD vertex resolution. This can be "real" (another collisions in the same crossing
or some beam halo hitting VPD) or detector effects (hot pmt, too
loose timing cut, etc).

Have you seen this?
==>Xin
No.
Is there way to get some more info from mudst?
==>Xin
The number of hits and Tdiff information should be available from MuDst. Tdiff cut may help some in resolution, but shouldn't create a 20cm gaussian peak.
(For example distance or rms of hits included in average?)
==>Xin
I don't quite understand, distance or rms of hits to what?
Is there some cut you tuned when you accepting hit to form average?
==> Xin
Yes. We have already removed the hits with non-physical timing information (out of trigger timing window, but for sure with 25ns resolution). And we always take the earliest hit.
(for exapmple maximum time difference?)
Is average weighted by ToT?
==> Xin
No. Supposedly the ToT dependence is calibrated. We just do simple average.
Have you tried taking earliest hit only?
==> Xin
Yes.

We will trying to see what the pp data look like. Thanks

/xin
Plots Jan
plots
2009 algo upgrade 1
The following deficit of the CVS version of PPV have been corrected for in December of 2008
- PPV requires at least 2 matched tracks for a valid primary vertex saved in muDst with positive rank.
Problem: For W-events there may be less then 2 tracks in the eta range [-1,+1.4] to satisfy the above requirement. Although recent change in PPV causes additional 5 sub-prime vertices are saved with negative rank, it does not guarantee the vertex containing just a single 20+ GeV track will beat other minBias vertices from the pileup and make to this top 5.
Remedy: Extend criteria for valid primary vertex and save also those which contain at least one track with pT>15 GeV matched to BTOW or ETOW tower with ADC>=MIP. I do not want to impose ADC>1000 cut, because reco high pT electron track may miss the hit-tower and point to the neighbor one. There will be very few events with such high pT tracks so on average # of vertices per event will not change.
Implementation: PPV 'natural ranking' for pp events has dynamic range of [0+eps ... 10,000].
- for events with 2 or more matched tracks PPV rank will be increased by 1000,000 (so vertex will be on the top of the vertex list)
- for events with only one high pt track(for W reco) live the PPV rank as is (will be in the middle of vertex list)
- for (the first five) sub-prime vertices (for Akio's study) subtract 1000,000 from 'natural' PPV rank, it will be a negative number
Consequences: The 1-track vertex will be listed after any 2+ track vertex. However, in none 2-track vertex is found the 1-track vertex will be firts on the list with positive rank. I maintain people should not use the top rank PPV vertex blindly but QA prime vertices according to their needs.
- Plot below shows ADC of BTOW for towers pointed by TPC MIP track, for a subset of ~200 towers, from fmsslow pp 2008 events. The red band is pedestal, the green band is MIP peak position. The maximum of MIP distribution as at ADC~17.
No change needed: PPV is tagging BTOW tower as fired if ADC>8. This item is here because I misremembered sth about PPV code, the plot is correct and nice so I live it for the record.
Fig 3.
Modified PPV produces vertices with the following rank distribution:
Fig 1. Example of PPV vertex rank distribution for 200 W-events generated by Pythia. Top plot show vertex rank, X-axis range [-1.2e6, +1.2e6]. The 3 groups of vertices are those with 2 or more matched tracks (most right), 1-track vertices (12 events in the middle), sub-rime vertices (negative rank). Bottom plots shows the same events but Log10(rank) is used on the X-axis to make this 3 categories better visible.

Fig 2. Example of PPV vertex rank distribution for 200 st_physics 2008 pp events.


2009 evaluation
04 : MC study on PPV with BTOF in Run 9 geometry (Xin blog)
01 transverse vertex , pp 500 data & Pythia (Rosi, Jan)
Study of vertex reconstruction in transverse X-Y plane, pp 500 data from 2009, high PT events from W-stream
Large variance in the initial determination of beam line constrain for pp 500 data has been observed. The concern was that reconstruction accuracy for high PT TPC electron tracks from W decay may be not sufficient.
At first simpleminded idea of increasing minimal PT of used tracks and imposing high track multiplicity did not improve accuracy of vertex determination in the transverse plane.
Next we look at individual events passing the following selection criteria, passing through most likely primary tracks candidates from the pool of global tracks:
- use only global tracks matched to BTOW,ETOW, or central membrane
- require nFit/nPoss>51%, and Rxy @ DCA to X=Y=0 below 3 cm
- require PPV finds valid vertex along Z direction, require delZ <3cm
- require global pT in range [0.8, 8.0] GeV/c
- require Sti extrapolation error in transverse plane is below 3 mm
- require at least 5 tracks passed criteria listed above
Fig 1. Typical spectra for some of the cut parameters for W-stream pp 500 events

Tracks passing selection are approximated by straight lines in the vicinity of DCA to X=Y=0 and shown in Fig 2. Z-axis range is always 6 cm, centered at the max likelihood of PPV.
The following encoding was added to plots:
*head of arrows indicates direction of the momentum vector
*size of the arrow is proportional to track PT, max PT for given set of tracks (event) is in the title of the left histograms
* thickens of the line is proportional to the weight of track in vertex (or beam line) determination, I used formula:
width= 3.* (0.15*0.15)/sig/sig; , where sig=sigYlocal from Sti .
(The last 2 conditions sometimes interfere, since the thicker line increases also the arrow size, but still plots should help us to gain intuition).
Fig 2, Projections of global tracks at most likely vertex location. One event per row, two projections: Y vs. X and Y vs. Z.
Stray tracks are most likely form pileup or from decays matched to fired EMC towers.
The width of arrows is proportional to likelihood the vertex is below it (~1/track error^2)

Attachments A,B show more real data events.
Attachments C,D show M-C Pythia QCD events with partonic pT>10 & 20 GeV, respectively. C has fixed vertex offset, D has varied vertex offset.
Conclusion:
*Very often one sees 2 jets what impedes determination of transverse vertex position on event by event basis, in particular if vertex finder is not returning non-diagonal covariance matrix element covXY (see last event in fig 2.)
* we will pursue alternative method of beam line determination by fitting its equation directly to preselected tracks from multiple events. We try to skip event by event vertex determination.
02 3D beam line fit to tracks, no tilt
Stand alone 3D beam line fitter developed by Jan & Rosi in June 2009

Fig 2. Example of X0,Y0 fit for pp 500 data F10415, more in att. A)

Attachment A): slides vetting 3D beam-line fitting algo
Attachment B): document describing math used to compute 3D likelihood
Attachment C: Source code for fitting contains:
03 2009 PPV upgrade #1
PPV vertex finder code have been upgraded and default changed as follows.
(July 9, 2009)
1) the threshold for pT of single-matched-track vertices was lowered from 15 GeV/c to 10 GeV/c.
The purpose if this change is to not loose W-events for the case when TPC calibration is approximate and error of reco PT of TPC track is sizable for tracks with true PT of 20 GeV/c.
Those vertices will be now more likely pileup contaminated, since there is a fair chance for a random matching of a global track to a fired BTWO tower. Users should use vertices with at least 2 matched tracks which will have rank>1e6.
2) Additional expert-only functionality was added to PPV , encapsulated in the new class Vertex3D.
If BFC is run in normal way, e.g. in production no new action is taken.
However if BFC option "VtxSeedCalG" is added for every event high quality most likely primary tracks candidates from the pool of global tracks:
- use only global tracks matched to BTOW,ETOW, or central membrane
- require nFit/nPoss>51%, and Rxy @ DCA to X=Y=0 below 3 cm
- require PPV finds valid vertex along Z direction, require delZ <3cm
- require global pT in range [0.8, 8.0] GeV/c
and printed in to the logfile in the format:
printf("track4beamLine %f %f %f %f %f %f %f %f %f %d %f %.1f %d \n",x,y,z,px,py,pz,er->_cYY,er->_cZY,er->_cZZ , tr.nFitPoint,tr.gChi2,z0,eveID);
Fig. 1. prim tracks candidates in the vicinity of beam line

Fig. 2. QA plots for prim track selection

STAR Vertex Finder Performance Comparison
| Minuit VF | KFV | PPV | PPV + fitter |
|---|---|---|---|
 |
 |
 |
 |
| Num Vertices | |||
 |
 |
 |
 |
| Num Tracks per event | |||
 |
 |
 |
 |
| Num Tracks per vertex | |||
 |
 |
 |
 |
| Vertex X | |||
 |
 |
 |
 |
| Vertex Y | |||
 |
 |
 |
 |
| Vertex Z | |||
 |
 |
 |
 |
| Vertex Error X | |||
 |
 |
 |
 |
| Vertex Error Y | |||
 |
 |
 |
 |
| Vertex Error Z |
Comparison of total error magnitude of reconstructed vertex position. The data are from a Run13 W simulation without pile-up. The vertex is reconstructed without (left) and with (right) proposed PPV fitter
| PPV as is | PPV w/ fitter |
|---|---|
.png) |
.png) |
| PPV | KFV | Minuit |
|---|---|---|
 |
 |
 |

