Effect of SVT and SSD on SpaceCharge Calibration
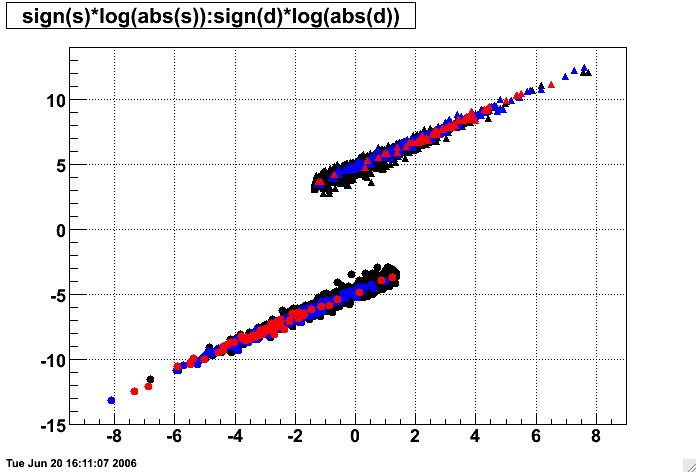
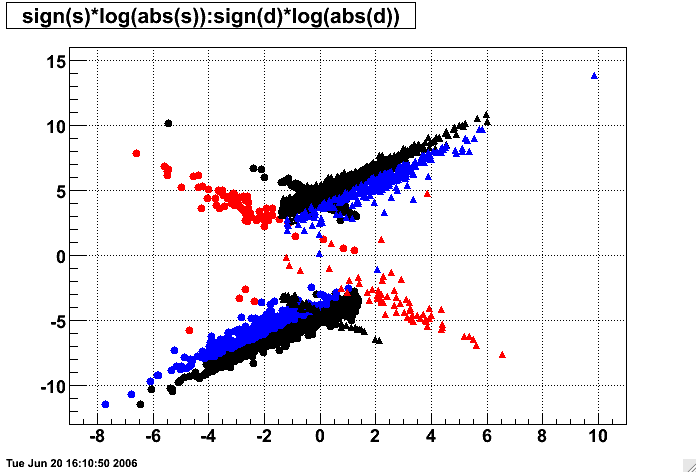
The method of determining the amount of SpaceCharge present in the TPC from the signed distance of closest approach (sDCA) of global tracks to the primary vertex has worked well in the productions where only TPC hits have been used on tracks. With the integration of SVT and SSD hits onto global tracks in ITTF, this method of determining SpaceCharge needs some modification: undistorted SVT and SSD points will pull the sDCAs and modify the relationship between sDCA and SpaceCharge.Without regard to this point, here is a plot which shows the value of SpaceCharge given by StMagUtilities::PredictSpaceCharge() from the global tracks in 25 real CuCu200 events, where I have plotted log(SpaceCharge) vs. log(sDCA). Black points have no SVT or SSD, blue have SSD and TPC but no SVT, and red points have TPC and SVT (SSD or not). Circles represent tracks with sDCA>0, and triangles are tracks with sDCA<0.
Note that the relationship between SpaceCharge and DCA should be linear and track through (sDCA=0,SpaceCharge=0), but the log() function doesn't work for nonpositive numbers, so I have multiplied by the sign of the original SpaceCharge or sDCA to clarify things. It might be a little hard to understand this plot at first, but the sDCA values range from -4.0cm, which is the left end of the upper band, to small negative values, the right end of the upper band, then wrap around as small positive value on the left end of the lower band, rising to a limit of +4.0cm on the right end of the lower band.
We see that, as expected, without regarding the SVT and SSD points in the PredictSpaceCharge() function, the sDCAs of tracks with those points are mapped incorrectly to SpaceCharge in the same manner as TPC-only tracks.
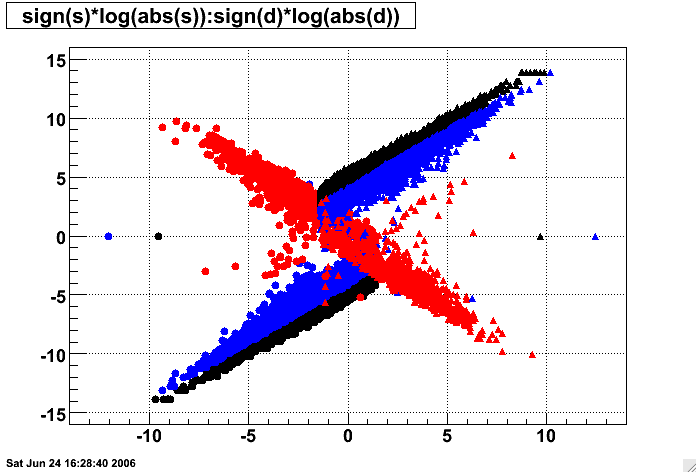
This compares to the following plot of the same data where the undistorted SVT and SSD points are considered in PredictSpaceCharge(), where we also require at least 5 hits in each of the inner and outer TPC:
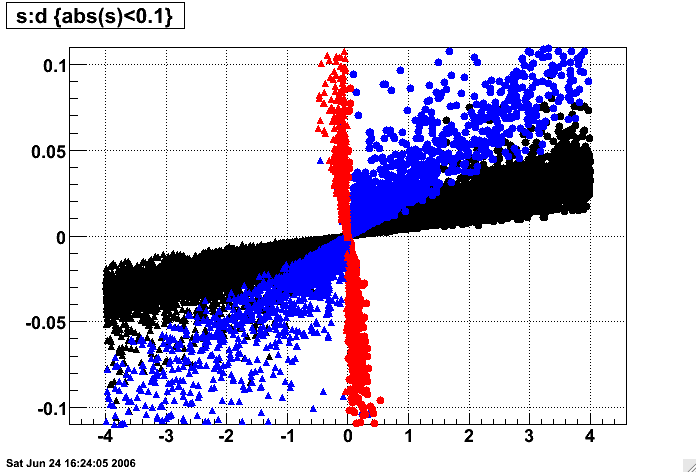
(Here I have included the linear plot, showing how the log plot better separates the various datasets.)
We see clearly how SVT or SSD points actually tend to reverse the sDCA <=> SpaceCharge relationship. This is because the track now rotates about the highly constrained SVT hit position, instead of freely within the TPC.
There are no TPC-only tracks with the reversed sDCA-to-SpaceCharge relationship, but there remain a few tracks with silicon hits which do flip. Examining the topology maps for these shows that they are TPC+SSD tracks with almost no hits in the outermost 10-20 rows of the TPC, or are TPC+SVT+SSD tracks with almost no hits in the innermost 7 or 8 rows; these two circumstances likely still leave the GridLeak distortion to dominate the rotation of the track.
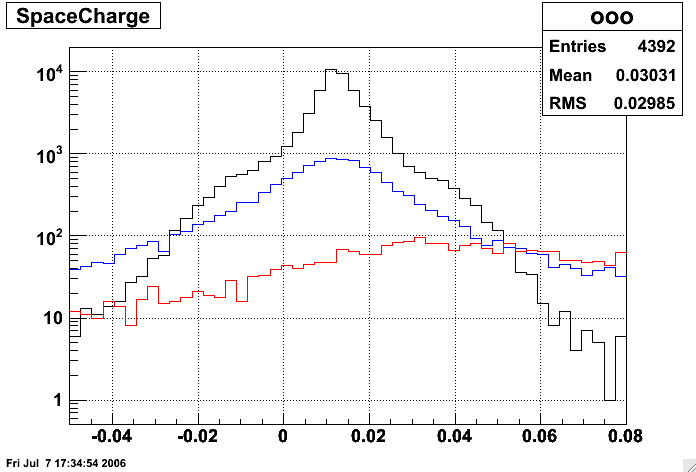
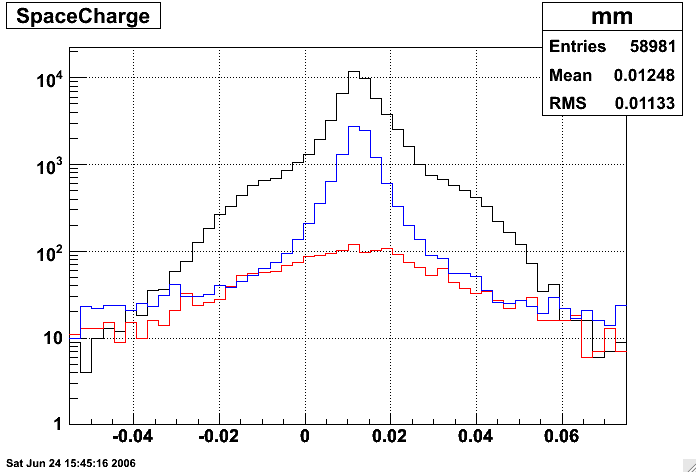
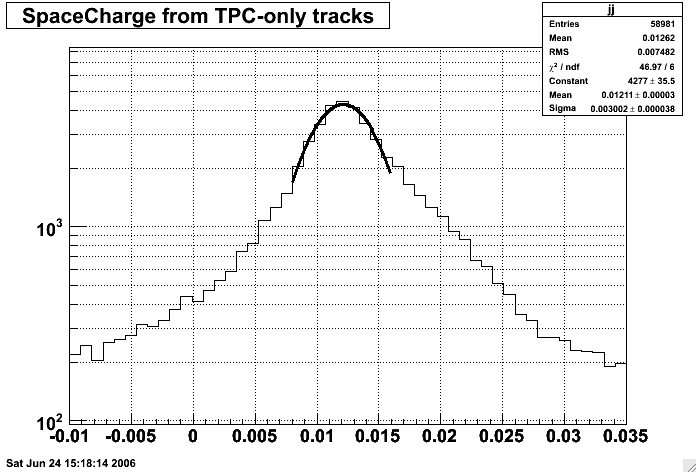
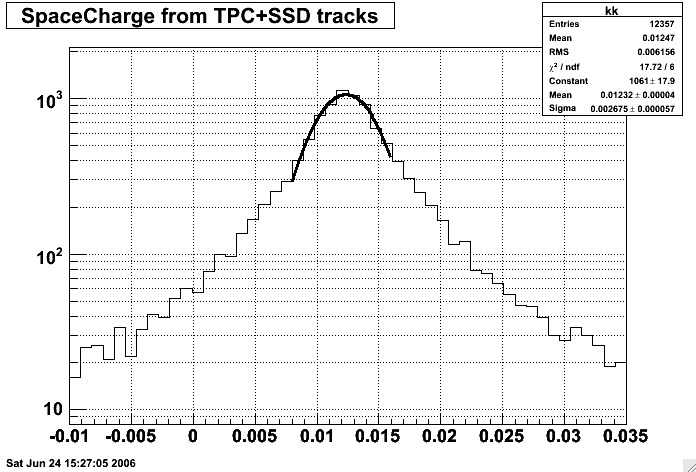
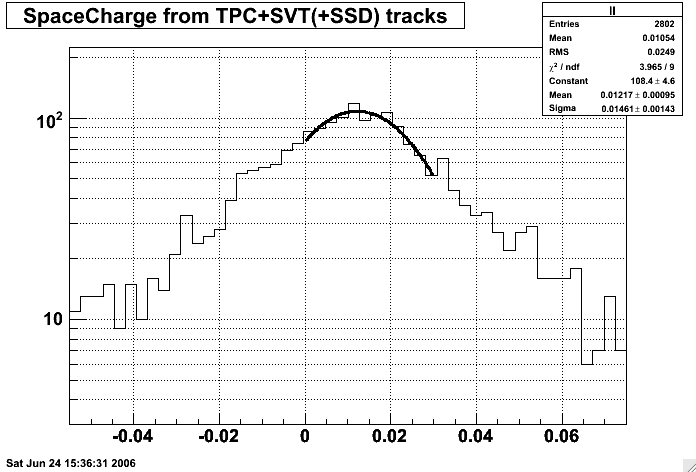
The last important step is to check that these TPC+silicon tracks are beneficial to the calibration process (better than before does not mean beneficial). We can test this by looking at the SpaceCharge calibration that results from an entire file sequence's worth of events to see if tracks with silicon hits give comparable results to the TPC-only tracks. Here are such plots from a single CuCu200 file:
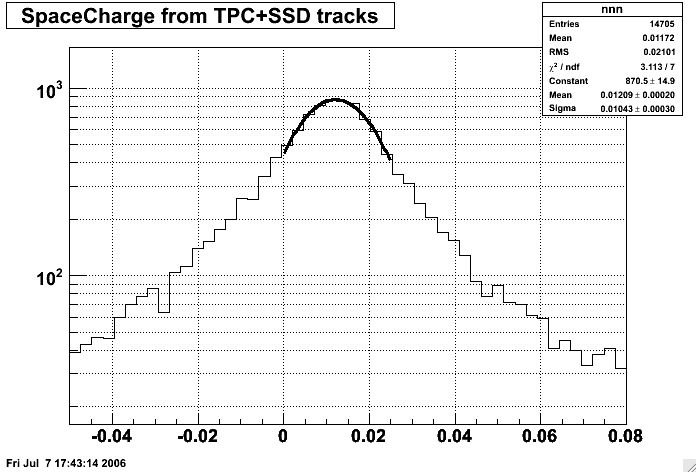
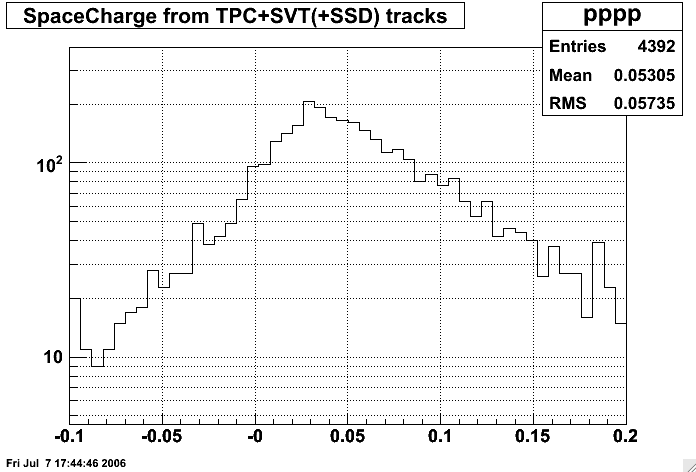
The first plot shows the three distributions atop each other, with TPC-only in black, TPC+SSD in blue, and TPC+SVT(+SSD) in red. The other three plots show fits to the three distributions. It appears that SSD hits on tracks reduce the sensitivity of this SpaceCharge measure, but seem to still find the same answer as TPC-only tracks. However, SVT hits on tracks appear to be VERY detrimental! I am unsure what the problem is, but I have tried a second file (from a different day's run) with very similar results.
Effect of SVT and SSD on SpaceCharge Calibration (wrong SSD errors)
The method of determining the amount of SpaceCharge present in the TPC from the sDCA of global tracks has worked well in the productions where only TPC hits have been used on tracks. With the integration of SVT and SSD hits onto global tracks in ITTF, this method of determining SpaceCharge needs some modification: undistorted SVT and SSD points will pull the sDCAs and modify the relationship between sDCA and SpaceCharge.Without regard to this point, here is a plot which shows the value of SpaceCharge given by StMagUtilities::PredictSpaceCharge() from the global tracks in 25 real CuCu200 events, where I have plotted log(SpaceCharge) vs. log(sDCA). Black points have no SVT or SSD, blue have SSD and TPC but no SVT, and red points have TPC and SVT (SSD or not). Circles represent tracks with sDCA>0, and triangles are tracks with sDCA<0.
Note that the relationship between SpaceCharge and DCA should be linear and track through (sDCA=0,SpaceCharge=0), but the log() function doesn't work for nonpositive numbers, so I have multiplied by the sign of the original SpaceCharge or sDCA to clarify things. It might be a little hard to understand this plot at first, but the sDCA values range from -4.0cm, which is the left end of the upper band, to small negative values, the right end of the upper band, then wrap around as small positive value on the left end of the lower band, rising to a limit of +4.0cm on the right end of the lower band.
We see that, as expected, without regarding the SVT and SSD points in the PredictSpaceCharge() function, the sDCAs of tracks with those points are mapped incorrectly to SpaceCharge in the same manner as TPC-only tracks.
This compares to the following plot of the same data where the undistorted SVT and SSD points are considered in PredictSpaceCharge():
Here we see clearly how SVT points actually tend to reverse the sDCA <=> SpaceCharge relationship. This is because the track now rotates about the highly constrained SVT hit position, instead of freely within the TPC. The SSD points by themselves also tend to alter the sDCA <=> SpaceCharge relationship in the same way, but not so much that the sign of the correlation is flipped.
There are also subsets of tracks for which the general sign relationship between sDCA and SpaceCharge do not hold. These appear to be dominated by tracks which have no hits in the inner TPC, and are rotated opposite to the typical direction caused by SpaceCharge due to GridLeak distortion effects (we believe these were not apparent in the old code because Jim has also improved the helix fitter with the new code, and these probably failed the track-fitting). One solution is to require hits in both the inner and outer TPC for all tracks used. The resulting plot using a minimum of 5 hits in both inner and outer TPC looks as follows:
(Here I have included the linear plot, showing how the log plot better separates the various datasets.)
There are no longer and TPC-only tracks with the reversed sDCA-to-SpaceCharge relationship, but there remain a few tracks with silicon hits which do flip. Examining the topology maps for these shows that they are TPC+SSD tracks with almost no hits in the outermost 10-20 rows of the TPC, or are TPC+SVT+SSD tracks with almost no hits in the innermost 7 or 8 rows; these two circumstances likely still leave the GridLeak distortion to dominate the rotation of the track.
The last important step is to check that these TPC+silicon tracks are beneficial to the calibration process (better than before does not mean beneficial). We can test this by looking at the SpaceCharge calibration that results from an entire file sequence's worth of events to see if tracks with silicon hits give comparable results to the TPC-only tracks. Here are such plots from a single CuCu200 file:
The first plot shows the three distributions atop each other, with TPC-only in black, TPC+SSD in blue, and TPC+SVT(+SSD) in red. The other three plots show fits to the three distributions. It is clear that the tracks with SVT hits do not have as good resolution in determining the SpaceCharge, but that all three sets of tracks deliver fits which are approximately the same. The similarity in the means of the fits is good news, but not quite as good as the numbers make it appear: I have chosen fit ranges that do well at fitting the peak, while the automated fitting mechanism in the calibration code will not optimize the fit to the degree that I have done manually.
In conclusion, the new code does use tracks with SVT and SSD hits in a beneficial manner. While it might be tempting to discard tracks with SVT hits because their resolving power is not as strong, it is pertinent to note that the number of tracks containing SVT hits may not always be as minor a fraction as they are now and may become necessary statistically. Further refinements to the alignment calibration of the SVT may also contribute to improving their resolution to SpaceCharge.
