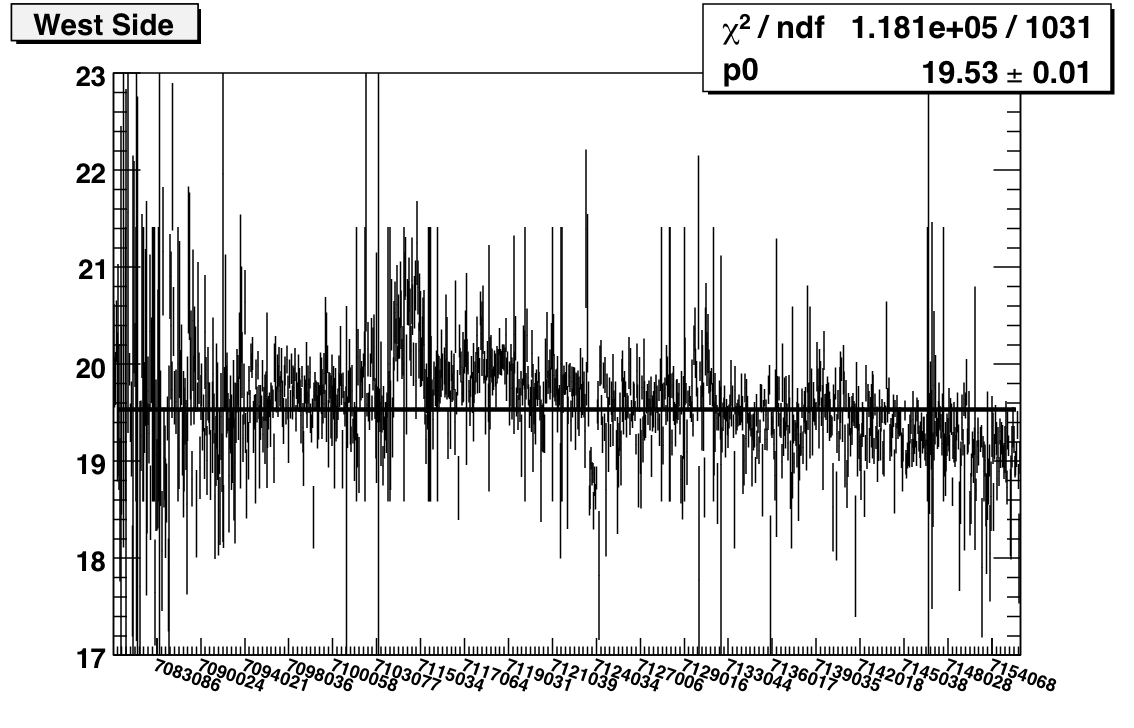
Gain Stability Check
I've updated my codes to do a more systematic investigation of the stability of the gains. Instead of trying to get sufficient tower-by-tower statistics for different time periods, I'm looking at MIP peaks for single runs integrated over all towers. Here's the plot:
Features of note include the bump covering the first couple of days after the shutdown, the bunch of runs on day 123/4 with very low average peaks, and the general decreasing slope (consistent with towers losing high voltage). I also ran this plot for west and east separately:

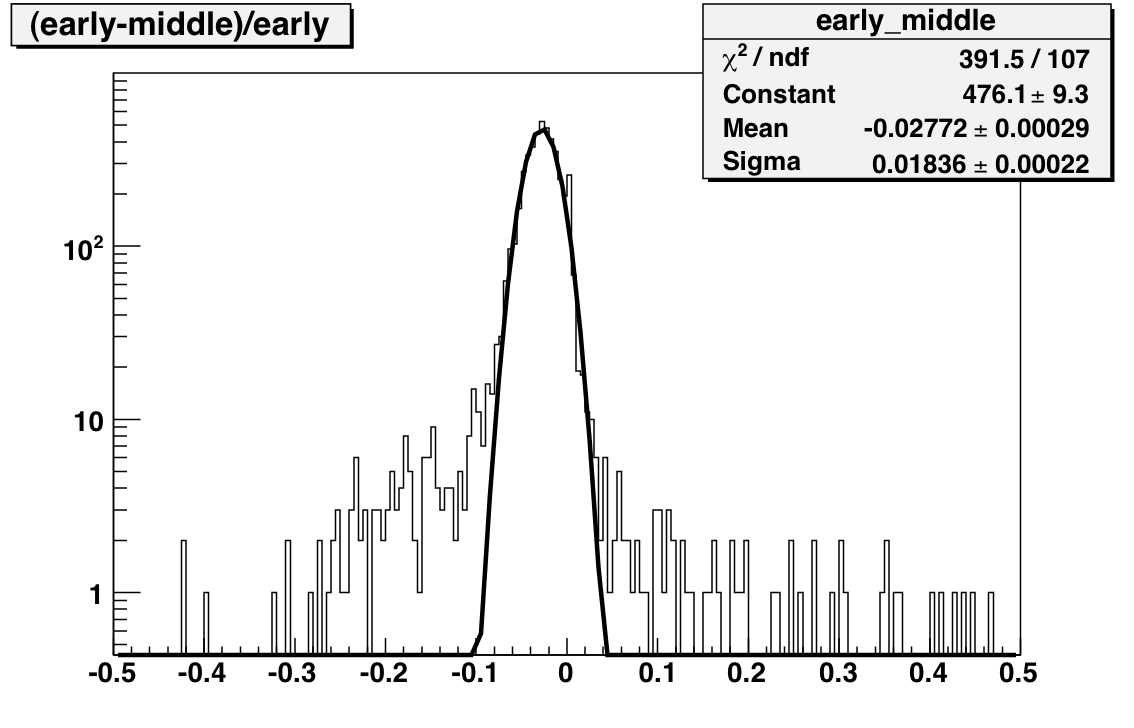
I'm running jobs now to do electron selection instead of MIPs. I think that I can probably still do this as a function of run, but certainly I'll have sufficient stats to plot vs. fill if necessary.
Goal: Compare the tower slopes and MIP peaks from the following three periods to check for stability.
- Day < 104 (97-99)
- 104 < Day < 134 (114-119)
- Day > 134 (134-139)

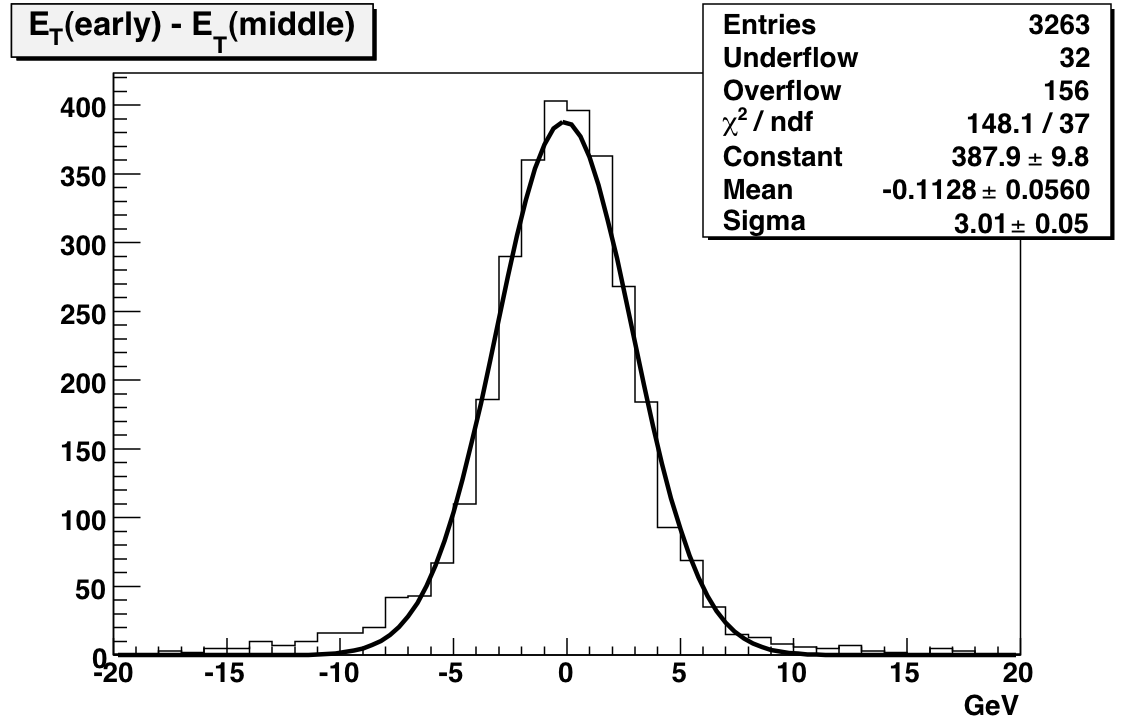
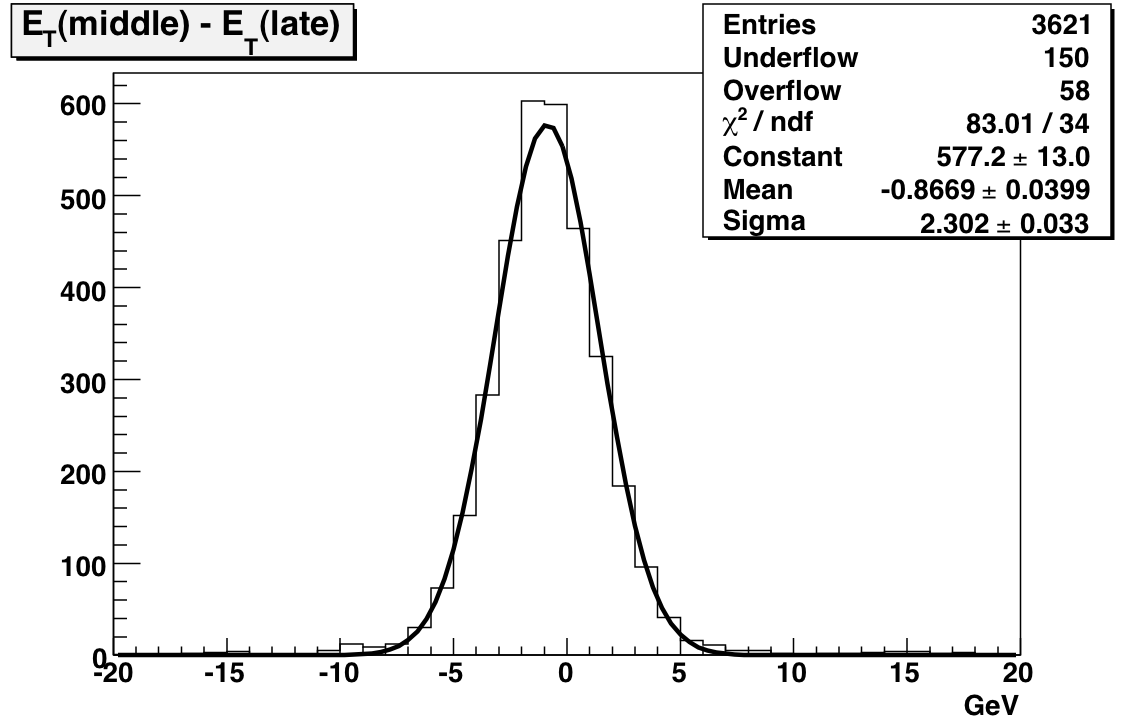
The next set of plots compare gains extracted from MIP peak positions where the MIP peaks are generated using subsets of the Run. Comparing before and after the shutdown yields a mean difference of 110 MeV with a width of 3 GeV. This difference is significantly less than 1 percent. The comparison between middle and late (essentially a comparison between transverse and late longitudinal running) indicates a 1.5 percent drop in the gains with a 2.3 GeV sigma.