Systematic Uncertainty Studies
In the 2003+2004 jet cross section and A_LL paper we quoted a 5% systematic uncertainty on the absolute BTOW calibration. For the 2005 jet A_LL paper there is some interest in reducing the size of this systematic.I went back to the electron ntuple used to set the absolute gains and started making some additional plots. Here's an investigation of E_{tower} / p_{track} versus track momentum. I only included tracks passing directly through the center of the tower (R<0.003) where the correction from shower leakage is effectively zero.
Full set of electron cuts (overall momentum acceptance 1.5 < p < 20.):
dedx>3.5 && dedx<4.5 && status==1 && np>25 && adc>2*rms && r<0.003 && id<2401
I forgot to impose a vertex constraint on these posted plots, but when I did require |vz| < 30 the central values didn't really move at all.
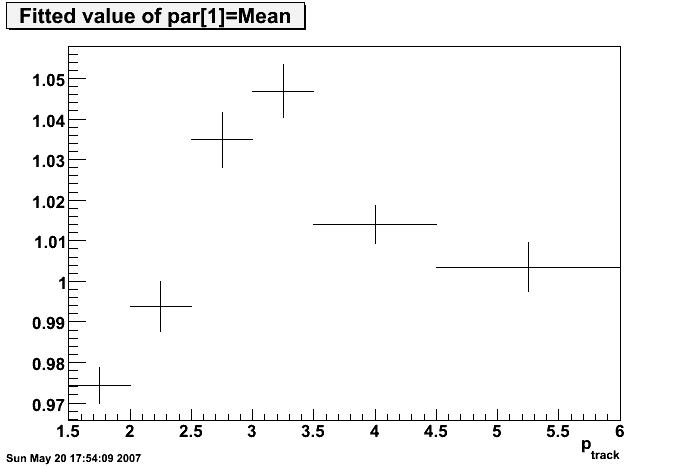
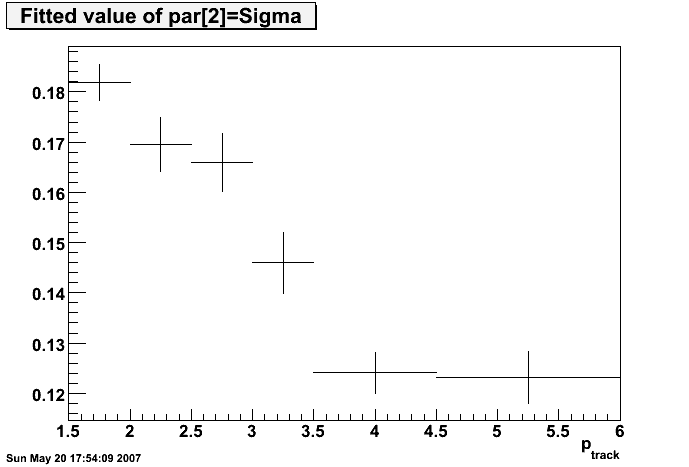
Here are the individual slices in track momentum used to obtain the points on that plot:

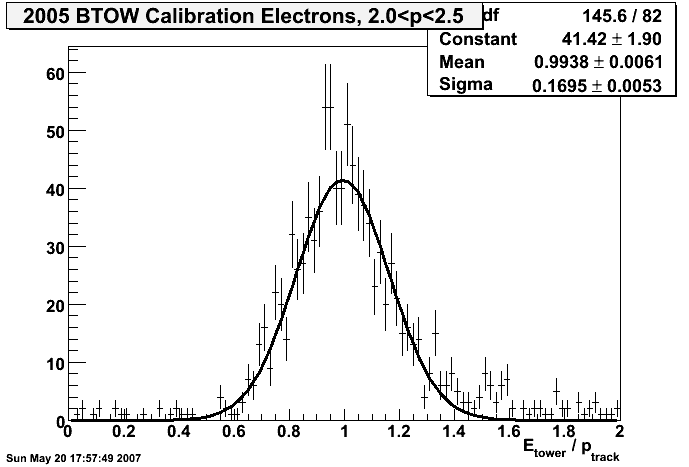

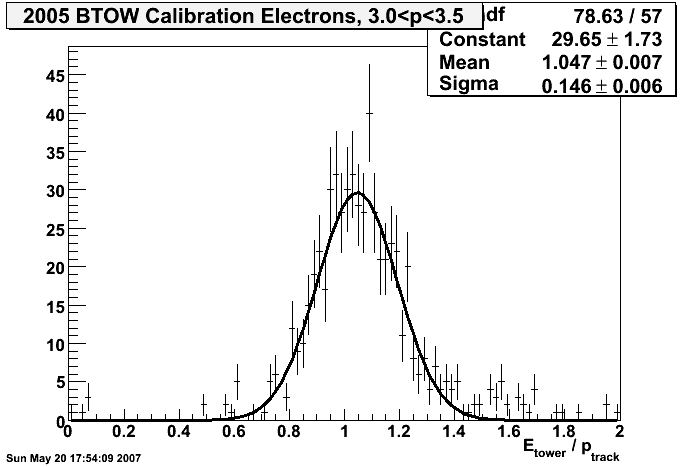
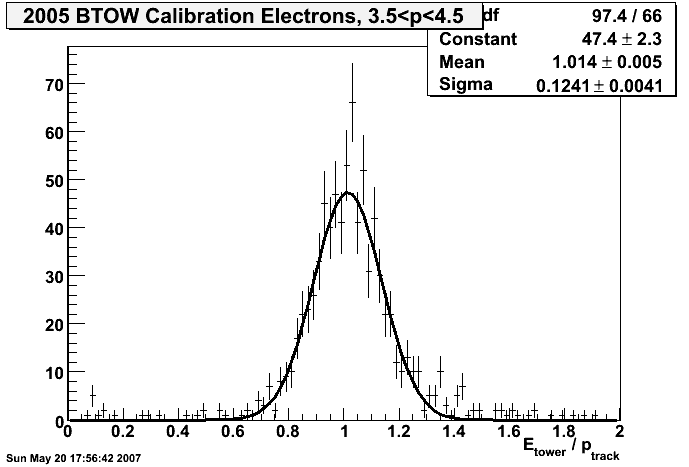
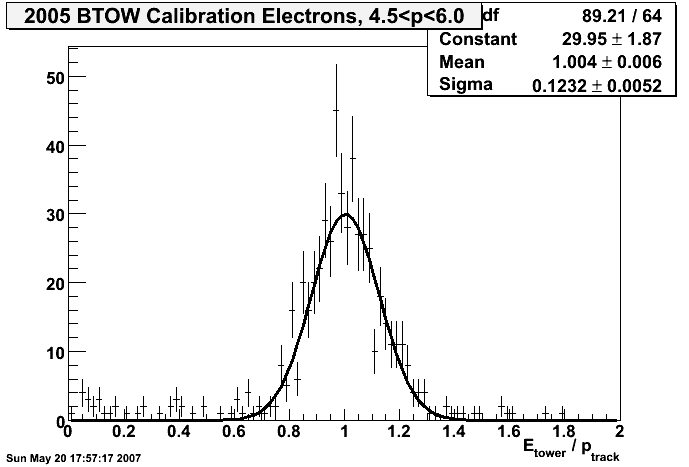
Electrons with momentum up to 20 GeV were accepted in the original sample, but there are only ~300 of them above 6 GeV and the distribution is actually rather ugly. Integrating over the full momentum range yields a E/p measurement of 0.9978 +- 0.0023, but as you can see the contributions from invididual momentum slices scatter around 1.0 by as much as 4.5%
Next Steps? -- I'm thinking of slicing versus eta and maybe R (distance from center of tower).