Update 02.12.2018 -- Run 9 Purity: STAR vs. PHENIX Data
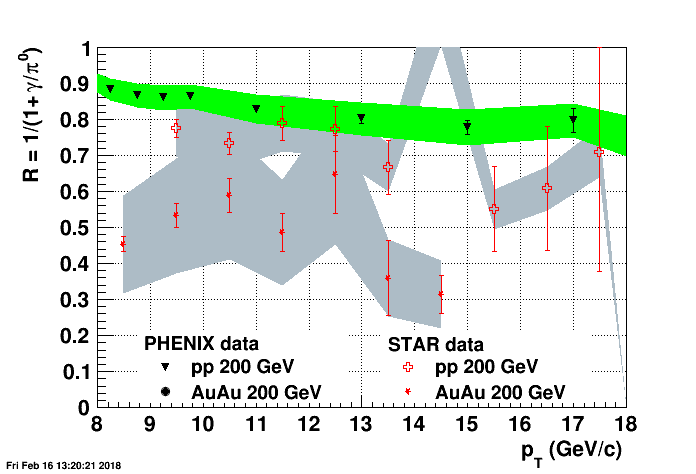
Below is a plot comparing R calculated from STAR data to PHENIX data for a variety of systems. The STAR pp 200 GeV points are "inclusive gamma-rich" triggers as defined in this post:
https://drupal.star.bnl.gov/STAR/blog/dmawxc/update-01302018-run-9-purity
With the primary tracks required to have pTtrk = 1.2 - 20 GeV/c and zTtrk = 0.2 - 0.3. The STAR pp 200 GeV points can be viewed on their own in this post:
https://drupal.star.bnl.gov/STAR/blog/dmawxc/update-02012018-run-9-purity
Update [02.14.2018]: The binning on the plot was incorrect. I've replaced the old plot with the correct plot.
Update [02.16.2018]: The errors on the STAR pp points were incorrect. I've replaced the old plot with the correct one, and have listed the STAR pp 200 GeV (inclusive gamma-rich) values of and their statistical errors below. The systematic errors are 10% of R. The values in the parenthesis indicate the center of the corresponding trigger pT bin.
- R(9.5) = 0.775093 +- 0.024354
- R(10.5) = 0.73303 +- 0.030996
- R(11.5) = 0.789952 +- 0.047095
- R(12.5) = 0.773126 +- 0.062154
- R(13.5) = 0.666607 +- 0.075052
- R(14.5) = 1.1153 +- 0.218406
- R(15.5) = 0.550711 +- 0.117452
- R(16.5) = 0.608274 +- 0.170988
- R(17.5) = 0.709042 +- 0.331934
- R(18.5) = 0.0 +- 0.0 (no statistics)
- R(19.5) = 6.086 +- 15.8734
- dmawxc's blog
- Login or register to post comments