TPC group meetings 2020-
Provide minutes or link to minutes of meetings held.
Earlier minutes from during construction and commisioning can be found on https://drupal.star.bnl.gov/STAR/subsys/upgr/itpc/itpc-meetings/itpc-minutes
Started on 10/14/2020. There are some holes in records
TPC zoom information
Topic: STAR TPC Weekly Meeting
Join ZoomGov Meeting
https://urldefense.com/v3/__https://bnl.zoomgov.com/j/1607439070?pwd=dUdaQnZ4V1E5M2lCYmwvSEFyeTlEdz09__;!!P4SdNyxKAPE!HfprRGhN895eTpdYxf4Ws9N0aUNIIXgrzZkyRocsoiwQ2li2fDgKZ9SogVjH3JdPrxukrc5VW71fdAkFUGM-$ <https://urldefense.com/v3/__https://bnl.zoomgov.com/j/1607439070?pwd=dUdaQnZ4V1E5M2lCYmwvSEFyeTlEdz09__;!!P4SdNyxKAPE!HfprRGhN895eTpdYxf4Ws9N0aUNIIXgrzZkyRocsoiwQ2li2fDgKZ9SogVjH3JdPrxukrc5VW71fdAkFUGM-$ >
Meeting ID: 160 743 9070
Passcode: 654321
One tap mobile
+16692545252,,1607439070#,,,,*654321# US (San Jose)
+16468287666,,1607439070#,,,,*654321# US (New York)
TPC meeting July 31, 2025
Present: Alexei, Jim, Flemming, Gene, Yuri, and myself
== Hardware
— TPC seems to be running okay
— east laser 3, optics are getting burned due to power of laser
— reduced laser power and moved optics
— sector 4-5 needs investigation due to trip (HV module?)
— gas system is working perfectly
— was large storm, caused 4 mbar spike in just few minutes
— gas system managed, did not go into purge mode
== Electronics
— the usual RDO and FEE outages occurring, nothing unexpected
— Tonko fixed large number of issues yesterday during access
— machine is running well overall, but that reduces time to fix things
— fast offline QA reported a strange "hole" in an outer RDO for a single run
— appeared to be off during part of the run
— some drops in ZDC due to leveling device (CAD has fixed it)
== Software
— TPC SC
— Run 25 need half field data calibration
— person identified for this
— Run 24 pp200 low-lumi SC calibration is done for all that is possible
— 1st 24 hrs of running there are no RICH scalars so no easy way to recover it
— will move forward with what is in hand for calibration production and return to the 24 hrs mentioned above
— TFG25e release
— SL24y_TFG25e compared with SL7_AL9
— no significant differences between SL24y 32 and 64 bit nor between SL7 and AL9
— some difference in global tracks between SL24y and TFG25e (due to TPCCATracker)
— differences in primary tracks in is opposite direction (due to restriction on PV in SL24y?)
— difference in PVZ position, seems due to +-25 cm cut in SL
— no significant difference in momentum
— Evaluating information on support cone and structure
— will change radiation length budget
— Will revisit GMT geometry next
TPC Meeting 7/24/2025
Present: Alexei, Jim, Flemming, Gene, Yuri, and myself
== Hardware
— TPC seems to be running well
— further updates may follow on the TPC list
== Electronics
— the usual RDO and FEE outages occurring, nothing unexpected
— Tonko still working (partly on vacation)
— fixing dead electronics when possible
== Software
— TPC SC
— Run 24 pp200 low-lumi SC calibration is done for all that is possible
— 1st 24 hrs of running there are no RICH scalars so no easy way to recover it
— will put everything that's done in the dB and work on getting a calibration production for the rest
— Gene is using the new alignment for this (P24iy)
— TFG25e release
— working on understanding track-by-track comparisons with 32 and 64 bit versions
— also fighting some MySQL versions (Dimitri helping)
— 4.8 GeV FXT with ROOT 6
— some problem reading ROOT 6 files with ROOT 5 (and vice vesa)
— SL24y_TFG25e compared with SL7_AL9
— no differences, software runs as expected on both
— standard and TFG have some efficiency differences for globals, but this is an older problem
— TFG is less efficient than standard for primaries (but not by as much) in same set
— some shift in Z between the two productions, may affect vertex and therefor primaries
— Would like to compare Alma Linux ROOT 5 and ROOT 6
— Yuri has information about support cone and connectors, can check now
— also received information about GMT
Quick update from Alexei on the TPC Hardware & systems:
New 12 pack of gas cylinders have been received and connected.
Midnight crew needs a bit more training on how to tune (and keep tuning) the lasers during each laser run
East Laser optics need maintenance soon. One or more mirrors need to be replaced and then aligned. This will require an access that allows the laser boxes to be opened and no other nearby activity while this work goes on.
Other TPC systems seem to be working well.
TPC meeting 7/17/2025
Present: Alexei, Jim, Flemming, Gene, Yuri, and myself
== Hardware
— Access yesterday
— tuned east laser for more power
— Trips appear to be result of beam dumps
— during very hot days we are running only half field to compensate for difficulty cooling the magnet
— high temp policy seems to be working
— some maintanance work was also done on power supplies
— humidity does not seem to be problem (only about 38% in IFC)
== Electronics
— Tonko was out for a period but restored all RDOs but two that were dead yesterday
— went from 7 RDOs out to only 2
== Software
— TPC SC
SC not yet done for half field so fast offline has wrong SC correction at present
— Run 24 low-lumi p+p now a production priority
— ran into memory issues on the farm
— should be finished soon
— TFG25e release
— versions for SL7 and Alma Linux (with Root 5.34.39 and 6.37.01)
— Alma Linux version required new cernlib (works but need to check how well)
— GEANT 3 geometries were revisited (now with tag z)
— next will run some small samples to do track-by-track comparison between 32 and 64 bit versions
— need more disk space for full sample
— CPU comparison shows significant (25% or better) speed-up with Alma Linux vs SL7
TPC meeting 7/10/25
Present: Alexei, Flemming, Gene, Frank, and myself
== Hardware
— TPC running well
— lasers okay
— looking at gas system long term trend
— gas pressure slowly decreasing, will work to stop current decreasing trend
— checking 6-pack bottles individually
— t-storm this past Tuesday, pressure jump of ~1.5 mbar
— gas system did not go into purge mode
— some sector trips, may want to lower voltage, do not want to change current limit
— could also try lowering voltage by smaller amount (~20V vs 45V)
== Electronics
— high rates and luminosity produces fluctuations in RDOs and FEEs as they fail and are fixed
— down to about 2 RDOs at present (9 is the max so far)
== Software
— TPC SC
— Baoshan working on SC in current run (HLT software)
— numbers are in dB (preliminary for ongoing run)
— Run 24 low-lumi p+p now a production priority
— should be finished next week
== AOB
— Yuri has requested SVT drawings to ensure the support cone is properly represented in simulation
— important for FXT running
— after Yuri finishes shift, will arrange meeting to discuss drawings
TPC meeting 7/03/25
Present: Alexei, Jim, Flemming, Yuri, ShinIchi, Frank, and myself
== Hardware
— FXT running geometry
— check of geometry in 2021 vs 2025 (3.85 GeV fixed target)
— differences visible in reconstructed vs simulated momentum, relative momentum, and others
— effect seems to be due to FST discs
— suggestion is to remove FST discs on west side (during shutdown for ETOF)
— currently 2 possible schedules for ETOF work (each would need ~2 weeks)
— need a developed plan for steps required to extract FST
— how many days, installation support, technicians, periphery, testing (before and after closing pole tip)
— for TPC, a laser PC froze a couple days ago
— needed access for restart
— some new channels with lowered voltage (35 volts down)
— one power dip, recovered without issue
== Electronics
— currently 3 RDOs masked out
— many FEEs, but the number changes rapidly
== Software
— Yuri working on geometry and questions related to FXT running
== AOB
— O+O data set shows some shifts in local Z alignment of BToF with respect to TPC
— could be erroneous drift velocity entries in dB for a few days
— SC correction numbers are another possible cause
TPC meeting 6/19/225
TPC meeting June 19, 2025
Present: Yuri, Alexei, Gene, Flemming
Excused: Richard, Jim
Hardware:
No real issues. Some tuning of lasers and adjusting drift velocity by adjusting methane content.
Yuri sees a few spikes in offline analysis of vdrift. Likely, due to statistics will remove those runs
Electronics. Fairly stable. 2 outer rdo masked out. Remember to have this on list for next maintenance day. Qute from Tonko’s log (June 12)
o TPX S18-4 and -5 masked
problem with power, can’t power-up at the PS
PS needs checking – Tim?
until then – stays masked
In itpc a total of 53 FEE’s off (including one RDO)
Operation:
CAD wants to do gap cleaning when luminosity gores up. Gene alerted ops team that this should be monitored, and be done to minimize the unwanted extra space charge that comes from spray (from ~ 1 musec 10 clock cycles, but SC effect last seconds.) Best to have it done at intervals. Wors with Jeff to setup special runs+analysis (min bias + time ordering of events) to perform the DCA analysis
HLT group member (Bao??) is doing this for initial SCC to be used for HLT and fast offline.
Yuri:
Looking at 3.8Gev (?) de/dx calibration
Investigating some tracking efficiency issues with East tracks (Fix target) possible related to support code material applied in geometry description (geant and STI).
The proposed FXT run suggested to PAC of FXT 4.1 GeV run would need to understand the effect of FST material and support support structure for such FXT running, as this was not present for BES-II running.
TPC meeting 6/12/2025
Present: Alexei, Jim, Flemming, Yuri, Gene, Emmy, and myself
== Hardware
— last Friday, during access
— found TPC blower was not holding humidity (reaching close to 50%)
— AC unit was running but very hot (found no water flow)
— ran backwards flow and cleared an apparent blockage
— now working well, humidity down to about 32-34% (temp stable at ~21 C)
— sector 17 shows some anomalous hot cluster
— visible in level 3 monitor
— not visible in summary plots (not present in every event)
— collider is currently down with problem in cooling circuit
— needs about 3 days to warm-up
— hope for beam on or after Sunday
== Electronics
— recurring issues with some rebooting of TPC electronics
— Tonko is diagnosing
— about 4 RDOs are currently masked out
— also many separate FEEs
== Software
— No SC calibration for the ongoing AU+AU yet
— Mass difference calibration work
— code for analysis will go into analysis note for a paper
— table reported in the file above will go either into the analysis note or onto Drupal
— K0s for calibration of mag field
== AOB
— R. Witt will be out of country for next 2 weeks, will rejoin on July 3rd.
TPC meeting 6/5/2025
Present: Alexei, Jim, Flemming, Yuri, Gene, Frank, and myself
== Hardware
— Tonko working on some lingering RDO and FEE issues
— so far TPC is running well
— DV reached 5.55 yesterday, trying to maintain
— still planning for 1st collisions on June 8th (56x56 bunches)
— magnet trip yesterday
— CID has done some repair work
— magnet has already been returned to half field
— possibly reaching full field today if not already
— TPC air blower has reached high levels (yellow) of humidity
== Electronics
— sectors 3 and 4 noise
— requested pedestal runs and a short run to test after APEX
— will need to repeat exercise
— seems to be a time dependence to the effect (order of an hour)
— shift of about 3 to 4 units in pedestals
== Software
— Monitoring STAR magnetic field scale factor, NMR measurement
— Jim points out that dB values are unreliable for magnet current
— only NMR probe recently installed is reliable
— comparatively stable since 1997-98
— current measurement is only good to distinguish between FF, RFF, RHF, and ZF
— K0 mass is needed for absolute calibration
— need to set constant for all time
— Effect of new TPC alignment on Ks0 mass in 19GeV_2019 data sample
— Compare CPU speed for a reconstruction job on Alma Linux with native build and using apptainer with SL7 build
== AOB
— Magnet tripped 1220 (during this meeting)
TPC meeting 5/29/2025
Present: Alexei, Jim, Flemming, Yuri, Gene, and myself
== Hardware
— TPC is running well so far
— gas system is okay
— some concern about liquid argon delivery
— started circulation mode at only .8 inches of liquid argon
— was resolved with delivery yesterday
— good for at least 80 days
— injection will begin over next few days
— hope for usable events around June 8th
== Electronics
— Still have some difficulties in sectors 3 and 4 (will be masked out)
— two FEE are sending data with same ID (needs to be sorted out)
== Software
— at S&C meeting yesterday
— Run22 SCW file stream moved forward with old TPC alignment
— was due to increase in time of tracking (due to hit errors)
— Spin and CQCD group was asked about usefulness of old alignment vs new
— can look at electron E/p from calorimeter (and TPC) in SCW file stream
— some mild correlation with h-/h+ -> perhaps TPC alignment?
— Gene put Emmy in touch with Temple group to see if a correction can be devised
— Yuri started laser drift velocity calculation
— looks good so far
— Yuri working on calibrations (Run23 O+O and Run23 Au+Au)
— big change in CPU time noted between dev on old nodes and containers on Alma Linux (50% change)
— also noted a jump in dE/dx (measured vs. predicted) on 6/26/2023
— believed to be related to change in methane bottle (different vendor?)
== AOB
— Need two sub samples of 11 GeV reproduction to check which method to use for magnetic field
TPC meeting 5/15/2025
Present: Alexei, Jim, Flemming, Yuri, Gene, and myself
== Hardware
— Cooldown should begin tomorrow
— TPC should be filled with gas Tuesday, May 20th
— Hope for collisions June 1st or 2nd
— TPC is sleeping
== Electronics
— Nothing new to report this week
== Software
— 2023 AuAu200 calibration production finished
— Started O+O from Run21
— Yuri working on 2023 calibration set
== AOB
— Nothing new reported this week
— No meeting next week due to User's Group Meeting
TPC meeting 5/08/25
Present: Alexei, Jim, Flemming, Gene, and myself
== Hardware
— Nothing new to report
== Electronics
— Sectors 3 and 4 showed interesting behavior during cosmics (before run pause)
— Clusters show strange spike due to faulty FEE in each (pedestal changes)
== Software
— Moving forward with 2023 AuAu200 calibration production
— ongoing, maybe finishes by weekend
— O+O from Run21 will be next
— calibration to start next week
== AOB
— Nothing new reported this week
meeting 4/24/25
Present: Alexei, Jim, Flemming, Yuri, Gene, and myself
== Hardware
— Nothing new reported this week
— STAR Ops meeting
—RHIC will return on May 22nd
— start with beam experiments
— magnets have not yet been warmed up (but polarity was changed last week)
== Electronics
— Nothing new reported this week
== Software
— Emmy has finished work on pt corrections based on mass splitting in eToF
— will invite back for summary of conclusion
— SC calibration for beam-beam for 2019-2024 (excluding 2022)
— new TPC alignment produces a small change in signed DCA
— calibration with new alignment shows flat sDCA distributions for all years (< 1 mm)
— will move on to calibration production of AuAu 2023 data for ToF and dE/dx
— Yuri continuing study of magnetic field direction with respect to survey
— some gaps for magnet current data found in 2021 (about 1000 entries)
— comparing MC with real data
— Looking for geometry changes and cuts changes in 2012-2013
— have recalculated neutron flux for 2013 and 2022
— new 2013 calculation is not compatible with old one (~factor 4)
meeting 4/17/25
Present: Alexei, Jim, Flemming, Yuri, Gene, and myself
== Hardware
— Nothing new reported this week
— TPC is in a sleep state
— next week hope to hear more about repair time for RHIC
— current hope is about 3 weeks for repair
== Electronics
— Tonko currently busy with EIC DAQ
— will return to TPC work next week
== Software
— SC calibration for beam-beam for 2019-2024 (excluding 2022)
— AuAu all calibrate very well
— low energy datasets has less SC (may not even need corrections for some)
— corrected some issues with FF numbers
— dE/dx calibration work should be possible next week
— Yuri studying magnetic field direction with respect to survey
— some gaps for magnet current data found in 2021 (about 1000 entries)
TPC meeting 4/10/25
Present: Alexei, Jim, Yuri, Gene, and myself
== Hardware
— Nothing new reported this week
== Electronics
— Tonko said he will begin to repair electronics next week
== Software
— looking for STAR magnet access
— no shifts of TPC found from Alexei's work
— cosmics from Run2025, FF vs RFF seems to show something that still looks like a shift
— want to better understand actual position of STAR magnet
— Work on SC
— BESII Run 23 and 24 work
— cluster of runs in Run23 that would note produce a calibration result
— pileup cut was vertex match between TPC and VPD vertices
— VPD issue and 1/4 of ToF in first weeks of Run23 (due to clock issues) was culprit
— somewhat of a sidetrack to look into timing there
TPC meeting March 27, 2025
Present: Alexei, Jim, Flemming, Yuri, Gene, and myself
== Hardware
— some laser problems
— east laser failed upon attempted start
— replaced lamps and now is working
— last set of spare lamps has been used
— east and west are now very good
— east laser now needs to be tuned each day
— trigger all okay for now but need to check cables if problems arise again
— if not drastic loss of TPC gas, should have enough methane to last until mid-July
== Electronics
— Unusual feature after magnet trip
— large noise on sectors 3 and 4 (inner only)
— by Tuesday the unusual peak was gone but still noisy
— by Wednesday it was all gone
— seemed to be positively affected by pedestal runs
— not well understood yet
— looking for diagram of connections with gating grid (one possible interaction)
— HV on sector 11 (most outer) is running at 1100 V rather than 1300
— shows-up as reduced number of tracks in last 8 rows
== Software
— need to get beam-beam data sets calibrated
— Work on SC
— 3.8 FXT high lumi was done by Gene
— low lumi was low enough that no SC correction was needed
— other data sets that don't need SC calibration are ready for dE/dx and so forth
— Yuri
— dE/dx pp500 Run22 is considered finished
— some pt resolution difference (1% at 1 GeV) noticed in new alignment vs. old alignment (pp500)
— GMT cosmics (old alignment vs new alignment); several mm differences noted
Geometry still only in CINT files, Not DB
Timeline for usage of information unclear.
— new TFG25c released for Alma Linux
— also working on iTPC RDO geometry
TPC meeting minute March 20, 2025
Present Yuri, Alexei, Jim, Gene and Flemming
Hardware
- TPC works well
- Issue with Lasers
o Laser is a bit weak
- There is clearly something wrong, the rate during laser runs is ~40 whereas it should be 10. Since the run was stopped after 4k events the statistics for the analysis of laser data and drift velocity thus has too small statistics, and unsatisfactory accuracy according to Yuri.
- Alexei confirmed he would look at this when we gain access to the hall.
Electronics
Electronics in pretty good shape.
FV preparing QA macro for the ongoing runs with help from Gene. Some issue with have TPC QA histograms filled for cosmic data
Software
Gene is working on the high lumi FXT data for the new alignment. The results indicates a slight different slope on correction vs lumi measure , and with different offset. The offset change is not unexpected due to different alignment.
Yuri working on de/dx calibration for run 22. Different from BES-II is the importance of voltage sag and accumulated charge for the high luminosity pp 500 run. Sees de/dx of 7.2% for the standard candle (i.e. pathlength)
Also working on GMT calibrations.
Work hampered by getting too little cpu despite run in native alma9 mode on the farm.
TPC meeting February 27. 2025
Present: Aihong, Jim, Flemming, Yuri, Gene, and myself
== Hardware
— water leak when pole tip was closed
— pole tip was re-opened
— no voltage was on and the leak has been capped
— pole tip has been closed again
— magnet testing to come
== Electronics
— Tonko still needs to run pulses calibration
— will do once magnet testing and crash testing are done next week
== Software
— Work on SC
— R. T. will be departing in a couple months
— Gene will handle what he can but work will mostly be on hold until someone arrives
— last few jobs of pp500 dE/dx calibration done
— Yuri has already started work on it
— need confirmation that dE/dx for run 21 3.85 GeV FXT data is ready
— Yuri believes that's done but will cross check and notify
— Yuri sees lower dE/dx resolution 7.5-8% (usually around 5%) in pp500
— investigating
— Yuri continuing work on GMT
— checking alignment using cosmics and data from 2019-2024
— some discrepancy, but need to understand why
— KFParticle PR (no VC files)
— originally could not pass GitHub compilation test
— has been sorted-out (was Root6 implementation problem)
— PR has been accepted
— also problem due to missing flag with packages not in PR
— nightly test build was stopped
— will be discussion at collaboration meeting next week
== AOB
— Collab. Meeting Next Week, then RW will be away the following week
— Next TPC meeting will be March 22nd
TPC meeting Feb 20, 2025
Present: Alexei, Jim, Flemming, Yuri, Gene, and myself
== Hardware
— east pole tip has been closed
— blower hoses installed
— cathode checked for shorts (none found)
— finished east laser alignment
— couple mirrors changed
— flash lamp does not require optics adjustment so can be done after pole tip installed
— Tonko finished with both sides
— tomorrow will again attempt to change battery in TPC gas UPS system
— was prevented by rain last time (too wet to safely try)
== Electronics
— talked to Tim on Friday
— sector 22 on east had one RDO changed; one FEE had to be disabled.
— all else is done
== Software
— Yuri continuing work on GMT
— has version with GMT hits in MuDST
— running few million cosmic events
— looked for difference between 2016 and now
— want to do another pass with 2018 data (14 and 19 GeV)
— 14 GeV assumes no SC correction needed
— can then check 19 GeV (which is much lower statistics, only ~1000 matched GMT tracks)
— will discuss any differences
— New pull request for KFParticle with no VC
— new ticket submitted
— stuck in test stage (cancelled), unclear why [ it did not compile under root6 according to Smirnov]
TPC meeting Feb 6, 2025
Present: Alexei, Jim, Flemming, Mathias, and myself
== Hardware
— everything ready
— some small remaining work on east laser
— one spare TPC HV supply
== Electronics
— one remaining issue with sector 22 RDO 2
— Tim working on it in the lab
— pole tip expected to be closed on Feb. 20th
— integration of 2 TPC NMR probes into software for simulation
— symmetrically located around 6 o'clock and -7 o'clock
— disk is oriented with plane parallel to beam pipe
— should revisit discussion when Yuri returns
TPC meeting January 30, 2025
Present: Alexei, Jim, Gene, Emmy, and myself
== Hardware
— working on east laser
— poletip to be closed about 20th of Feb.
— gas system has enough methane and argon for run
== Electronics
— Tonko mentioned some problem with sector 24
— two side-by-side RDOs, one was less efficient at reconstructing hits
— no obvious correlations, unclear why one RDO is less efficient
— still under investigations
— Flemming working with Isaac Mooney to produce some automated QA for TPC
— Gene helped setup in FastOffline
— was a great help last year, much less work for Flemming during run
== Software
— Gene working on dE/dx production for Run22 pp500
— some discussion of twist (ExB) correction
— Emmy's work on mass differences
— see slides sent to list
— looking specifically at vertical track mass difference
— some definite improvement after sector alignment work
— some irregularities in m^2 vs pt in edge plots
/fv On sector 24 -rdo 4. Tim has upped the Power voltage a bit on RDO 24-4 (itpc),
Tonko will test it with pulser runs. It was us/I who asked tim to look at it, since fast offline found the problem during the auau run.
Isaac wrote part of the TPC fast offline QA 2 years back. I want to fix some mistakes, and add some histograms. Gene is helping me with the github procedure needed, and scripts needed to test these.
I am working to further automate the QA done during the run.
/YF
The production for Run22 pp500 does not have *event.root files, and thus it cannot be used for dE/dx calibration.
See, for example,
/star/data113/reco/production_pp500_2022/ReversedFullField/P24ib_calib/2021/355/22355023/
TPC meeting January 23, 2025
Present Emmy Yuri, Gene Flemming, Aihong
Excused: Richard, Jim
Software:
Space charge todo – Gene
Yuri- GMT code not in repository has to be moved to repository by Gregory.
Waiting for this to complete so he can add the GMT infor to putput files (mudst and picodst)
Emmy presented a short update on centrality dependence of mass difference
See slide 3 and 4. Statistics insufficient outside +-30 cm
Gene: maybe some influence by vertexfinder (minuit) relative to beam line
AOB
Production run 19 going, Ask Yuri to check de/dx . Does not see issues.
Yuri will be gone for next two weeks.
Emmy’s updated file on https://drupal.star.bnl.gov/STAR/subsys/tpc/tpc-group-meetings
TPC meeting 1/15/2025
Present: Alexei, Jim, Yuri, Gene, Mathias, Emmy, Aihong, and myself
== Hardware
— current plan is to go forward with destructive decommissioning (TPC and others)
— gas shifts expected to start March 11th
== Electronics
— Tonko says west side is done (all working)
— needs a couple more weeks for repairs on east side
== Software
— Emmy's work on mass differences
— see ???
— looked at vertical tracks now (eta < 0.1)
— very little pt dependence
— some small, maybe 3rd order, polynomial behavior with Vz
— will try once more with pileup removal, and perhaps multiplicity dependence
— Yuri mentions that because we know current distortion (sag), we can use correction to correct Emmy's 2019 data
— see Yuri's blog; TPC alignment, alignment by sector (alpha, beta, gamma)
— Yuri points out that new alignment model uses circular assumption for OFC along z
— but we know about sag, so near membrane their should be an additional term
— Addressing difference in dE/dx observed for 19GeV_2019 using MySQL and CINT tables.
— problem has been found
— requires disactivating two older calibration, problem has been fixed.
— dE/dx 3p85GeV_fixedTarget_2021 calibration has been done,
— put in MySQL, and now MySQL version of calibration table has been verified with TFG on AL92
— unknown how to run SL24iy on Alma Linux as of yet
— KFParticle without Vc has been released by Maksym Zyzak on 12/16/24
— this version has been put in star-sw as PR#722 3 weeks ago (https://github.com/star-bnl/star-sw/pull/722):
— KFParticle was introduced in STAR libraries 14 years ago (Thu Apr 15 22:49:12 2010 )
— based on old Vc (0.4) library version.
— new development in KFParticle was based on the latest version of Vc (0.7+)
— does not compile with old Vc with standard STAR library
— Almost 50% of strange particle and all charm and hypernuclei analyses are based on upgraded versions of KFParticle
— different TFG release and private Maksym's codes
— FIAS group (M.Zyzak and Co) has promised to provide KFParticle without Vc library, based only on include files.
— This version should allow to standardize KFParticle based analyses.
— Mathias claims (Slide 14, - Presentation from Mathias Labonte) that hard coded dead region due to Gating Grid creates a problem with matching embedding and data near gating Grid.
— Requires fix in TPC geometry (eliminate dead region due to Gating Grid).
— Jason has removed the hard coded dead regions from TPC geometry (https://github.com/star-bnl/star-sw/pull/723)
— There are some claims that BTof alignment has problem for fixed target. https://drupal.star.bnl.gov/STAR/system/files/QualityAssuranceFor3p9GEV.pdf
— Gene talked about this (https://drupal.star.bnl.gov/STAR/event/2025/01/15/SC-Management-Meeting) yesterday.
— P Pbar Tof mass splitting for 19GeV_2019 is still questionable.
— Yuri believes, that for daq5k (2022-2025) data sample GMT information will be very valuable.
— GMT code provide by Grigory & Co. does not have GMT information propagated to the level of (Mu|Pico)Dst.
— This information has to be added. Yuri is working on this.
— SC calibration for beam-beam data in BES-II
— this is to check calibration with new TPC alignment in place
— Run22 pp500 calibration production is being worked on to produce a sample for Yuri
TPC meeting December 19, 2024
Present: Alexei, Jim, Yuri, Flemming, Gene, Mathias, Emmy, Frank, Grazyna, Aihong, Tommy, and myself
== Hardware
— started work on east laser, changed lens and will work o n alignment
— quiet time is next week so, nothing can happen next week
— some further discussion about plans for TPC removal will take place then
— general plan is a destructive decommissioning of TPC
— group should consider over break if there are alternatives or interested parties
— Frank will help reiterate the notification to the STAR Council and, possibly, to the external community
== Electronics
— Tonko is done with west side
— RDO 4 in sector 24 issue was not communicated
— inefficiency in rows across 3 and 4
— will notify Tonko and investigate
== Software
— looking for methods to speed-up production with new alignment
— at present, it is likely we will proceed with old alignment, at least initially
— STW stream Run 22 pp500 will be first
— dE/dx calibration production is needed first
— other streams of Run 22 pp500 have additional needs so there may be time for further assessment of speed-up possibilities
— Comparisons of embedding and data with P24iy
— nHits are about 40% lower in embedding than in data near target rapidity
— perhaps TPC length not properly taken in to account?
— DCA ratio shows data about 25% higher than embedding
— FXT analyses often use DCA<1 cm to reject pile-up (from vertices > 5.5 cm away)
— lower pt tracks show some differences, ~20%, with embedding
— with an added nHits cut, agreement is good mostly everywhere _except_ target rapidity
— compared to October 2023 results, the problem around target rapidity has gotten worse
— with more pure pi+ sample, the nHits discrepancy at target rapidity improves, but some problem shows-up at low momentum
— Yuri asks for comparison of embedding between previous embedding and current embedding
— also check that new grid leak correction is on
— suggestion is also to compare pi- rather than pi+
— would need a new sample of test embedding
— Gene commented that the event by event T0 has very little effect
— Matter-AntiMatter Differences and Spatial Distortion
— comment that the phi dependence is partly a result of sag of OFC
— comment that there are multiple and higher order effects in distortions
— attempt to deal with them on average
— but some higher order effects may be responsible for eta or z-dependence
— request is to have study of straight-up tracks (radially outward) so as to eliminate z-dependence
— any remaining z-dependence would indicate presence of some other contributing distortion that does depend on z
— Yuri testing dE/dx calibration samples
— no difference so far
— having trouble pushing jobs through with SL24y
— new version of KFParticle without VC-library
== AOB
— Next meeting Jan. 9th 2025.
TPC meeting December 12, 2024
Present: Alexei, Jim, Yuri, Flemming, Gene, and myself
== Hardware
— finished with TPC and ToF gas system recovery and recalibration
— will start work on lasers next week
— will change lamps on east laser, do alignment, check power
== Electronics
— all RDO repair work done on west
— 5 bad RDOs on east
— some FEEs will need to be masked due to power consumption limits
== Software
— data from AuAu 19.6 GeV from 2019 was processed into calibration sample
— was some concern about SC contributing to that
— was reprocessed without SC to check effect on mass splitting
— h-/h+ result with and without SC show very little difference
— expectation is no effect would be observable on mass splitting due to SC
Expectation is no asymmetry in east-vs-west effects on mass splitting due to SC. I do expect that without SpaceCharge, the mass splitting effect should get worse on both sides and become luminosity dependent.
— similar results from 14.5 GeV
— sector by sector fluctuations are likely not due to SC, more likely alignment
— these results are not sensitive to global improvements (or detriments) to the TPC
— dE/dx calibration for 19.6 GeV and fixed target sample
— iteration requires 2-3 days (due to CPU issues)
— need one more week
— HTR CPU sees increase in CPU time for processing
— with new hit errors there is a refit that produces some increase
— two times more iteration is required with new hit errors to ensure change in parameters is with 10% of sigma
— these effects produce increase in CPU time
— some time required to decide on response
— on average hit errors are factor 2 smaller in parameterization than old
— see link in most recent S&C agenda for presentation with more detail
— 14.5 GeV
— we should check mass splitting of protons in this set
— some eta dependence in fixed target data for pull (relative q/pt)
— see https://www.star.bnl.gov/~fisyak/star/muMc/2019FXT
— TFG software installed on new system
— queueing system is running on new system
— would like to have software functioning on that system as well
Dec 5 cancelled due to BES-II analysis meeting
NOV 29 canncelled due to Thanksgiving
TPC meeting November 21, 2024
Present: Alexei, Tommy, Yuri, Flemming, Gene, and myself
== Hardware
— TPC gas system recovery is proceeding
— still working on ToF gas system (may be some small leaks)
— participating in discussion for removal of TPC from magnet
== Electronics
— Tonko says about 40% of TPC electronics have been repaired
— by Dec. 10th should be ready to close both pole tips
— Tim and Tonko have a running log of repairs where one can follow status
== Software
— 19.6 GeV AuAu SC calibration has been finished and included in the dB
— tested running calibration running with and without new alignment
— SC calibration was identical either way
— implies integrated effect of alignment over all of TPC has negligible impact on SC calibration (at least at low luminosity)
— started calibration production for BToF and dE/dx for 19.6 AuAu
— some files ready for examination
— P24iy_calib production
— RCF wrt TFG24e HLT average
— RCF has a factor of ~2 more events than HLT. 3p85GeV_fixedTarget_2019 (~40k)
— statistics has to be increased by a factor of 4.
— a bug found in Db entries for TpcAvgPowerSupply tables (~100 entries per Run, ~5% of statistics).
— Averaging has been done for whole run time period, however, sometimes the TPC anode Voltage decreased before run was stopped. The averaging bug has been corrected.
— Flemming and Alexei have asked for sample occurrences with timestamps to understand exactly what's happened.
— dE/dx calibration has started. There is significant (~2%) difference with respect to HLT calibration.
— Collider data (19 GeV) with new alignment shows the same trend as seen with fixed target data
— K0s width has reduced from 7.21 to 6.75 Mev (~7%) and signal to background ratio increased 0.38 to 0.41 (~9%)
— Yuri is working on speeding up of MDF errors calculations.
— TFG24f release with the latest Maksym Zyzak update of KFParticle and StKFParticleAnalysisMaker has been built
— TFG24g release with Yuri's updates to StKFParticleAnalysisMaker is coming.
== AOB
— No meeting next week (Thanksgiving)
— R. Witt will not be able to attend the following week (Dec. 5th), will rejoin Dec. 12th
TPC meeting November 14, 2024
Present: Alexei, Mathias, Jim, Emmy, Yuri, Flemming, Gene, and myself
== Hardware
— plan is for Yuri to meet with Alexei this week or next (due to illness)
— continuing to run gas system recovery
— preparing for measurements locating TPC relative to magnet support
— many precautions now needed for work in hall
— should start TPC location measurement work next week
— discussions have been initiated regarding how to remove the TPC from the magnet
— no shorted rings to worry about from previous run
== Electronics
— Tonko and Tim working on west side
— found several bad cables (some can be changed)
— possible that run may start in early March (rather than late)
— current proposed end date for run is October of 2025 (or later?)
== Software
— BES-II data Au+Au 19 GeV collision data is now a priority
— some calibration done using new alignment
— event.root files exist if Yuri want to examine
— 19.6 GeV Au+Au from 2019 is also a priority
— Gene started SC calibration for that
— some portion has different RICH scalars
— ran calibration with dev and with new alignment (SL24)
— no noticeable difference in SC calibration result
— good news for BES-II work
— Run 22 p+p 500 may also be good with regard to SC even if we use new alignment
— Mathias looking at several comparisons between TFG24e and the new alignment test production
— has requested a small embedding production for study
— Emmy looked at delta-m/m vs <Z> with and without tracks that cross the central membrane
Presentation
— now have 1/pt dependences and eta dependence
— eta plot shows interesting difference in structure between positive and negative eta
— Gene did an
additional study using h-/h+ and got a beautiful correlation with Emmy's results
— comparing the studies suggest that Emmy is seeing alignment artifacts
— allows the possibility of a new method of correction for distortions due to sector alignment
— should also look at newer data and understand how the new alignment impacts the work
— Yuri working on dE/dx calibration sample
— cluster is very slow at present
— some runs have fluctuating voltage (average is down by ~300 V)
— new KFParticle release (TFG24f)
— Maxim did some clean-up on the code
— some interfaces changed
— also added some indications in KFParticle finder
— added projections to cylinder
— also has new STKFParticleAnalysisMaker
— plans is to reintroduce header files (remove VC files)
== AOB
— Flemming added Emmy to the TPC list
TPC meeting November 6, 2024
Present: Alexei, Mathias, Jim, Emmy, Yuri, Flemming, Grzyna, Tommy, Gene, and myself
== Hardware
— some new rules about work in hall
— have not been able to redo TPC movement measurement
— need second person in hall
— Yuri will join next week to accompany Alexei
— working on gas system
— also working on laser alignment
— west laser okay
— east laser is weak and needs some optics replaced
— next week will mostly be devoted to east laser repair
== Electronics
— Tonko and Tim continuing work on RDO recovery
— question about sPHENIX TPC performance
— Flemming mentioned there was a dE/dx plot in PAC meeting presentation
— Yuri mentioned there was an ADC plot that was called a dE/dx plot
— Gene mentioned they are facing an issue with low cluster charge in Au+Au (but not in p+p)
added: this was a fct of drift distance
— perhaps related to contamination
== Software
— Run 22 p+p 500 SC
— nothing new for this week on SC
— BES-II data Au+Au 19 GeV collision data is now a priority
— need to look at effect of new alignment there
— need to do SC calibration for this sample and produce a dE/dx sample
— The production of 4p59GeV_fixedTarget with TFG24e continues. Now we have ~120 M event.
— TFG24f release has been done. This release includes cleaned by Maxym Zyzak KFPaticle and StKFParticlAnalysisMaker.
— TFG24g release will be next, including some modification with respect to Maxym's version of StKFParticlAnalysisMaker.
— To address Mathias's plot for deuteron Yuri showed ( https://github.com/fisyak/star-sw/blob/TFG/macros/Proton.C )
— η dependence deuteron peak position can be explained by energy loss in beam pipe, IFC, and TPC gas.

— Mathias looking at several comparisons between TFG24e and the new alignment test production
— some anomalous concentrations in positions of first and last hits
— primary vertices found all the way across the TPC in Z
— vertexing may still be relying on some collider mode settings
— interesting fall-offs in global tracks with >10 hits that are called primaries compared to global tracks with >10 hits
— Emmy looked at delta-m/m vs <Z> with and without tracks that cross the central membrane
— previously observed w shape became more exaggerated rather than less
— not currently understood
== AOB
— Nothing new from this week.
TPC meeting October 31, 2024
Present: Alexei, Mathias, Jim, Emmy, Gene, Yuri, Flemming, Grazyna, Sonoraj, Aihong, Daniel, and myself
== Hardware
— started gas system recovery
— TPC currently in nitrogen flow (after purge), about 80 l/min
— most sensors are off
— started with dryer, then cooling down
— lasers: west looks okay, east has several mirrors damaged (and intensity is not very high)
— may want to change mirrors inside box
— will discuss further with Yuri how to measure TPC movement
— during sensor install noticed that TPC was already at limit
— will make another measurement with more accuracy
== Electronics
— Tonko and Tim are doing inventory and status checks
== Software
— Run 22 p+p 500 SC
— nothing new for this week on SC
— Mathias looking at test production with new alignment
— checked with and without 2 cm shift in proximity cut for z-axis to account for FXT target location
— have also noticed excess of forward rapidity tracks with decreasing energy (opposite expected)
— amounts to ~10% more tracks in forward rapidity in test production
— may want to request a test embedding sample with the new alignment
— Gene mentioned that with the 2 cm shift, we may need to tighten the 3 cm primary cut to avoid tracks from beampipe
— there are also z-cuts and ToF matching cuts used
— Emmy looking at matter antimatter mass differences for tritons, He3, and He4
— general agreement between protons and kaons
— some azimuthal variation visible even in proton and kaon mass comparisons
— difficult to see in pions due to difficulty of measurement itself
— similar variation in eta
— perhaps a static field issue?
— Gene mentioned a possible cross-check to identify TPC sector alignment
— also, there is a suggestion to exclude tracks that cross the central membrane
— Gene mentioned that using new chain option cause jobs to take longer in tracking
— potentially doubles in time
— needs to be understood
— Run 22 pp500 SC was waiting for new alignment, but may need to move forward with production is this increase in tracking time cannot be resolved in reasonable time
— if we proceed with calibration production without new alignment, SC would be considered already done, dE/dx would be next
— Yuri has finished dE/dx calibration with new TPC alignment, using BES-II fixed target data available on HLT farm.
— see: https://drupal.star.bnl.gov/STAR/system/files/RunXIX_XXI_fixedTarget_dEdx.pdf
— Yuri has also started 4p59GeV_fixedTarget with TFG24e which includes new dE/dx calibration and adjustment vertex seed cuts
— see /gpfs01/star/data25/TpcAlignment/TFG24e/2019/RF/4p59GeV_fixedTarget/
— So far it has been processed ~31.983M events.
— The kfp Analysis is coming.
TPC MEETING October 10, 2024
Present: Alexei, Mathias, Jim, Emmy, Zhangbu, Frank, Gene, Yuri, Tommy, Grazyna, and myself
== Hardware
— most things going well
— several RDOs bad
— access tonight (primarily for sPHENIX), beam after midnight
— tried 111x111 last night, failed so returned to 56x56
— drift velocity has recovered (trending up toward 5.5 cm/us) since adding slightly more methane
== Electronics
— Tonko may be able to repair some boards today depending on schedule
— anything done will be reflected in the log book
== Software
— Run 22 p+p 500 SC
— waiting on new TPC alignment
— Emmy looking at mass difference between light nuclei and light anti-nuclei
— asymmetric effect of SC on charge signs is important to her analysis
— looked at difference in mass^2 for protons from isobar dataset
— clear difference in mass^2 observed over pt which even diverges with increasing pt
— apply a correction based on assumption of inaccurate momentum measurement
— momentum inaccuracy taken to be proportional to momentum
— new correction works well out to about 2.5 GeV/c
— may need to look at dependence on Z position of the tracks
— another suggestion is to look at dependence on azimuthal position
— need someone to also look at other datasets to see if same effect is there
— perhaps also look at luminosity dependencies
—
— TFG24d
— going forward with dE/dx calibration production from HLT farm in meantime
— next is to go forward with new alignment and check other data samples
— Gene noted that calibration production usually comes after distortion corrections have been applied
— calibration production for fixed target could happen immediately
— other (non-FXT) sets will need distortion correction pass first
== AOB
— some discussion of increase in hit errors fro 2016 Au+Au
— question of relative benefit attributable to increased errors vs inclusion of more noise
— increase in hit errors serves to include hit in pattern recognition during track finding
— but because errors are large, the tracks are not unduly distorted
TPC meeting October 3, 2024
Present: Alexei, Jim, Grazyna, Frank, Gene, Flemming, Yuri, Daniel, and myself
== Hardware
— things look good
— some small decreased in drift velocity
— added more methane
— timing of Au+Au run still under some discussion (meeting yesterday)
— sPHENIX requested 6x6 bunches
— discussion of parameters took place (do we support crossing angle or no crossing angle)
— Gene says we need conditions like we will use in regular running
— field cage currents should be checked (however weather has been dry so no strong concern)
== Electronics
— Flemming showed summary of Run 24 p+p iTPC running
— see Flemming’s Drupal Blog
— RDO outages reach approximately 15% in iTPC
— 4 RDOs in TPX are probably unrepairable (similar number in iTPC) for various reasons
— probably need a dedicated meeting after the run to discuss what can be repaired
== Software
— Run 22 p+p 500 SC
— 245 out of 247 fills have been calibrated (last 2 don’t have enough runs, used neighboring fills)
— waiting on new TPC alignment
— analyst in lfsupc group has been tweaking distortion corrections based on mass^2 between p and pbar to correct
— will ask analysts to join future TPC meeting to discuss
— TFG24d
— going forward with dE/dx calibration with new alignment and now producing on HLT farm
— will calibrate, with help of Rice BTOF group, dE/dx
— once returns from Germany, will produce fixed target data using test production based on available disk space
— Frank has questions about status of answers to pull request questions
— in particular, what is the effect of including hit sharing in the new TFG release
— Yuri has code that is running to check effect of change in hit errors
— hits with flag 2 (deconvoluted hits from Tonko) have their errors increased by factor of 4
— explains why test production has about 10% more K0_S than P24ia
— increasing hit errors for deconvoluted hits increases efficiency in K0 reconstruction
— running jobs provide track by track comparisons and other tests
— Gene can recompile the code base and run tests that should take only a few hours
TPC meeting September 26, 2024
Present: Alexei, Jim, Grazyna, Daniel, Gene, Flemming, Tommy, and myself
== Hardware
— everything is working well
— some minor laser issues (tuning etc.)
— grid leak crate failed a couple days ago
— David was notified, did hard reset through slow controls
— problems seems to have been resolved and is now okay
— can we update manuals to ensure this does not happen in future?
— *Action Item* need to have "global reset" button programmed into the GUI, and also include instructions for manual reset
— Wiener manual needs to be added to the web pages as well
— may be ~20 hours of data taken without GL wall powered (may need special handling)
— there were other mitigation measures put in place years ago, but have not been tested in absence of GL wall
— bad module from GL crate (from 2021) was replaced and sent for repair yesterday
== Electronics
— may not have been enough time during APEX to fix current RDOs down
— usual outages and recoveries continue
== Software
— Run 22 p+p 500 SC
— a fourth pass was done with portion of data
— four remaining fills with statistics just below what is required
— ran 22 jobs with slightly less statistics, will finish today
— everything possible to calibrate will be done at that point
— will then be waiting on TPC alignment
— TFG24d
— new TPC alignment is pending approval of changes in GitHub
— GitHub approval process still proceeding
— Need some questions answered regarding hit error changes
TPC meeting September 19, 2024 /cancelled
TPC meeting September 12, 2024
Present: Alexei, Jim, Yuri, Tommy, Frank, Mathias, Sonoraj, Flemming, and myself
== Hardware
— everything is working well
— checked TPC vs magnet position again for Yuri
— sensors were installed this past February
— no motion detected, even with polarity flip
— overall TPC is shifted by small amount (~1 mrad), but this took place before sensor installation
== Electronics
— analyzed all runs for past two weeks
— iTPC dead channels vary from 12 to 15 on a regular basis
— TPX has 7 RDOs down
— may be permanent through next year
— TPX is about 15% dead (7 out of 48 RDOs) at present
itpc status day 220-256
== Software
— Run 22 p+p 500 SC
— subset of fills (few hundred jobs) with one more pass
— SC calibration is _done_ with old TPC alignment once that pass is done
— will then proceed with more passes once new alignment is available
— T0 study
— look at all data from 2019 - 2021
— 9.2 GeV (days 178 - 180 and day 195-196) shows 100 ns timing split vertex
— 9.8 GeV shows approximately 1 time bucket splitting
— d+Au (2021, days 180-183) also shows approximately 1 time bin splitting
— see: https://drupal.star.bnl.gov/STAR/blog/fisyak/STAR-Trigger-delays-Run-XIX-XXI
— TFG24d
— some fixes implemented including those accounting for old alignment scheme
— jobs have been resubmitted to test fixes
— in 2 weeks, Yuri will be gone for 2 weeks
— QA plots from Mathias show slightly smaller reduced Chi^2 (1.83 vs. 1.95)
— secondary and tertiary peaks in vertex distribution observed in P24ia are gone in TFG24d
— discontinuity in DCA Y is still there (TFG24c vs TFG24d)
— reduction in Chi^2 is thought to be too small
== AOB
— Readiness of alignment changes for FXT production?
— many comments in PR
— library has been built by Gene with new alignment
— for FXT, Yuri would like to use that library to produce calibration sample
— new alignment needs new options
— test was done to ensure new options are compatible with older libraries (was successful)
— status summary will be sent to TPC list
— no follow-up yet on the 0.1 Hz ripple on power lines
— weekly reservation still needs to be updated in Drupal (some difficulty getting meeting added, R. Witt will follow-up)
TPC meeting September 5
Present: Alexei, Jim, Yuri, Tommy, Frank, Richard T., and myself
== Hardware
— small laser issue likely due to crew tuning
— expecting thunderstorm this weekend, we'll see how the system handles it
— most of week was devoted to ToF
— Yuri requested check of sensors
— Alexei has it on the list of things to do
— so far sensors have not detected any measurable movement of TPC
— drift velocity calculation failed for a block of runs
— last night only one run failed
— failures seem to come in blocks (crew procedure related?)
== Electronics
— seems to be a continuing problem with RDOs
— usually about 10-12 have a problem
— typically they get repaired cyclically
— significant number were still out this morning (another lost about an hour ago)
== Software
— Humidity
— dehumidifier added (turned-on) in mid-August
— observed an anti-correlation (decrease in field cage current with increase in humidity)
— July 30th shows sharpe jump after power shutdown at STAR (dehumidifiers stopped)
— in that specific case, the field cage currents show an increase
— typically, as long as humidity stays below 47%, field cage currents are not significantly impacted
— Run 22 SC
— Plots from EMC calibration folks show nice convergence of N+/N- vs. 1/p from different fills compared with past test production
— significant improvement
— waiting on alignment to include last few dozen fills
— will do a pass 4 in the meantime (on remaining fills), needs about a week + 10 days
— will do pass 5 once alignment in place
— overall a 3-5 week timescale until Run 22 SC is considered done
— 2021 Full Field
— differences in O+O FF and RFF
— associated with 1 mrad rotation of TPC
— correction was included in dB
— no motion has been observed with Alexei's sensors
— TFG24c
— test production chi^2 and primary vertex issues observed by UCD group
— work ongoing
— TFG24d
— some fixes with error calculations, particularly for outer sector
— K0 in P24ia, TFG24c, and TFG24d
— can see pull effects (1-2%), error calculation
— pulls in FXT vs collider do not show differences in simulation but do in real data
— tried vertex reconstruction with KFParticle
— see split vertex reco in FXT (at 2 m, separated in x and y)
— may be vertex from Au on target and another from proton on target
— need to confirm
— after upgrade of cvmfs machine, exported code does not run on rcas nodes
— thought to be due to extended instruction set
— looking for flag to exclude extended instruction set since races nodes do not support them
== AOB
— appear to be, in Run 24, some ripple on the power lines at 0.1 Hz (noticed by Jamie)
— seems to affect beams at that time scale
— may lead to SC effects on that time scale
— weekly reservation needs to be updated in Drupal
TPC meeting August 29, 2024
Present: Alexei, Jim, Yuri, Daniel, Mathias, Prashanth, Tommy, and myself
== Hardware
— checked laser and water level during access yesterday
— looks good, no need to change optics yet on lasers
— next access in two weeks
— gas system is still running well
== Electronics
— 2-3 RDOs repaired yesterday
— 6 or 7 still out this morning
== Software
— TFG24c
— working to answer the questions and comments associated with pull request
— new TFG24d soon, hope to have update by next week
— further discussion of multiple primary vertex clusters ongoing
== AOB
— received HV cable for new cathode power supply
— David comes back in a couple months
— plan is to put new power supply as a spare
TPC meeting August 22, 2024
Present: Gene, Jim, Flemming, Yuri, Frank, Tommy, and myself
== Hardware
— things continue running well in general
— lasers are still looking good
— gas system is still running well
== Electronics
— about 8% of iTPC FEEs are out right now
— STAR has much more luminosity with the crossing-angle running
— important to keep TPC deadtime below ~20% for present trigger mix
== Software
— Run 22 SC
— pass 3 finished, mostly converged except for a couple regions of fill (reasons understood, beamline constraint)
— will do pass 4 on ~25% of the data (needs 7-10 days)
— once TPC alignment is in can do pass 5 to evaluate impact of new alignment on SC
— Production with TFG24c
— test production is finished with available statistics
— several improvements observed
— primary vertex problems
— strange cluster(s) in old position vs. new position
— need to understand in the context of vertex plots shown by UCD group
— work on TFG24c GitHub pull request approval is ongoing
— Frank requested expedited review of the code in GitHub and several other S&C folks have become involved
== AOB
— Flemming will not be present in 2 weeks
— shutdown of air handling recently due to storms but nothing observable in field cage currents
— Yuri needs estimate of real event rate on target; BBCA? BBCE? BBCW? Something else?
— window for timing count can actually include next crossing, so window needed to be moved
— observes small shifts in primary vertices in X and Y (millimeters), concern about multiple interactions in target
— probably best to check with Dan Cebra
TPC meeting August 15, 2024
Present: Alexei, Jim, Gen, Yuri and Flemming
short meeting
-hardware
Laser is now in good working condition after maintancece day
Tpc electronics the usual making on/off
TPC space charge calibrations
- Current pass 3 done witin about a day
- Will like to repeat with new alignment
- If this is not ready soon, has another 12 fills
Yuri reported a double counting error in analysis code of TFG production that cause the apperent gain of ~factor 5. Actual analysis with corrected code gives about 12% improvement in e.g. K0s reconstruction
See https://drupal.star.bnl.gov/STAR/system/files/TPCFXT2024Aug15.pdf
Status of approval for mini pull request. Some comments received , and some action to be taken. For details see above link too.
Once approved need calibration (Tof and de/dx) and test sample to confirm proper working.
AOB none
TPC meeting August 8 2024
Present: Alexei, Gene, Jim, Zachary, Flemming, Mathias, Grazyna, Yuri, Frank, Petr, Daniel, and myself
== Hardware
— things continue running well in general
— lasers are looking good
— had a very good run overnight
— gas system is running well
— sector 11-8 voltage being kept at 1100 V, hasn't tripped since
== Electronics
— usual battle with RDO, we've lost about 7 iTPC RDOs and 4 TPX since last long access
— each time many are fixed and then we lose some quickly
— shift crew
— nothing else new to report
== Software
— Run 22 SC
— calibration production about 2/3rds finished, need another week or so
— Production with TFG24c
— see slides on list from Petr
— 50% increase in probability of finding 3pi K0 decay with TFG test production
— increase seems to come from short tracks, high negative eta
— need to check with cuts to exclude possibility of reconstructing same vertex with split tracks
— maybe effect of loopers?
— also want to check proximity of vertices within an event
— Update on test production with new alignment (3.2 GeV FXT)
— see slides on list and in Drupal from Mathias
— observes what appears to be an azimuthal dependence of DCA Y shift
— also observes an eta dependence of dE/dx integrated over azimuth
— also observes a dependence of amplitude, mean, and width of Gaussian fits to dE/dx momentum window as function of azimuth
— dE/dx in test production may need some calibration
— also a concern that observed azimuthal dependence may be affected by observed DCA Y shift
— Status of TFG24c production
— see slides from Yuri at
— checking to ensure complete data sets have been processed (2019 and 2020 3, 4, 5, and 7 GeV FXT)
— K0 still shows a factor 5 improvement with better signal to background and improvement in width
— significant improvement in lambda baryons and hyper nuclei as well
— ~factor 10 improvement in hypernuclei signal
— study of pi- dE/dx peak further shows need for dE/dx recalibration
— pull request has been made for TFG24c mini
Mathias' slides from August 8th 2024 are here:
https://drupal.star.bnl.gov/STAR/system/files/August82024_testProductionQA.pdf
I added my analysis track cuts on slide 2. And I added the mean(mean(eta)) plot as a function of Vz on slide 21.
TPC meeting August 1, 2024
Present: Alexei, Gene, Jim, Zachary, Flemming, Mathias, Grazyna, Yuri, Frank, Petr, Daniel, and myself
== Hardware
— things continue running well in general
— lasers are looking good
— had a very good run overnight
— gas system is running well
— sector 11-8 voltage being kept at 1100 V, hasn't tripped since
== Electronics
— usual battle with RDO, we've lost about 7 iTPC RDOs and 4 TPX since last long access
— each time many are fixed and then we lose some quickly
— shift crew
— nothing else new to report
== Software
— Run 22 SC
— calibration production about 2/3rds finished, need another week or so
— Production with TFG24c
— see slides on list from Petr
— 50% increase in probability of finding 3pi K0 decay with TFG test production
— increase seems to come from short tracks, high negative eta
— need to check with cuts to exclude possibility of reconstructing same vertex with split tracks
— maybe effect of loopers?
— also want to check proximity of vertices within an event
— Update on test production with new alignment (3.2 GeV FXT)
— see slides on list and in Drupal from Mathias
— observes what appears to be an azimuthal dependence of DCA Y shift
— also observes an eta dependence of dE/dx integrated over azimuth
— also observes a dependence of amplitude, mean, and width of Gaussian fits to dE/dx momentum window as function of azimuth
— dE/dx in test production may need some calibration
— also a concern that observed azimuthal dependence may be affected by observed DCA Y shift
— Status of TFG24c production
— see slides from Yuri at
— checking to ensure complete data sets have been processed (2019 and 2020 3, 4, 5, and 7 GeV FXT)
— K0 still shows a factor 5 improvement with better signal to background and improvement in width
— significant improvement in lambda baryons and hyper nuclei as well
— ~factor 10 improvement in hypernuclei signal
— study of pi- dE/dx peak further shows need for dE/dx recalibration
— pull request has been made for TFG24c mini
TPC meeting July 25, 2024
Present: Alexei, Gene, Jim, Zachary, Flemming, Mathias, Grazyna, Yuri, and myself
== Hardware
— things running well in general
— laser runs are good with the usual caveats
— methane flow was slightly increased in response to decrease in drift velocity over the past couple weeks
— crews likely won't see the difference for at least a few days of operations
== Electronics
— nothing new to report
== Software
— Run 22 SC
— pass 3 has been started and is proceeding well
— good to have calorimeter fix for this pass
— dE/dx is turned on for this pass (no event.root files, but dE/dx is there if someone want to look at it)
— may want to take one more look with new TPC alignment
— Production with TFG24c
— some delays due to farm capacity and killed jobs (~1-2 week delay)
— have now increased number of jobs by factor of 4 by splitting files into chunks
— so far 5-20% of data sample has been processed
. Progress slower than expected.
- laser run
Yuri has prepared a list of good/failed laser runs. See his blog
— Update on test production with new alignment (3.2 GeV FXT)
— see
slides sent to list by Zachary
— several tracks in test production are assigned zero momentum
— seems to be event-by-event fluctuation not track-by-track
— some example events are Run 20183003, events 1264727 and 1246798
— most events are okay and match the P24ia production, but need to understand the root of the issue
== AOB
— nothing else new reported this week.
TPC meeting July 18, 2024
Present: Alexei, Gene, Jim, Yuri, Zachary, Tommy, Flemming, Mathias, Prashanth, and myself
== Hardware
— thunderstorm yesterday, almost 3 mbar pressure spike
— gas system behaved very well
== Electronics
— some power problems to RDOs as usual
— tried to fix some yesterday, other are out for the run
— overall, the number out at any given time is more or less stable
— more TPX problems this year than last
— seems most concern is about the power system
== Software
— Run 22 SC
— starting pass 3
— about 247 fills, but calibration only works for about 235
— trying to use calibration from nearby fills for the ones that don't work
— Starting production with TFG24c
— some problem with long jobs (> 3 days on a file)
— trying to increase statistics to 100 million events
— K0 width looks better in TFG vs most recent production
slides
— may need one or two more weeks depending on speed of processing
— Early QA from production with new alignment (3.2 GeV FXT)
Mathias slides
— DCAX and DCY look good
— double peak structure due to broken tracks is gone
— comparison with embedding also looks very good for low rapidity (not crossing CM)
— some difference for higher eta with CM crossing tracks, but only in DCAY
— nHits distributions also look good between test production and embedding
— maybe some systematics above eta~2
— perhaps some relation to revised formulation of TPC hit errors in TFG test production?
— PV distribution also shows some differences between test production and P24ia
— can look at mean eta vs PVZ between test and P24ia
TPC meeting July 11, 2024
Present: Alexei, Gene, Jim, Yuri, Mathias, Pavel, Daniel, Frank, and myself
== Hardware
— installed magnetometer on July 6th
— data stream goes to dB
— readings look good
— magnet has been half-field for past couple days due to humidity;
(once down 2 hours during apex), couple of trips. (FV)
— gas system is also okay
— some ongoing network problems as well and a failed switch
— maybe run with 3/4 field to reduce trips?
— possible but will reduce momentum resolution
— also, we have no official field map for 3/4 field (though we only have a map for 1/2 field, FF only)
— also, not likely analysis groups will utilize the set
== Electronics
— problems with PROMS
— increasing current in some FEEs and parent RDOs not working properly
— perhaps due to chips suffering radiation damage(?)
— more problems on iTPC (inner) sectors than on TPX (outer) sectors
— two RDOs lost last night, may not be recoverable
Tonko will work with Tim next access day, and nudge te output from PS, particular those in TPX which look
shaky (FV)
== Software
— Run 22 SC
— calibration is proceeding
— third pass starting end of this week
— studying second pass right now
— will have a beam line calibration as well for third pass
— expect about 3 weeks, should be ready for TPC dE/dx sample in early August
— Progress on FXT final data production
— see slides at https://drupal.star.bnl.gov/STAR/system/files/TPCFXT2024.pdf
— TPC alignment nearly finalized
— Prepared TFG24c release
— Adjust trigger delay based on PV reconstruction comparison with 2 different methods
— use either hits or tracks from West or East TPC only (see slide 3)
— in preparing TFG24c, need to split repo due to number of files reaching cvmfs upper limit
— no access to file needed for splitting
— instructions for using TFG24c are on slide 7 of this presentation
— use of production cluster was refused for producing calibration samples
— using TFG allocated space on RCF to run smaller batches to start FXT test production
— will take about 3 weeks at current rate
— began preparation of TFG release for merger with official STAR (star-sw) repo
— need to separate alignments between old and new on merger so as not to introduce confusion
— Mathias will begin looking at produced files as they appear
— More resources are needed to finish in 2 weeks, 100 TB and more CPU (about a factor 5 increase)
— need a STAR management statement on these requirements
TPC meeting June 27, 2024
Present: Alexei, Jim, Frank, Dan, Yuri, Mattheu, Gene and Flemming
-hardware:
Position and composition of NMR probe has been documented by Alexei. An entry to drupal blog has been added https://drupal.star.bnl.gov/STAR/blog/videbaks/NMR-probes.
This would require an update to detector description in GEANT as it is in the active are of BBC and EPD.
Tim has order additional interface so the NMR readout can be attached to slow control.
Shift crews as usually struggles to operate laser well. Alexei provides on hand training to crew, and this helps a lot.
-software
Yuri presented at the Tuesday mgt meeting status, and a detailed plan for alignment and calibration needed for the FXT target data and beyond, The plan was well received by mgt and will form basis for work in the coming month , including calibrations tasks for BTOF, eTOF,… The presentation is available at https://drupal.star.bnl.gov/STAR/event/2024/06/25/STAR-management-meeting/TPC-Alignment2024
-electronics
Usual loss of ~1 RDO per day of running. Several have been brought back to life by Tonko when there is sufficient downtime available to diagnose issues (prom’s power distribution).
Fairly stable overall.
- QA team identified data where offline cluster finding failed to read adc files causing memory overwrites and leaks. Issue was identified by Tonko, and relates only to offline cluster finding. Pull request has been generated.
-software
Yuri is working on optimizing t0 for FXT to minimize residual track breaking, using position of target (200 – 200.5 cm).
Richard T. and Jae N. is working with Gene on 2022 space charge. Fill-by-fill correction is proceeding well.
TPC meeting June 20, 2024 (solstice)
Present Frank, Jim, Yuri, Alexei, Gene, Matheu, Flemming, Tommy
Hardware:
Progress with the NMR probes. Could not readout through the RS232 port. Turns out the $88 paort (GPiB) works, Tim purchases readout board. Further discussion will take place with Alexei, Tim and David how to incorporate this into slow control readout and data storage. Will need interface to IP readout so it can be stored. Discussion on absolute vs. relative readout. Certainly, it is very useful to understand time stability; much better the current readout. The value should be calibrated vs. analysis e.g of K0s mass. We already learned since installation that the current readout in not a proper reference, stability not good.
The nominal value readout is 0,4988(6) ie. A 1.2 gauss deviation for the nominal 5kGaus field.
After meeting Alexei supplied informationon position:
“There are two probes sitting on East side of TPC, Z position is about 1300mm from magnet center. So Z is -1300mm, and X is about -60mm, Y is about. +/-70 mm.
After this run I'll order survey service to have more accuracy. Now my estimation is about 20-30mm.”
Laser operations by crew is not always good. Alexei will (again) instruct crew as one has to refocus during the datataking as it drifts.
Electronics:
Tonko fixed 4 RDO today, had to mask one FEE out. Due to power issues for RDO
Software:
Gene
1) Space charge calibrations for run 22 pp proceeding well. On pass 2. Had to redo about 10% a the had failed (overwrite of files). Looks pretty good and will proceed (soon) to pass 3.
2)Joe Nam (Temple) who earlier had done space charge, looked on some data from pp 22 to look at h+/h- for a few fills. Does see fill to fill effect. Lokks like a good tool to confirm new calibrations.
3) Gene have discussed with (QCD) pwg full production time for run 22. With default setup it looks like >= 1year, so no time for additional repeats.
Look to see for ways of improved time. Showed that skipping ~ ½ itpc rows in a couple of different configurations could improved reco time by ~ 50%. Have not demonstrated (task of pwg) if this affect the physics. Cold QCD sees this favorable, but other pwg not yet asked.
4) Gene had e-mail from dAu flow analysis group that had observation of loss of hits near central membrane. Different of observation from FXT group. Wa mentioned tha flow group always have taking such in eff into account (Jim). There was possible difference between STI and STICA.
5) observation by Zach (?) UCD that there is a low pt de/dx difference expected and observed. Was requested through Matheau to get documentation- possible presentation next week by Yuri, so he knows what to look for.
Software II
Yuri had nothing new to report. Reviewing alignment found and presented last week.
Frank presented the current exceptions that the proton-cumulants is of high importance in view of the recent very successful presentation of the collider data at CPOD and upcoming publications. DOE & BNL management have requested that a timeline has to be presented this FY that contains milestones, that will be followed, that can lead to presentation of final results by QM25, and subsequent publication. Based on PWG discussions and timelines for analysis, discussion, and approval it seem that production of the FXT energies (3.2, 3.5, 3.9, and 4.5) has to be done by end of September. Thus having the newly obtained alignment that resolved the track-breaking observed by UC Davis group incorporated into standard software as a first step, and confirmation of quality sufficient for next calibration steps should be given high priority.
Frank asked Yuri to prepare for a presentation at next weeks mgt meeting for a status and baseline.
Frank reaffirmed that mgt would help with expediting the approval to incorporate into GitHub, strongly recommending to split it into several smaller, better manageable requests.
TPC Meeting 6/13/2024
TPC meeting June 13, 2024
Present: Yuri, Alexei, Gene, Jim, Flemmig, Tommy, Dan
Hardware:
Worked on magnetometer interface. The RS232 does not seem to work, had help from David, Tim. We agree to have shift crew record setting once per hour. Now instituted. Stability seems to be in order .1 %% much better than current reading. Alexei will pursue options for readout to slow control.
Laser:
Laser in general are not great. Weak laser (eats or west?) crew not tuning well while taking data.
Electronics:
Kind of steady: loosing maybe 1 RDO per day; being brought back from tonko when time available (ie no beam)
Software:
Pp500 run 22 data proceeding. Now on pass 2. Mostly looks good and improved, but a few fills semms not to have converged in pass 2. Will reapet, but continue to pass 3 with the starting with pass 2 results. The beamline calibration also need to be repeated with the pass 2 calib.
Yuri has a new alignment (super sectors) 2024 and applied it to the all of the run 19-21 FXT data that showed a large CM track breaking as found by the Davis group. It seems to have fixed that problem see https://www.star.bnl.gov/~fisyak/star/Tpc/Alignment/FXT_CM_Tracks_splitting/
This is very encouraging. Yuri will continue with look at t0 adjustments, and once that done like to make a TFG production of about 100M events on 11.5 GeV data (020) to check results, in particular K0s mass dependence on phi-eta .
TPC meeting 6/6/2024
Present: Alexei, Flemming, Gene, Jim, Yuri, Mathias, Daniel, and myself
== Hardware
— magnetometer is now stable and running
— readings are more accurate than we used to have
— working to establish readout and get into slow control and dB
— Alexei will send image of readings to list for discussion
== Electronics
— multiple RDOs go out and are repaired weekly.
— about 10% of iTPC out now and some TPX
— some may be result of power distribution (iTPC vs TPX)
== Software
— Run 22 SC
— calibration production finished ~222 out of 246 fills calibrated (fill-by-fill)
— missing barrel tower was problem for some fills in pass2
— pass2 expected to start today
— pass2 needs a couple weeks, but will be first fill-by-fill SC corrected calibration for Run 22
— pass3 will hopefully be a confirmation that pass2 is good
— will look at h-/h+ from pass1 to pass2 to judge effectiveness of fill-by-fill calibration
— Discussion of track breaking in FXT runs
— Gene looked at differences in alignment and the effect on track breaking
— different field orientations may show different effects
— perhaps some evidence for alignment effects
— Cosmics alignment is finished
— Yuri putting together summary of cosmics alignment
— want to use that alignment for real data production (both collider and FXT)
— Work ongoing on track breaking at UC Davis
— looking also at consistency of effect from energy to energy
— some unexpected inconsistencies from energy to energy
— see shift in XY vertex reconstruction using broken tracks
== AOB
— Some question about sPHENIX status and commissioning (affects STAR plan), but no answers
— Hope to learn something new next week at RHIC/AGS meeting
— Nothing else new reported this week.
TPC meting 5/30/24
Present: Alexei, Frank, Flemming, Tommy, Gene, Jim, Yuri, Mathias, Daniel, and myself
== Hardware
— tried to use outer readings of magnetometer but did not get reliable result
— looking for way to use manual mode of magnetometer
— discussion of whether whole TPC cylinder may have a sag (endcaps have some incline relative to each other)
— gas system is running well
— once per weak there is a half-second gas system alarm (not understood)
== Electronics
— system is stable and running well
— were up to almost 13% of iTPC channels out, but as of yesterday we're back down to only 2 RDOs out (1 is permanent)
— occasionally see a whole TPX RDO light-up, needs to be power cycled
— shift crew has been alerted to look for this effect and cycle the affected RDO
== Software
— Run 22 SC
— calibration production finished ~3328 runs (about 12% did not produce calibratable output)
— doing fill-by-fill, can do about 210-220 of the runs
— expect to start pass2 at the start of next week
— Discussion of track breaking in FXT runs
— effect may be more radial than azimuthal which would preferentially affect high eta more than low eta
— recently Mathias looked at -70 < vz < -50 in a collider run at 19.6 GeV
— chosen eta range of 0.4 to 0.6 may still be to low to clearly see the effect
— found an apparent 6 degree shift between positives and negatives in 19.6 GeV collider data
— also an interesting gap in middle of sector for negatives but not positives in same data
— need Run numbers to look more closely at what is happening with the detector in that time
— lastly, track breaking does not seem to appear in embedding
— Mathias will post slides on the list
TPC meeting 5/23/2024
Present: Alexei, Tommy, Gene, Jim, Yuri, Mathias, Daniel, and myself
== Hardware
— working with magnetometer
— some work for MTD gas
— pressure jumped about 2 mbar today due to thunderstorm
— TPC gas system responded very well
— laser system is functioning well
— some lost connection to GUI for TPC, but gating grid appears to have been on all the time
— some language and instructions will be added to handle this situation should it occur in the future
— put the system in Standby (Pedestal mode)
== Electronics
— system is stable and running well
— 4 RDOs out in the iTPC
— 9.7, 9.8, 10.7, and 10.8
== Software
— Run 22 SC
— calibration production is nearly finished, 3338 jobs total
— multiple DAQ files from a single run
— typical jobs take more than 3 days
— about 50 jobs have continued for 7 days and stopped (queue limitation)
— may need other jobs from that fill, need to check
— move to pass2 in next week or so
— Fixed target sets from Run 22 presentation
— event-by-event T0
— some flaw in calibration for some events (about 10%)
— a zero TAC is inadvertently used
— used TAC comes from west side, so need to really only use those from east
— also affects about 10%
— seems to correlate with track breaking that is seen by fixed target analyses
— have other methods to determine T0
— Mathias presented work he has done looking at track breaking in fixed target data
— Alignment work is still underway
== AOB
— Discussion of GMT
— Nikolai took over as detector expert after Dick passed
— the subsystem is actually running with one of the minbias-like triggers that reads-out the TPC
— runs at 50 Hz
— need someone identified to check the usual online plots
— determine if it is taking good data
— pursue use of the data
TPC meeting 5/16/2024
Present: Alexei, Tommy, Gene, Jim, Yuri, and myself
== Hardware
— working with magnetometer
== Electronics
— same 4 RDOs out in the iTPC
— 8.1, 9.4, 10.3, 12.1, and 12.2
== Software
— Run 24
— gating grid transparency test was conducted
— got to 5.6 kHz, ultimately 7.8 kHz
— previous calculations show around 10 kHz should show transparency effects
— early result shows no change in SC up to 7.8 kHz
— cosmics with open gating grid show distortions, so
— Run 22 SC
— calibration production is running, 3338 runs from Run 22 (247 fills)
— about 30% have finished as of yesterday morning
— so far can see different categories of runs with different SC behaviors
— next week will calibrate fill-by-fill and prepare for 2nd pass
— Alignment work with cosmics from last 5 years
— trying to sort problems with Run 22 due to short
— FF and RFF differences due to different accounting of short (too many dB entries)
TPC meeting 05/09/2024
Present: Yuri, Gene, Alexei, Tommy, Jim and Flemming
Hardware: Alexei
Working on Magnetometer readout.
Laser status: East is weak ; only one raft
West ok 2 rafts. Yuri is concerned about East status; It has though been like this for several years.
Methan content has been changed to make it more stable.
Pressure spike in yesterday thunderstorm was handled very well by system.
Software:
Gene presented a couple of studies
a) background in early parts of fill. Concerning due to unknown charge distributions from backgrounds blog https://drupal.star.bnl.gov/STAR/blog/genevb/Background-Run-24-pp200
b) study of cluster widths (time) for tracks
blog entry https://drupal.star.bnl.gov/STAR/blog/genevb/Run-24-TPC-clusters-wide-time
c) transparency study. Blog https://drupal.star.bnl.gov/STAR/blog/genevb/TPC-Gating-Grid-Transparency-study
Conclude that at these lumi (40kHz BBC) no observable effect at 5kHz triggering rate.
Run 22 pp space charge calibration. It is ready for production of 3,400 jobs (runs) covering 250 fills. For each runs several daq files must be processed. Ready to go.
TPC meeting April 25, 2024
Present: Alexei, Yuri, Tommy, Gene, Flemming, Jim, and myself
== Hardware
— moved magnetometer from right side to left
— also bought new HV power supply but need plug installed (on device)
— also working on ToF and MTD gas system
— tuning methane content slowly
== Electronics
— 4 RDOs out in the iTPC
— 12.1, 12.2, 5.1, 21.3
== Software
— DAQ files have been staged for run 22 pp500 SC
— expect to start calibration production next week when Richard T. is back
— developing plan for investigating ion backflow in 5 kHz running
— need to bring to trigger board
— waiting on collider data for tuning T0
— work on cosmics continues as well
— if cosmics are taken during running it's important to also have lasers taken to track changes in drift velocity
TPC meeting April 18, 2024
Present: Alexei, Yuri, Tommy, Gene, Flemming, Jim, and myself
== Hardware
— Gas system is more stable now
— watching MTD gas as well, appears to be working now
— now moving to working on magnet and verifying sensors
— expecting first collisions around April 23rd-25th
— drift velocity is roughly flat, trying to get back to ~5.55 cm/us
— lasers every 2 hours
== Electronics
— Flemming's dead channel scan was successful
— Tonko has list (~7 pads that have always been dead)
— when poletips were installed there were some problems with various electronics going in and out
— maybe test after poletips is installed should be modified?
— perhaps test is too short
— summarized cosmics
— for FF have ~15 hours, 30 million triggers (Yuri sees 50 million)
— for RFF have ~12 million triggers
— zero field has ~9.7 million triggers (~8 million HLT)
— fast offline processes all events in all ADC files right now (not limited to 1000)
== Software
— Run 22 pp 500 SC
— Gene preparing staging for having enough DAQ files for each run to get SC for each run
— in pp500 that's challenging due to the significantly higher SC (need to have enough good tracks to determine SC)
— developing procedure to determine how many files will be needed to get the needed number of good tracks
— good procedure already developed for finding SC efficiently
— putting the two together, we should be ready for production to find SC
— expecting about 1.5 weeks for each SC pass
— Yuri looking at cosmics that have been collected
— also watching lasers and drift velocity
— Tommy finished TpcRs tune-up for 2023 data
— Yuri will include as soon as possible
— working on fixing spread in ADC and time bucket values in simulation to match data
— simulation currently underestimates both
— also working on T0 offset and dE/dx differences between data and simulation
— several parameter adjustments have produced much better agreement
— final parameters and details available at link below
TPC meeting April 11, 2024
Present: Alexei, Yuri, Tommy, Gene, Flemming, Jim, and myself
== Hardware
— TPC running well
— lasers started and we have cosmic rays
— gas system was interrupted yesterday, has been restored
— leak has increased somewhat, started around 1.2-1.3 l/min
— running forward full field right now
— expecting first collisions around April 22nd
== Electronics
— running well
— Tonko has been checking along the way
— we have about 16 hours (wall clock) of FF data
— Flemming will do a first pass dead channel scan
== Software
— some cosmic data has been run through fast offline
— hope to have some produced soon
— Run 22 pp 500 SC
— Richard T. working on fill-by-fill study, preparing required software tools
— calendar will free-up somewhat in May, April will be busy
— jobs for voltage power supplies, magnet and lasers started
— jobs for laser runs after a day failed
— running time for processing laser jobs is very long (>1 day for a job)
— usually ~10 seconds per event and about 2-3 hours for a file
— we have big files, about 4000 events per file, but watching process
— have cosmics from level 4 as of yesterday
— will process as soon as we have drift velocity for this run
— can then make statement on quality of data so far
— Alexei will examine last day of laser runs to see if there is any issue
== AOB
— Flemming, Yuri, and Gene met with eTOF folks to talk about alignment
— some slides at eTOF page
— issue may be related extrapolation of track out to eTOF
— helix model parameters and constant magnetic field assumptions at eTOF
— work is ongoing, several suggestions were made for possible diagnostics to check
— maybe O+O data, for example
TPC meeting Apr 4, 2024
Present: alexe, jim, flemming, gene, Frank, Yuri, yannik
Hardware:
Argon started Monday. Blue sheet has been delayed.
Argon will be delivered next Monday.
Will start flammable gasses today did not happened breakers issue
No short currently –
Discussed what to do if a short is found – gene’s pref. to try to fix it.
Might help to have laser to diagnose. Should pole tip
Sensors for surveying motion is live and should be used when magnet field is changed.
Electronics:
Ready for run – except Tonko will perform pulser runs, and determine gain tables and dead/hot channels once magnet is stabilized. Maybe tomorrow early.
Software:
Run 22 space charge Rich S. Did another pass on days (4 days) ongoing, using production system with long queue.
Should be able to get fill-by-fill outcome of this pass.
If has to be for full production about 20,000 runs. Preparing for this.
Yuri Working with alignment. Problem to get stable results of data from different runs. Possible weeks are needed for results. No firm estimate for when results can be available Time scale weeks.
Preparing for data taking. Cron job for filling of tables.
Frank brought up the points, as for S&C meeting, that production for pp 500 (run22) really have to start soon.
Longer discussion on findings from eTOF group that it seems that projection from itpc only seem only to match with large deviation.
Rather than iterate discussion point out for next week’s eTOF meeting Apr 11 10.00am EDT we will have a joint discussion on this issues.
Some points brought up -
- Track extension done with helix. What is effect of tracking in non-homogeneous magnetic field – particular radial changes.
- Some effect are order of up to 8cm deviations, unlikely this can be result of misalignment as current alignment deviations are order mm.
- Are there effect from the very long clusters in FXT data for iTPC response.
- Is this also seen in collider data?
- Is there a difference in OO with FF vs RFF data?
TPC meeting March 28, 2024
Present: Alexei, Yuri, Tommy, Gene, Jim, and myself
== Hardware
— gas shifts should start this coming Tuesday
— sensor calibration to be done tomorrow
== Electronics
— nothing new reported this week
== Software
— status of Run 22 SC was shown last week at collaboration meeting
— Richard T. looking at fill-by-fill results now
— difference in SC now compared to preview production not yet within desired range
— in FXT the eTOF group sees interesting effects when aligning to TPC
— looks like space charge
— but also seen in same magnitude in several other colliding and FXT systems
— that's usually not characteristic of space charge
TPC meeting March 21, 2024 - cancelled due to collaboration meeting
TPC meeting March 14, 2024
Present: Alexei, Yuri, Tommy, Gene, Jim, Flemming, and myself
== Hardware
— power drop on Monday due to strong winds
— power was restored ~11pm
— TPC was okay after water restored
— Glassman operates okay
— front display now working correctly (after power drop)(?)
— laser inspection today
— no problems found
— oxygen sensors to be installed soon
— new power supply was ordered last summer
— now in transit from Germany
— will serve as our spare
— with additional existing Glassman will have complete backup HV system
== Electronics
— talked to Tim Tuesday
— seem to have one remaining RDO in the TPC (needs replacement connector)
— otherwise are done
== Software
— continuing work on SC in Run 22
— DCA distribution is tightening
— so calibration is likely converging in recent iterations
— working on pass 7
— want to now compare fill-by-fill calibration (looks like it's needed)
— will scale calibration runs to "production" mode
— alignment work continuing
— struggling to get convergence
— Tommy's evaluation of TPCRS for 2023 dataset
— comparison needs some tuning
== AOB
— Gene showed a plot of local hit coordinate (colored by drift distance) from pp500
— long drift distance hits are more distorted (SC)
— r-phi cut on hits causes losses on the inner most pad rows
TPC meeting March 7, 2024
Present: Alexei, Yuri, Tommy, Gene, Jim, Flemming, and myself
== Hardware
— Tim (electrician) will look at Glassman as soon as he returns from vacation
— he was able to fix it last time
— if it cannot be fixed will move to an alternate
— oxygen sensors to be installed later this week
== Electronics
— one RDO changed with spare
— possibly 2 FEEs need to be switched
— should be finished and ready for testing by end of this week
== Software
— sector 18 in run 22
— calorimeter folks took a closer look
— proportion of hits lost (unmatched) in sector 18 is same as rest of calorimeter
— problem is further up in applied cuts on EMC side
— Run 22 SC (& GL)
— queuing problem at SDCC resulted in production queue jobs (>3 days) being sent to wrong nodes
— now resolved, will see Saturday morning
— differences in running jobs noticed in SC corrections (batch vs. interactive) seems to be due to rounding on different processors (AMD vs. Intel)
— very small (last digits differences)
— about 1/3 of SC jobs hit an assert in tracking code
— tacking code was changed in 2016 to allow skipping over "bad" nodes on a track
— track node quality cut on position with respect to "detector" in which they are found
— track nodes moved off the end of a padrow after distortion corrections are numerous enough that an assert gets thrown by other parts of the tracking chain
— immediate fix is to undo the 2016 change and throw away remaining portion of tracks when they hit a bad node
— Yuri continuing alignment work
— applied new survey with Alexei's corrections to data from last 5 years
— iterating on that
== AOB
— Richard W needs input for the TPC summary talk at the collaboration meeting
— draft list of topics will be circulated on the list
TPC meeting February 29, 2024
Present: Alexei, Flemming, Tommy, Gene, Jim, and myself
== Hardware
— second oxygen sensor received
— to be installed later this week or next
— tomorrow west pole tip will be closed so measuring voltages
— strange readings on front panel
— tried using alternate (Glassman) meter to check
— remote cathode HV is okay, currents are okay with remote meter
— front end problem not yet understood
— will also check end HV
== Electronics
— waiting for eToF work to finish on east side
— nothing in notes about sector 18
— otherwise nothing new reported this week.
== Software
— sector 18 does not show any evidence of an issue on the TPC side
— Gene will circle back to the EMC folks to discuss further
— Run 22 SC (& GL)
— SC histograms shows no z-dependence of variations (would indicate presence of GL)
— so, even with high luminosity, it seems hardware fix with iTPC works well
— also, jobs running for SC corrections were running past their limit (< 3 days)
— working to have production account run these jobs
— getting asserts due to errant RICH scalar values (moves TPC hits beyond reasonable postions)
— sometimes SC correction can actually move hits by significant amount however
— result is, due to high SC in run, some hits move beyond 10 cm
— in the meantime, temporarily raised the limit to 20 cm and will revisit
— more troubling is there are differences between jobs run via the batch queue and jobs run manually
— Gene is pursuing this
— also noticed difference between optimized and unoptimized code
— none of these affect the overall tracking results
— shows that the math done mostly in floats in StMagUtilities is good (no observable difference in tracking either way)
== AOB
— Richard W will present the TPC summary talk at the collaboration meeting
— final list of topics is TBD
TPC meeting February 22, 2024
TPC meeting 2/22 2024
Present : Jim,Yuri,Tommy, Gene and Flemming
Hardware
Last repairs of RDO (2) should be done in next two weeks; closeout approaching
Alexei reported during week
“I finished measurements of target displacement on TPC wheel versus actual position. For all holes target dropped vertically down due to target gravity.
I did only inner holes on wheel. There are too difficult to measure others.”
And provided numbers to Yuri. Resoultion in survey should be around 150 microns.
Software
a) work on space charge calibration of pp 200 for 2022 has continued . Studied 5 fills with high statistics.
The runs are long and some jobs were killed due to 3 day limit.
Comparisons of fill vs ZDC rate shows
1) nice linearity with ZDC rate which is good
2) significant difference between fills corresponding to 4-5 mm DCA.
So seems necessary to have space charge done per fill.
b) Continued looking at matching between TPC and BEMC towers. Confirmed that indeed the phi-definitions are same between subsystems as should be. So issue of reduced matching is in area behind sector 18. Other plots (e.g. h+/h- issues) does not show any issues with sector 18 vs. time.
Gene suggested looking if it could be a BEMC issue electronics. Matching looked slightly off.
c) discussion on track matching to eTOF, that was also the subject to an earlier meeting today. New information appear during meeting, and issue may very well be a space charge issues. Have suggested eTOF group to review matching in FF and RFF setting for OO system to confirm this is a space charge driven.
TPC meeting February 15, 2024
Present: Alexei, Flemming, Tommy, Gene, Yuri, Iouri, and myself
== Hardware
— continuing measurement
— now have right scale and additional magnification glasses
— have 1 oxygen sensor and 1 was ordered this week
== Electronics
— Nothing new reported this week.
== Software
— looked into the sector 18 issue mentioned last week
— Gene was given a phi region, but there may be some misunderstanding
— upon initial examination, signed DCA is a bit messy on east, but sector 18 doesn't seem to be exceptional
— charged ratios show some acceptance effects due to dead regions in some sectors, but not sector 18
— sector 21 shows a strange split, maybe this is the sector that was noticed
— Continuing work on alignment
— looking at high voltages
— looks like different direction of electric field in different sides of TPC (perhaps due to sag?)
— Work by Iouri Vassiliev on dE/dx in P23id
— Hyperon reconstruction at 3.5 GeV in P21id and P23ie
— Very nice results with newer calibration (P23ie)
— see link that will be posted to TPC list separately
link to talk at eTOF meeting
== AOB
— Need to discuss list of topics for collaboration meeting
— Also need to decide on speaker for that talk
TPC meeting February 8, 2024
Present: Alexei, Flemming, Tommy, Gene, Yuri, Jim, Frank, and myself
== Hardware
— tuning procedure for survey related measurements
— gas systems is ready
— need to replace 2 oxygen sensors (1 in hand, 1 needs to be ordered)
— also need to do methane sniffer calibration
== Electronics
— talked with Tim
— had to fix 2 readout boards on east side
— those are expected to be the last one
— all that should be left is testing after pole tips are closed, etc.
== Software
— Richard Thrutchley has needed to be away so SC work is currently paused
— pp500 BEMC calibration are moving forward
— towers outside TPC sector 18 are seeing significantly reduced matching
— Z close to endcap sees better matching than closer to central membrane
— probably not space charge and should not be grid leak (but...?)
— Gene looking more closely into it
— Continuing work on alignment
— looking at high voltages
— looks like different direction of electric field in different sides of TPC (perhaps due to sag?)
— Some difference in dE/dx between P21 and P23 production
— helium band not easily visible for eta<-2
— J/Psi team checked 2019 data set with new calibration (4.5 GeV FXT)
— do not see any degradation
— asked to repeat for 2020 data sample
== AOB
— Possible topics for collaboration meeting
— DAQ 5k?
— alignment work?
TPC meeting February 1, 2024
Present: Alexei, Flemming, Tommy, Gene, Yuri, Jim, and myself
== Hardware
— making a new target holder with flexibility to move target
— expect to finish tomorrow
— will resume measurements related to survey
== Electronics
— Tonko has restarted work now that interlock testing is done
== Software
— Continuing work on alignment
— goal is 1.4% momentum resolution at 1 GeV (right now is ~2)
— expect to need to modify supersector alignment procedure and TPC overall alignment
— also waiting for systematics and uncertainties from survey (Alexei is working on them)
TPC meeting January 25 2024
Present: Alexei, Flemming, Tommy, Gene, Yuri, Jim, and myself
== Hardware
— long test of global interlocks
— almost finished tuning check of survey and target installation
== Electronics
— testing will start when things are more quiet on site (repairs and checks, etc.)
== Software
— TPC field cage shorts in 2022
— external resistor was added to compensate for a short that was found
— in 2023 the short was repaired (via cleaning) and external resistor was removed
— dB can be updated
— Working with Richard Thrutchley to have enough statistics for SC
— Yuri sees ~1 mrad rotation in survey
— needs survey uncertainties to verify
— Alexei mentioned survey target appears to have dropped in position by as much as ~1.5 mm
— will determine precision on that number
— Yuri continuing work to advance Irakli's approach to alignment
TPC meeting 18 January 2024
Present: Alexei, Tommy, Gene, Yuri, Jim, and myself
== Hardware
— Jan 7th-8th was large power dip
— several parts of the ring had no power
— STAR was without power for ~3 days
— restoration was a challenge
— lost Allen-Bradley interlock (1st time ever), CMOS battery had (finally) died
— Jim Thomas managed to recover Allen-Bradley
— Prashanth helped get new system connected to interlock
— also cleared flag to allow update
— system has been okay since last Friday
— Cathode was ramped yesterday
— no shorts appeared
— Tonko will start electronics testing
— possible will be an update at Ops meeting in couple hours
— Working to find uncertainty on target used for TPC position survey
— Expecting ~1 mm but currently unknown
— Start of run postponed until April 15th
== Electronics
— Nothing new reported this week
== Software
— Working through issues with Richard Thrutchley having enough statistics per DAQ file for SC
— Yuri sees some tilts in sector positions
— needs uncertainties mentioned above to
— Yuri also working on 5 years of cosmics to advance Irakli's approach to alignment
— so far only ~20% improvement in momentum resolution
TPC meeting 1/11/2024
Present: Jim,Yuri,Gene,Tommy, Flemming, Frank
Hardware:
The powerdip and subsequent power loss several days ago is slowly being restored to the WAH.
There are severe issues with the Alan Bradley safety system that prevents it from being brought back. Alexei and jim are looking into this. Wayne has also been asked to bringe (seveal) computers back to lift. It looks like either the cpu, or the fiber optic boxes has issues (in gas room or on platform).
Data:
Gene had looked further into the field cage current discussed last week.
1) The central membrane voltage change o day 157 from 27,995 V to 28,005 V after the shutdown caused by smoke incident and shutdown due to HDSD system. This change persisted to the end of the run.
2) Bimodal response in current , mainly inner, was seen during day 175-180.
3) Humidity caused issue (due to chilled water issues) for ~10M events on day 168. Considering marking these as bad- it is only ~1% of total data set.
Alignment
Yuri discussed results of survey of TPC to maget. Compared results from 2004 with 2023 survey. General small difference of < 0.1 mrad possibly 0.2 in alpha (rotation around x axis.
One puzzle comparing some distance measurements in x,y that were ~ 1mm from design drawings. See Yuri’s blog entry from 1/10.
FXT issue
Discussion on special issues for FXT tracking.
- Trigger gitter
- Ways to possible improve tracking for heavier masses.
- Yuri will pursue this further.
TPC meeting January 4, 2024
Present: Tommy, Gene, Jim, Flemming, Yuri, and myself
== Hardware
— Nothing new reported, Alexei back next week
== Electronics
— Tim and Tonko started working on outstanding issues (replacing cables, fuses, etc.)
== Software
— TPC survey was done, Yuri does not yet have results he needs from the survey
— they were promised to him for next week
— Yuri revisited alignment based on the studies shown by Rongrong before the holidays
— was some T0 change that was not accounted for and exploring alignment parameters
— would like to have alignment done for all of past 5 years
— Tommy working on TPC RS
— comparing DAQ 5k and DAQ 1000
== AOB
— Gene looking at field cages shorts from past couple years
— spotted a sharp jump of ~15 volts in central membrane voltage on Junne 8 2023
— decayed down by ~5 volts over a few days
— all 4 field cage currents showed a sharp rise at the same time though the decay profile was different
note from Jim after meeting
June 7th evening shift was a shutdown due to the Canadian Fires. The Fire Department was worried about particles in the air setting off their high sensitivity smoke alarms so they shut the alarm system down ... consequently all of STAR had to shut down too. So power was off to the Hall for several hours. Also, it appears that major work was done on the MCW system while other things were off.
Perhaps, when STAR came back up, the TPC Cathode was set to a slightly different value?
^^^^^^^^^ Beginning 2024 ^^^^^^^^^^
TPC meeting 12/21/2023
Present: Alexei, Tommy, Gene, Jim, Flemming, Rongrong, and myself
== Hardware
— Still no leaks after repair
— Survey was done, all RDO back in position
— Will hear back from Yuri on survey data after New Year's
— Alexei checked TPC movement against previous data, no movement of TPC within ~200 um
== Electronics
— nothing new reported this week
== Software
— Need to double check TPC field cage shorts records from 2022 and 2023 (Gene)
— Rongrong showed studies of hadron ratios and K0s widths
— see https://drupal.star.bnl.gov/STAR/system/files/20231221_Ks_hratio.pdf
— previously observed degradation of upsilon and J/psi resolution
— no obvious answers came up during the meeting
— some question about what to look at next to help diagnose the issue
== AOB
— see Rongrong's presentation linke
TPC meeting 12/14/2023
Present: Yuri, Alexei, Jim, Tommy, Gene and Flemming
Hardware:
TPC survey this week yesterday Prepared moving RDO. Says it would take 5 days and will not do this. Alexei and survey agree to several points on magnets on and compare with old /recent setup
Will need additional oxygen sensors.
Comment from Yuri: Incomplete survey previous. Hope that the two measurements can be combined.
Electronics:
After survey the checkout and repairs on the can complete.
Software:
Space charge correction work slowed down due to final exams.
Yuri checking alignment to revisit all cosmic data. No results yet.
Tommy confirmed that (what ??) DEV2 is working properly. (I missed this )
Also work on TpcRS
Issues for for alpha reconstruction in FXT environment. Tommy is looking at this.
From Irakli regarding revisiting the cosmic data for multiple years:
“Just want d to say that the files that are on RCF for the old comics data is only MuDsts, I prepared the same list to stage daq files. Will clean up my 2021 cosmic event.root files and stage those to look at some hit level alignment just in case.”
AOB
Several people will be out next week, but we will have a short meeting on 12/21, but not one at 12/28
TPC meeting 12/07 2023
Present: Alexei, Tommy, Gene, Jim, Flemming, Rongrong, Weizhang, Yuri, Yue, Sonoraj, and myself
== Hardware
— Monday Alexei fixed the bottle leak (using old style clamps)
— will watch over next 3 months
— Finished moving RDOs to make room for target for TPC survey
— now need to ensure all holes are clean enough for survey
— will request survey be done next week at 2 o'clock meeting today
— some beneficial adjustments made to scaffolding
== Electronics
— nothing new reported this week
== Software
— Run 22 SC (pp500) work is ongoing
— some impact due to vertex finding recently due to pedestal correction
— Yuri just finished dE/dx calibration for Run 19 AuAu200
— checked and found no surprises
— Now working on revisiting Irakli's alignment work with cosmics
— all five year with iTPC
— lacked some statistics for Run 19 and 20
— recovered those and now making some progress
— see https://drupal.star.bnl.gov/STAR/blog/fisyak/AuAu200GeV2019-dEdx-recalibration-new-model-has-finished
== AOB
— Yue Xu present on light nuclei acceptance in Runs 21 and 23
— links to slides will be posted to TPC list
— requesting a 10k production, keeping event.root, with libraries SL21d and SL23e
— Weizhang presented photonic electrons from AuAu 14.6 GeV using SL21c and SL23d
— comparison of nsignmaE (electron) between libraries
— links to slides will be posted to the TPC list
Yue also mentioned:
And the expected de/dx (Bichsel fuction) is:
1. For triton : dedx_expected = charge*charge*(TMath::Exp(Bichsel::Instance()->GetMostProbableZM(TMath::Log10(p*TMath::Abs(charge)/mass), 1)));
2. For helium3 :
Float_t ParfHe3Mean[4] = {29.3642,-0.983422,0.0958638,0.169811};
dedx_expected = ParfHe3Mean[0]*TMath::Power(p, ParfHe3Mean[1] + ParfHe3Mean[2]*log(p) + ParfHe3Mean[3]*log(p)*log(p));
Best
TPC meeting 11/30/23
Present: Yuri, Jim, Gene, Rongrong, Flemming, Irakli, Alexei, Weizhang
Discussion on tp high0 pt resolution. (cosmic, J/psi)
Lead in presentation by Rongrong Link
Presented results from looking at cosmics, 2011,2014 and 2018.
Irakli will take a look at these data, after having gotten location of these.
Rongrong will update presentation included opening angle vs pt for J/psi to see
If this can possibly explain some of the flat dependence of resolution vs. pt
Will also take a look of h-/h+ at high pt as Gene used this as one measure for QA.
Hardware:
Preparing for survey, cleaning holes, addition pins in order to get better handled of TPC position relative to magnet. Will bring up request for survey at next ops meeting.
Fixing of recent leak underway; gotten spare connectors.
Electronics:
According to Tim they will likely wait until the hardware repairs (leak) and survey is done, to finish the TPC electronics repirs.
Software:
Space charge correction; Quite good after 3 iterations, put in DB and will be used for test production. Will proceed to 4th but needs more statistics.
Test production fails for some DAQ files (FST issues causes crash)
Yuri back and will go back to looking at de/dx, alignment.
Has still outstanding pull request that has to be approved.
TPC meeting November 16
Present: Alexei, Tommy, Gene, Flemming, Jim, Irakli, and myself
== Hardware
— busy with ToF and MTD systems
— west laser down, needs some retuning
— another water leak found at 5 o'clock on west side (switched off)
— question about whether Tonko is done with sectors 5 and 6 in that area
— looks like sectors 1, 4, and 7 still need some work
— east laser has a burned spot on one of the mirrors
== Electronics
— nothing new reported this week
== Software
— Run 22 SC (pp500) 2nd pass looked good
— 3rd pass delayed a bit, still working on it
— Run 19 AuAu200
— some interest in reproduction
— calibration production for dE/dx should be done by end of week
— Irakli will follow-up with Xianglei on issue of which dB table to pick-up
— one question is where the jobs are actually running (LBNL or SDCC @ BNL?)
— Irakli gave Yuri all the alignment parameters, Yuri can update us when he returns
== AOB
— No meeting next week (Thanksgiving)
Weekly TPC Meeting November 9, 2023
Present: Alexei, Tommy, Gene, Flemming, and myself
== Hardware
— nothing new with TPC at present
— finished ToF recovery
— discussion with Yuri suggests survey of TPC and magnet should be redone
— need to coordinate with Tonko and others
— requires moving a RDO
— work appears to be ongoing, so need to know status
== Electronics
— nothing new reported this week
== Software
— working on Run 22 SC calibration
— 2nd iteration complete
— job processing is working
— improved SC in 2nd calibration also reconstructed pileup better (!)
— ended-up cutting more vertices and lost some statistics due to this
— overall is okay though because the efficiency is better
— jobs have also been optimized to run faster
— expect a 3rd and perhaps 4th iteration next week
— can then produce a preview production of pp500 data
— also want to look for fill-by-fill effects in SC
— right now it seems there is very little fill-by-fill variation
Weekly TPC November 2, 2023
Present: Alexei, Tommy, Yuri, Gene, and myself
== Hardware
— busy with ToF gas system
— was power interruption on platform
— Tonko continuing repairs
== Electronics
— nothing new to report this week
== Software
— work continuing on Run 22 SC
— hope for initial pass done within next 2 weeks (will allow first pass of about 20% of Run 22 data)
— Gene starting work on Run 23 SC
— some interest in reprocessing Run 19 AuAu 200 (does not have latest dE/dx model)
— would need recalibration with new dE/dx model
— calibration run coming in next couple weeks
— Yuri working with Irakli's alignment process
— checking results on Run 19 - Run 22 data
— improvement in momentum resolution looks too big at the moment
— Tommy working on gain, T0, and flag
— flag needs to be defined
— dead channels/FEE should also be included in dB (only in ASCII file at present)
Weekly TPC meeting October 26, 2023
resent: Alexei, Tommy, Yuri, Jim, and myself
== Hardware
— busy with ToF gas system
— still see activity from Tonko and others
— burned VME module was replaced, others cleaned
== Electronics
— nothing new to report this week
== Software
— TPC gating grid
— 3.85 GeV FXT data from May 2021
— see Yuri's slides posted to meeting agenda on Drupal
— simulation does not properly reproduce the time difference in GG opening between inner and outer sector
— anomalous delay of ~200 ns and ~600 ns for outer and inner sectors
— Comparison of prompt hits
— prompt hit distribution on inner sector is different between reconstructed and MC
— MC shows two peaks which is unusual in itself (possibly due to cluster finder?)
— RC shows three peaks
— in outer sector RC distribution is about 33 ns wider than MC (beta* = 10 m perhaps)
— Modifications in StTpcRSMaker, pull request #614
— unknown how to reproduce the problems of the failed test (about half)
— need to run tests interactively with particular library (but we don't know how yet)
— work continuing on Run 22 SC
— may need to start Run 23 SC soon, but currently no additional person power available
== AOB
— some desire to check alignment results with new data
— look at 2023 data with 10 Mevts (cosmics)
— looked at old and new (IDL) alignment, but also used new hit errors
— see approximately a factor 2 improvement in resolution in RFF
— in addition, the number of matched pairs drops by ~2 so there is a need for supersector alignment as well
Weekly TPC meeting October 12, 2023
Present: Alexei, Flemming, Daniel, Mathias, Tommy, Yuri, Irakli, Gene, and myself
== Hardware
— last Monday was smoke alarm in STAR
— smelled something from TPC FEE rack
— found problem yesterday, was burned VME module (discussed on Star-Ops list)
— Tonko now continuing with TPC repair (FEEs etc.)
— replaced valves to fix leak (valve between purifier and dryer)
— replaced dryer and started purifier recovery yesterday
== Electronics
— nothing new to report this week
== Software
— 3.2 and 7.7 GeV
— differences noted in nHits and DCA distributions as functions of eta and pt
— evidence of track breaking at central membrane?
— concern about jitter in trigger being root cause
— excess of hits in real data vs. embedding near end caps
— not yet well understood
— slides to be posted to the TPC list
— supersector alignment work from Irakli
— still see some improvement from outer sector then inner sector alignment
— setting supersector alignment parameters to zero seems to already give resolution < 200 um (in Y)
— Yuri would like to repeat the K0 short study with no alignment parameters (survey result only)
— compare K0 mass with tracks from same sector and from different sectors
— reminder that for supersectors, some overall shift, overall rotation, and overall expansion are convoluted
— new method needed for supersector alignment
— Yuri looking at effect of different length cables on region near end cap
== AOB
— Gene asks for some feedback on the level of statistics needed in a calibration sample for Mathias' studies
Weekly TPC meeting October 5, 2023
Present: Alexei, Flemming, Jim, Tommy, Yuri, Gene, and myself (Richard)
== Hardware
— work on both laser finished
— replaced lamps
— measured power
— switched work to gas system regeneration
— was another global alarm today
— already repaired once
— recent one (overnight last night) was a smoke alarm on second floor
— shutdown power to platform around secto 22-24
— Alexei investigated this morning and could smell something that may have burned
— also got a second opinion which concurred
— will follow-up with appropriate contacts
== Electronics
— nothing new to report this week
== Software
— trying to understand some observations in simulations
— working on FXT and new parameterization
— needs more time
== AOB
— Flemming will contact Irakli
Weekly TPC meeting September 28, 2023
Present: Alexei, Flemming, Jim, Tommy, Yuri, Gene, and Richard
== Hardware
— working on west laser
— some trouble with piezo driver
— found a way to make a better alignment tool
— began work on implementing it
— hope to finish west laser this week
== Electronics
— reply from Tim that they need about 1 more month
— need to fix fuses on many (~7) iRDO
== Software
— working on FXT and new parameterization
— needs more time
== AOB
— perhaps we could hear soon from Irakli about any progress
— understand there is some problem with iterations
— Flemming will contact Irakli
— Yuri sent some images of ALICE Pb+Pb events to TPC list
Weekly TPC meeting September 21, 2023
Present: Alexei, Flemming, Jim, Tommy, Gene, and myself (Richard)
== Hardware
— working on west laser
— PCB board was changed but didn't work properly
— can use board with external relay (but relay failed)
— have driver to run UV crystal
— will finish alignment this week
== Electronics
— Tim going through list from Tonko
— a couple power cables have been fixed
— still many fuses on FEEs that must be fixed
== Software
— continuing to meet with Richard to work on SC calibrations '
— Run 21 FXT dE/dx calibration is done
— see https://drupal.star.bnl.gov/STAR/blog/fisyak/Runs-XXI-fixed-Target-dEdx-calibration-has-been-done
== AOB
— Jim's thoughts on sector alignment to beamline
— used to assume the sectors were solid body rigid objects
— actually need 5 parameters, 2 additional to account for stretches of pad plane
— for iTPC, Jim accounted for all 5
— perhaps we should be doing the same 5 parameter procedure for alignment work?
Weekly TPC meeting September 14, 2023
Present: Alexei, Yuri, Flemming, Jim, Tommy, Gene, and myself
== Hardware
— have received a couple additional 6-packs (have 4 full and 1 ~30% now)
— this is about 90 days of supply
— moved 1 6-pack to front of building, sitting on concrete
— may need a roof of some kind
— measurements of TPC supports are complete
— TPC cannot move in north and west direction
— can move only in south direction
— will present next week
— west laser failed again
— have 2 spare boards, will check with those
== Electronics
— a couple of boards pulled (sector 4 for example)
— some contacts corroded on RDOs (due to water leak)
— question about corrosion on pad plane itself
== Software
— working on SC calibration
— may do an initial calibration and continue working if there is immediate interest
— see slides for conclusions and plans
— 2D parameterization seems to be insufficient, want to try 4D parameterization
— Gene mentioned there is some priority on FXT productions including 3p85 from Run 21
— may need to account for any new parameterization after those productions
== AOB
— Yuri out next week
TPC weekly meeting 9/7/2023
Present: Alexei, Jim, Gene, Yuri & Flemming
Hardware:
Alexei working on tuning lasers, tuning intensities, drivers o west side.
Revisiting CCD camera pictures taking at various times, with different filed configs. In total about 8-9. Will present findings next week.
Yuri and Alexei inspected TCP and supports. 4 points setup for each, 1 points fixed (for each) others can expand/move
Got delivery of methane, but in 12 pack w/o wheels. Not useful, will be returned. Attempt to get enough inventory one site for next years (24-25) running.
Yuri presented findings of analysis of RF and FF cosmics
Presentations at
https://drupal.star.bnl.gov/STAR/system/files/Cosmics_2023_RF_FF_0.pdf
Main findings:
There are offsets in momentum and dcaXY •
No explanation yet. Alignment ?
Discussion raised the issue if another survey of TPC+magnet is needed. Yuri pointed out previous survey was lacking good magnet survey.
Yuri is also working of FXT TPC response . Sees difference in vtZ in East vs. West tracks and fxt hit errors different than collider data. Need to be revisited
recent minutes mainly written by Richard Witt
August 31, 2023
Present: Alexei, Yuri, Flemming, Gene, and myself (Richard)
== Hardware
— both poletips have been opened as of Friday
— Tonko has started working on electronics (coordinating with Alexei's work)
— replaced laser lamps and tuning
— diagnosing west last
— may even replace trigger board
— gas system
— hope to be allowed to have 2 or 3 6-packs of gas on pad
— will have an additional concrete pad with additional 6-packs near STAR as well
— will continue laser work through this week and next
— will then begin to recover gas system
— Alexei has begun measurements of each support of TPC
— will show Yuri the measurement process used today (4 pm)
== Electronics
— nothing new this week
== Software
— FXT 2021 calibration data are available
— started 14.5 GeV data production from 2019 data (with latest dE/dx)
— Jeff downloaded cosmic data from HLT farm for Yuri
— have ~3M matched cosmic pairs, ~5M RFF.
— comparison of FF and RFF started
— have ADC files for cluster finder comparison
— some apparent rejection in online when cluster touches edge
— dE/dx in P23id
— Yuri has put pages documenting dE/dx production quality in production versions
— noticed a splitting in proton (and heavier) bands in newer P23id production
— thought to be related to ADC separation which is different between iTPC and TPX
— needs further investigation
August 24, 2023
Present: Alexei, Yuri, Flemming, Gene, Jim, Tommy, and myself
== Hardware
— will clean gas system
— prepare for recovery of purifier
— lasers working well as of yesterday
— will check sensors tomorrow with Yuri and discuss measurement of TPC movement during field flip
— retreat was yesterday
— information on gas limits was forwarded to CAD
— cabinets were cleared of old stock
— questions on limits were sent to CMS (Chemical Management System)
— limit was returned as 3,000 ft^3 (6-pack alone is 2,000 ft^3)
— looking for was to redistribute supply so as to come within limits
== Electronics
— presentations (Flemming and Tonko) were circulated and placed on the agenda page
link
— priority for next Run is to fix things and make small optimization changes, nothing major
— Gene mentioned we should also look test of system at 5k (limited this year due to run stop)
== Software
— Calibration production with larger vertex window is nearly done (about 5% left)
— still pushing on SC in Run 22
— may be some interest in preproduction of Run 22 data
— might need an early SC calibration to make that happen
— 2023 data
— offline vs online comparison of cluster finders should be repeated, should not be any change
— want to check quality of cluster finder in 2023 data
— want to revisit alignment using cosmics, but cannot currently access data
— last three days in particular
— HPSS blocked by production and HLT farm down(?)
— request in carousel appears to be blocked (sitting for 2 weeks)
— Looking at simulations (PHQMD model)
— difference in slewing between east and west in FXT
— cluster sizes and shapes are different in east vs west
— for FXT a different correction will be needed in east than in west
— dE/dx in FXT vs collider mode
— some strange behavior noted in some data samples
— trying to finish combined PID and can compare with different productions
== AOB
— Was mentioned at retreat, after Run 25, all the computing systems in the counting area will be de-commissioned (HLT farm, etc.)
se Jerome contribution to retreat (not posted yet)
— Cool-down will be Jan. 8th
— starting species is still undetermined (pp, AuAu, ?)
— PAC meeting Sept. 11-12th
August 17, 2023
Present: Alexei, Yuri, Flemming, Gene, Jim, and myself
== Hardware
— problem about gas from chemical management system
— exceeded our methane for building 1006
— we have 10,000 ft^3, limit is apparently 3,000 ft^3 (1 6-pack is 2,000 ft^2)
— will talk to safety folks
— perhaps limit is related to building, not gas pad?
— two issues, accounting and amounts we are allowed to use and store according to new limits
— Alexei will contact new safety liaison to pursue issue and solution
== Electronics
— Operations retreat next week
— Tonko will give update on status and plans
— Alexei mentioned operation meeting coming after this meeting
— plans will be discussed for next week
— plans for next cooldown are early January
— 28 weeks for Run 24 + 6 weeks remaining from Run 23
— Jim mentioned if Run 24 is going to go into July next year, we should develop plans for orderly weather stand-downs of STAR
== Software
— Opened vertex window from -200 cm to +225 cm
— production submitted
— will have event.root, picoDSTs, and muDSTs
— pushing on Run 22 calibrations
— dE/dx calibration for dAu200_2021 and 17p3GeV_2021 have been done, put in MySQL, and checked.
— Yuri is still working on fixed Target Central membrane track splitting and combined PiD with new dE/dx.
August 10, 2023
Present: Alexei, Yuri, Flemming, Gene, Jim, Daniel, Tommy, and myself
== Hardware
— Last weekend ran cosmics
— TPC circulation was stopped Monday
— Argon was run for two days and yesterday switched to "summer flow"
— West laser was inspected and has started working again
— replaced a couple of blown fuses
— laser stopped again, but has since returned
— Alexei will start investigating with spare trigger boards
— No official information on start of next Run (24)
— will be at least 18 weeks away
— next run should be 20+6 weeks total
— Discussion about repair of TPC
— expect a timeframe of September to October
== Electronics
— Report on cosmics recorded was sent to the list (copied below)
—The cosmic FF runs were very successful. Some runs were lost due to west trim coil trips
— once unnoticed for several hours, and one during night with slower response for help.
— In all we took good data for 34 hours since Friday with
—16.88 M cosmic1-cosmic3 triggers and 50.7 M cosmic wide triggers
— includes of the the first sets of triggers.
— This is about 75% more events that Yuri requested for this data sets.
== Software
— FXT 2021 3.85 GeV had higher beam intensity than any other energies
— requires attention on SC
— Yuhang did simulation with Gene of what SC should be
— results were used and included in dB
— T0 fields are empty in the dB for this dataset
— Gene uses prompt hits in his method to determine e-by-e T0
— does not correct for the mean T0
— Yuri says there is a T0 offset (jitter) of about 14 ns (1/2 time bucket)
— only seen in 2019 3 GeV data
— but need to check other energies
— need to confirm that trigger decision time has not changed
— Yuri needs ~10k — 100k events and disk space for studies of T0 and vertex resolution issues
— please remove any data from TPC spaces that you no longer need
— Daniel says a preview production of FXT 3.85 GeV would be interesting and useful
— Yuri supports a preview production as well and a dE/dx calibration production
— important to have all primary vertices there and all tracks from pileup vertices as well
— Gene mentioned that the T0 calibration usually done may not be useful for zero bias data
— d+Au SC calibration
— calibration was done for dE/dx and ToF
— day 180-188 is the window
— days 180-182 had collider trying to introduce beam crossing, but introduced high background
— distortions were symmetric between east and west (but should not have been)
— more calibrations work to be done for days 180-182 (see mass^2 splitting in BToF for example)
— days 180-182 account for about 20% of the set, may want to skip that part at least for now
— Yuri on 17.3 Au+Au and 2021 d+Au
— made first pass over data
— dAu has slightly worse dE/dx resolution
— would like a few more days to update values currently in dB
— Gene mentioned 17.3 GeV is higher priority if need to choose
August 3,2023
Present: Alexei, Tommy, Yuri, Gene, Jim, Zachary, and myself
== Hardware
— West laser function was lost and is being repaired
— electrical problem, not mechanical
— polarity switch is ongoing (started today at 9 am)
— position of TPC was noted yesterday
— also trying to fix temperature in DAQ room (still 90 deg.)
— several systems currently off due to high temp
— have ~10 days methane supply remaining
— decision on whether to resume run should be made tomorrow
— can decide on what to do about low methane supply then
— current consumption is about 1.5 l/min
== Electronics
— Flemming sent an update to the list separately
== Software
— Zachary looking at dE/dx in FXT with new calibration production
— in FXT from 2019 and 2020 there is a ~2 sigma offset for the proton band
— in all energies but 7.2 GeV (which had not yet been produced)
— new calibration is closer but still ~1 sigma off (band is above expected position)
— has a recalibrated set, using Bichsel fits to proton band, up to 5.2 GeV
— ToF uses dE/dx identified protons and pions for finding common T0
— above reported offset affects that algorithm due to magnitude of offset
— implemented a T0 "afterburner" with recalibrated nsigma
— demonstrates recovered identified protons with recalibrated method
— will look at effect in new P23id production
— Bao Xin working on SC calibration for Run23
— all working, now using most recent data
— can ask him to document his procedures for the next person who works on SC
— Richard T was at BNL for AGS/RHIC meeting, met with Gene, and is working on Run23 SC
— Yuri was blocked (job submission) since Monday
— still exploring split in nHitsFit near membrane in 3.85 GeV FXT
— also working on jitter in FXT and anomalous temp and pressure dependence of dE/dx in 17.3 GeV
— then will finish combined PID
July 26, 2023
Present: Alexei, Flemming, Tommy, Yuri, Gene, Jim, and myself
== Hardware
— TPC systems are stable and working well despite temperature fluctuations in control room, etc.
— currently on last supply of gas bottles
— order has been in since February, delivery is the problem
— remaining gas may last about 17 days
— backup plan is to find single bottles as needed if current supply runs out
— Alexei says there are no single bottles of methane on site at BNL
— Received all parts to connect magnetometer to the system
— will start to monitor field when returns from vacation
— Gene checked humidity from dB
— getting up above 40 most days
— unusual spike in humidity that corresponds to temperature spike
== Electronics
— system continues to perform well
— temperature in the DAQ room is quite high
— some CPUs are 20 years old and may not shutdown automatically if they overheat
== Software
— conversing with ops folks on a test for gating grid during high luminosity running
— likely won't happen this week, sPHENIX not ready for high lumi
— maybe next week, but Jeff is gone then
— Gene was asked question about abort gap cleaning
— causes large background dumps into STAR
— trade-off is beam quality degrades over fill
— alternative is to do cleaning every second
— causes a nice sawtooth pattern of SC in TPC every second
— problematic for low energy running
— Gene looked at cleaning test this past week
— could not see anything above ~.2 mm distortion as a result
— if beam intensity is increased will need to re-check, but okay for now
— SC calibrations
— Work on Runs 22 and 23
— Temple group on Run 22
— Bao Xin on Run 23, nearly complete with 1st calibration, maybe done next week
— Calibration productions for AuAu 17.3 and dAu 200 are done
— Embedding seems to have issue with respect to real data in 2019
— nothing to be done for real data
— production was started with no change to e-by-e T0
— Yuri put presentation on meeting agenda
— Yuanjing Ji noticed splitting in nHitsFit near central membrane in FXT 3.85 in embedding
— Yuri found same effect in real data for tracks associated with best primary vertex
— seems not to depend on eta
— 2nd problem noted by Tommy, broadening of vertex difference distribution using tracks only from east or only from west
— could be related to increase in beta* (~1m for collider mode, ~10m for fixed target)
— 3rd problem is the need to revisit primary vertex ranking for FXT data
— for example, does not use information about tracks with prompt hits or pileup hits, etc.
— also need to consider effect on combinatoric background for secondary vertices
— it seems that the PVZ cut is not sufficient to eliminate this problem
— plan is to introduce -35 ns offset in trigger, get estimate of target Z and use Z_w from KFCS to control jitter
— will also ask S&C to optimize primary vertex ranking for fixed target and remove PVZ cut
— should not interfere with QM2023
July 19, 2023
Present: Alexei, Flemming, Tommy, Yuri, Gene, Jim, and myself
== Hardware
— nothing new to report today
— only concern is about methane delivery
— have about 30 days
== Electronics
— system continues to perform well
— test was done with TPC at 70 kHz (ZDC rate) for rare trigger program
— performed well
— no more problems than usual
== Software
— dAu and AuAu 17.3 SC calibrations are done (Run 21)
— 17.3 calibrations took only a day
— all information has been uploaded to dB
— large calibration productions have been produced from each of those datasets
— TPC dE/dx can now go forward
— no activity in SC from Run 22 and 23
— high luminosity coming, should check for GG leak since have best sensitivity there
— will be looking for changes to distortions due to different GG rate
— Event-by-event T0 in FXT data
— PWG has seen track breaking across central membrane in FXT data
— concern that may be T0 (but have not ruled out drift velocity)
— Gene looked at prompt hits (sent findings to list yesterday)
— only ~20% of events Irakli looked at may have issues (due to side of EPD used or 0 timing from chosen side)
— actual impact on dataset from that 20% is not easy to see
— Tommy suggested using simulations to determine expected effect
— Gene asked for a link to the presentation that originally reported the issue but we do not know which one
— dE/dx for FXT in Runs 19 and 20 is done and entered in dB
== AOB
— Richard is being added as a reviewer for TPC code
June 29,2029
C meeting June 29, 2023
Present: Gene, Jim, Yuri, Tommy, Alexei, Flemming
Hardware-
Summer is here. TPC handle pressure variation during storms well.
Laser ok. Vdrift dropping to 5.42. There is gas in the current six-pack for another 5 days.
Alexei on staycation, and will follow gas situation closely.
The quote for new HV for Cathode HV supply was finally pinned. BNL wanted US firm, but we ended up having Wiener approved for this purchase. 28 wks delivery
Discussion on connectors for wiener different from Glassman, and how to implement. Alexei will consider and discuss with Tim C. how to do this (for next run)
Question on Gating grid performance. No issues with device. Gene will still like take several runs
with same beam condition and rates from 1 to 5Hz. Will come with request again, as it was not well received at 10 o’clock meeting.
Suggestion in retrospect: send the request to ops list, and outline plan; indicate it was discussed already at trigger board.
Electronics
DAQ5K is now operational, with all of TPX and iTPC firmware updated. Some TPX RDO’s have issues at high rate. Likely related to electronics components. Some FEEs have been masked out.
Some tuning still to be done for iTPC part. MB-zdc triggered data runs at ~4.2 kHz, and optimal at 13 KHz input trigger rate and ~50% dead.
Software
Yuri discuss work by him and Tommy regarding the RRF vs FF data.
See
https://drupal.star.bnl.gov/STAR/system/files/OO200GeV2021RFvsFF_2023ReV_1.pdf
For details. Main point is that only run 21 OO FF data shows issues. Implement a non-understood fix of having additional 1 mrad rotation for run 21 FF running.
Not in agreement with measurements taken before this years run. Will have to be revisited by measurements at end of run23 (September) FF filed cosmics and measurements,
Yuri also show results from de/dx calibrations of the 7.7 and 19.6 GeV data. Overall looks good, but small differences looking at decays of phi and lambda’s
See
https://drupal.star.bnl.gov/STAR/system/files/RunXIX_XXFXT.pdf
For details.
Yuri also pointed out that the new clusterfinders and pad respeonce has to be investigated. Important for embedding.
Some progress on space charge (Gene)
Three prongs
1. Looking a dA data , symmetrc (background) vs asymmetric (dA coll)
2. Pp500 Temple work; identifying runs, trining new person
3. Initial run23 SC particular for HLT online.
Have a good July 4th.
June 22, 2023
Minute TPC meeting June 22, 2023
Present:
Jim, gene, alexei, tommy, , flemming, yuri
Hardware
--quote for cathode is been requested for 6okV 60 kV supply , 14k$ and lead time 28 weeks.
This is what Tom Hemmick is using for sPHENIX, and Alexei decided to pick the same after discussion with Tom.
- gas impurity showed again with the most recent exchange of 6-pack and the vDrift is down to
What happened with the first of new supplier.
Methan left for 12 days. Note after meeting. Prahsanth said today(Friday) that he expects delivery today of 2 six-packs
-Could be possible have a sample bottle, and check composition gas tomography e.g. in Chemistry? (FV). Alexei will follow up
Electronics –
3 more sectors 4-6 now with daq5k . Some readout issue with adc’s for sector 4-1, clusters ok
Software
- pull requests that has been stalled (some of Yuri’s) have been approved
finished up calibration fixed target dataset. Looks good. Will need a couple of more days for checking. Should be done by Monday.
The 19.6 is in database. Gene will start production. 7.7 needs update due to minor update (a few % correction)
Working on combined PID.
Yuri had asked Tommy to look at the production data for RFF and FF production data full field data going back to 2010 and look at the quantity
“dY in SCS versus sector and Z zx projection”.
Summary plots as well as summary table shows clear modulation for FF data are in in https://www.star.bnl.gov/~ctsang/Alignment/dYS/
Tommy’s table summarizing this is in
https://www.star.bnl.gov/~ctsang/Alignment/dYS/summary.html
The summary from Tommy is
Signification sinusoidal modulation in cluster – tracks vs sector is only found in Full field results on 2021. It is not seen in Reversed full field or old full field results. Therefore a special rotation should be applied to FF data on 2021.
Recall that this was not supported by Alexei measurements. Suggest to introduced rotation for run 21.
June 15,2023
Present: Alexei, Flemming, Tommy, Yuri, Gene, David, and myself
== Hardware
— water leak at blower
— problem with cathode HV supply
— discussed with sPHENIX
— Alexei investigating and getting quote for power supply
— long delay in production (~20 weeks)
— looking into use of alternative PS from test stand
— some concern about absence of good laser runs
— were not taken due to water leaks in magnet cooling system (under repair currently)
— expect will be better laser runs soon
== Electronics
— good progress
— TPX FPGA code is mostly done
— about 3 RDOs done in sector 1, started moving through sector 2
— may be some issue with timing
— but new code is running on a number of RDOs in system
— online plots are filling correctly
— hope to test much larger part of system next week
== Software
— Gene noted the volume of zero field data and its utility in calibrations and alignment
— discussed work with Temple
— students Charlie Clark, Richard Chruchley will be working
— SC for run 23, usually done by HLT group, new person this year, Baoshan
— Gene putting Baoshan in touch with Babu
— all 2019 and 2020 FXT runs done for dE/dx calibration
— Yuri working on dE/dx FXT 2019 and 2020
— FF vs RFF for 2021 is still a puzzle since no TPC movement has been detected
— O+O and 7.7 Au+Au were taken with FF
— other data after RFF change do not show same distortion
— 1 mrad TPC roatation shown by survey, but Yuri does not see that in his work
— only for 2021 FF does TPC appear to be rotated
— old survey position works before and after that period
— Irakli increased statistics by factor ~5
— Yuri working on combined PID in O+O data
— now trying to understand ToF
— want to better understand how ToF resolution is calculated
— Yuri looking into RDO activity map
— 2020 and 2021 data
— need confirmation from 2 independent experts
— currently only have one such expert
— expect strong effect on embedding for 2020/21
— New cluster finder
— after FPGA work is done, need to check what is produced offline and online (compare)
— expecting new drift velocity today
— Alexei says can check data from last night and this morning for new drift velocity
== AOB
— Request from Frank to present status of several TPC topics in next week's S&C meeting
— Richard will call to discuss with Frank and update the group
— Yuri also need some help from Tommy to run over as much data as possible from previous years for FF and RFF comparison
— years all the way back to 2013, etc.
— want to understand if the problem seen in O+O can be found in earlier data
June 8, 2023
Present: Alexei, Flemming, Tommy, Yuri, Gene, and myself
== Hardware
— two shutdowns due to water maintenance
— some smoke spotted
— STAR was shutdown as precaution
— coming back in next couple hours
== Electronics
— about 5 RDOs masked out for various reasons
— speed upgrade is moving forward
— TPC readout scheme issue understood
— will take out 1 RDO for tests
— confirm new FPGA code
— full test maybe next week
== Software
— Gene on SC for d+Au 200
— https://drupal.star.bnl.gov/STAR/blog/Geneva/Investigating-symmetry-Run-21-dAu200-SpaceCharge
— appears to be some additional component to SC from Au beam impacting the 5 cm -> 3 cm flange near z=400 cm due to high crossing angle
— some concerns about blue beam background in Run 23
— similar feature in "S" plots, but in upper left rather than lower right
— much smaller contribution overall
— perhaps a result of crossing angle
— Gene also mentioned PWGs are interested in dE/dx from 4.59 FXT data
— need some feedback on amount required for calibration
— 7.3 GeV dE/dx sample (~300k evts)
— approximately 1% improvement from new work relative to what's in dB now
— Yuri says better to do all runs together in one calibration pass rather than run by run
— work on O+O is still in progress
May 31, 2023
Present: Alexei, Jim, Flemming, Tommy, Prashanth, Yuri, Gene, Irakli, and myself
== Hardware
— ready to measure magnetic field
— cause of drop in drift velocity is still not certain
— new gas remains primary suspicion
— expecting some leak in methane
— Alexei is watching
— access yesterday
— restored driver for laser, both now operational
== Electronics
— no significant update this week
— things are going well
— watching for persistent effects in QA
— Yuri asks for a final date when TPC is completely upgraded
— no solid date, but group expectation is a couple weeks
== Software
— dE/dx calibration production for 19.6 and 14.5 was done
— will also requested
— 200 GeV d+Au space charge calibration is being examined
— was symmetric which was puzzling
— perhaps a large part of SC is not coming from collisions
— meeting with Temple group later this week
— discuss Run 22 500 GeV p+p SC calibration
— Yuri reported on check of dE/dx calibration for SL23c 19.6 and 14.5 AuAu
— resolutions are same so issue considered closed
— Yuri also reported on look at Run23
— anomalous drift velocity drop began after methane bottle was changed
— extended from May 24th to May 31st
— DV began to recover after bottle was changed again on May 30th
— no severe effect observed on dE/dx (effect is ~10%)
— some offset observed in z direction (need start time adjustment)
— some offset (~.6 cm) observed between east and west with opposite sign charges
— expectation is it's due to space charge
— K0short is slightly heavier than expected
— Yuri has posted slides shown above to the list
— Irakli reported on supersector alignment
— anomalous shift in local y (radial) as iterations appear to be converging in x and z
— small group of closely clustered sectors
— Irakli will post a link to the list with current results
May 24,2023
resent: Alexei, Jim, Flemming, Tommy, Yuri, Gene, and myself (Richard)
== Hardware
— some anode trips
— some problem with triggers
— currently running 6x6 bunches
— yesterday was good test for TPC
— ~7 mbar jump due to front
— laser plot (drift velocity) dropped about 1% this morning
— suspicion of new gas quality?
— still watching, has not bottomed out yet
— no motion of TPC was observed during polarity flip last week
— some discussion with magnet experts
— maximum current ripple occurs on ramp-up
— trip goes straight through diode to zero, no ripple
— conclusion is magnet trips cannot be the cause of TPC movement
== Electronics
— ASIC Thresholds
— request from Tonko to increase TPX ASIC thresholds from 3 to 4
— intended to reduce data volume to facilitate speed increase
— originally set threshold at 3 during BES since there was no data volume limitation
— Yuri does not anticipate a problem with change to 4
— needs to redo dE/dx from scratch in any event due to new cluster finder
— some concern raised regarding impact of new threshold on low pt electrons
— thought is we will actually have better ID on electrons than before
— will still require some work, Yuri is watching low pt electrons closely
— have better understanding of dE/dx than 5 years ago
— proposal to collect 2 million events with old threshold (3) at some point (for comparison)
— group agrees with changing threshold to 4
— Tonko is also improving FPGA code
— progress slowed due to downtime for water leaks
— ran successful test on sector 1 only, easily 5 kHz
— currently around 2.3 kHz for TPX
== Software
— Gene reports that there are currently many error and warning messages in the log (from Tonko's code)
— not urgent problem, just a note
— Tommy's script is setup running automatic QA work
— Yuri checked calibration sample for 14.5 and 19 GeV Au+Au
— looked at new dE/dx model
— ran 2 versions dev2 and SL23c, both are consistent
— no problem in 14.5 GeV, 2% shift in 19 GeV
— could just adjust by 2% and update calibration, could be done by Monday
— Yuri will send link to study plots
— few days to decide whether to keep as it is or update, by Monday
— Yuri still working on combined particle identification in O+O data (new dE/dx model)
— using information from TPC and ToF
— dE/dx needs new corrections for this, spline correction
May 11,2023
Present: Alexei, Jim, Flemming, Tommy, Yuri, and myself (Richard)
== Hardware
— water leak was fixed
— monitored 3D sensor during polarity flip this week
— no motion of TPC observed, somewhat surprising
— will continue to work with sensors to monitor any movement
— Jeff and Tonko working on DAQ
— some questions about magnet trips and magnet ramping procedure
== Electronics
— did not see data in outer TPX
— was error in new data structures
— event builders did not find proper data structure to fill
— is now fixed in online but not propagated to offline yet, request submitted
— most cosmics data taken so far has tracks only in half of the TPC (about 5 million triggers)
— due to problems with ToF
— Yuri will need to evaluate these for usability
== Software
— some questions about combined PID and dE/dx tuning relative to ToF
— some deviation from model
— different deviation for pions coming from lambdas vs. K0short
— trying to understand this difference
— for >1 GeV momentum
— Tommy delivered QA script to Gene
— waiting for response when Gene returns
May 4, 2023
Present: Alexei, Gene, Jim, Flemming, Tommy, and Richard
== Hardware
— another water leak has occurred
— opened pole tip
— in same place as before
— was repaired yesterday
— not leaking as of today
— poletip will be closed around 1 pm today
— performed one successful laser run, but frequency was unusual
— need more runs to compare
— Monday will change magnet polarity
— cosmics running now expected to likely begin this Friday
== Electronics
— Tonko working on problems that have developed since energizing the magnet
— maybe some remaining issues with power supplies
— goal is to be done by tomorrow
— will get about 2 days of FF cosmics at best
== Software
— nothing new this week
April 27, 2023
Present: Alexei, Gene, Jim, Yuri, Flemming, Prashanth, and Richard
== Hardware
— many problems currently
— cathode readout producing spontaneous trips (fake, but shutdown PS)
— cleaned-up and testing today
— pulse production for calibration also lost proper control
— replacing battery and reprogramming
— TPC circulation started yesterday
— magnet testing today (FF polarity)
— after magnet testing done will try for cosmics and lasers
— TPC appears to be sitting at fullest extent of motion in one direction (about 5 mm shift)
— northwest corner is fixed, look at motion on opposite side
— will check again when we have RFF polarity
— approximate time scale for having lasers and cosmics is today if all goes well
— STAR will be ready in the next couple days at the outset
== Electronics
— Tonko (on vacation now) communicated with Flemming
— struggling with updating TPX firmware (not stable)
— running in test setup (not on TPC itself)
— can reach 3.2 kHz, but faster scrambles data (likely software related)
— could impact physics goals for run (goals were based on 4.5-5 kHz)
— taking a step back temporarily
— will use first few weeks of run to improve
— new software framework on all DAQ PCs
— new cluster finder on TPC and TPX
— new network and events builders
— one iTPC sector (sector 1) running new firmware (need to watch it)
— make sure it's stable in cosmics
— if so will update other firmware
— will start changing TPX firmware upon return
— Gene can process incoming cosmics once a day at start
== Software
— about presentation from Yiding (updated from last week)
— checked low pt e- band that was observed in SL22b in SL23a
— claim is strange band is visible in all BES data
— band is not visible in SL23b processed data from 200 GeV O+O
— would be good to confirm by reprocessing an older set in SL23b
— Gene mentioned that the 19.6 GeV is already in the queue but may be far down
— will look at doing calibration production in SL23c for comparison
— on extra gain calibration
— mismatch in dB tables with actual RDO outages
— fixed some RDOs by hand for 2019
— tried applying same search to Runs 20-22 and found many mismatches
— lost RDOs
— Yuri has cleaned up Run 22, but many mismatches remain in other runs
— many are in Run 20 but 21 as well
== AOB
— Yuri will be absent next week
— but watching what's happening with detector and cosmics
— Yuri will also look at O+O to analyze some questions about TPC but also ToF
April 20, 2022
Present: Alexei, Gene, Jim, Tommy, Yiding, Irakli, Yuri, and Richard
== Hardware
— starting gas next week
— on west side there are a couple RDOs out
— thought to be on DAQ side rather than poletip closure
— was problem during interlock check
— sensor appeared to be malfunctioning on inner field cage air blower
— sensor was verified on bench
— was connected with cable that had been disconnected from global interlock
— report is CAD personnel removed resistor from cable but Alexei will verify
— resistor is crucial to operation
== Electronics
— Nothing new reported this week
== Software
— SC for fixed target in Run 21 3.85 GeV Au+Au
— iterative procedure appears to be converging
— some difficulties particular to fixed target must be overcome (vertex position for example)
— may not be able to do east west SC differential
— may be an additional T0 correction recalibration after SC is finalized
— Meeting with Temple University has been delayed slightly, forthcoming
— Yuri finishing RDO cleanup for embedding (in '20, '21)
— due to blocks of runs where RDO outages were apparently not recorded in dB
— changes committed but some iteration needed
— dE/dx calibration in O+O is in progress
— Irakli discusses his work on alignment
— see https://drupal.star.bnl.gov/STAR/blog/iraklic/Run-21-Alignment
— confirmed correct data set was used in plot discussed 2 weeks ago (bottom of page)
— some improvement in pt resolution
— work on study of residuals for new alignment and pre pass should be done by end of day today
— may not need supersector alignment
== AOB
— Yiding reporting on pt < 200 GeV tracks in 19.6 GeV (~200M events)
— see talk posted to TPC meeting agenda
— Yuri requested check of 7.7 and 11 GeV data
— anomalous band should not be present
April 6, 2023
Present: Alexei, Flemming, Jim, Yuri, Tommy, and myself
== Hardware
— Not much new to report
— Mostly tracing cables
— Did walkthrough
— told need new locks for lasers
== Electronics
— adjusting some PS voltages to find somewhat better operating point
— this is to try to mitigate some blown fuses
— about 12 adjustments done so far
— some firmware changes still being made
== Software
— Irakli posted an update page on his alignment work
— see https://drupal.star.bnl.gov/STAR/blog/iraklic/Run-21-Alignment
— referring to last plot on page:
— need some checks, but it seems initial survey of inner sectors was sufficient without additional alignment procedure for outer sectors
— some asymmetry observed in high(er) momentum tracks for existing and new alignment procedures
— possibly need to confirm with opposite field polarity as well
— need to understand
— would desire to start cosmics this year with FF to increase statistics
— next step will be supersector alignment
— final pass for clean-up of dead FEEs in BES data was prevented by power loss yesterday
— most corrections will be for Runs 20 and 21, 19 is mostly fixed
— expect to finish in few days
— may be an additional correction for PID in O+O that depends on mass hypothesis
== AOB
— Flemming expects to be absent for next two weeks
March 30,2023
Present: Alexei, Flemming, Jim, Yuri, Gene, and myself
== Hardware
— last week installed 2 magnetic probes
— poletip was inserted
— electronics all checked-out okay after poletip insertion
— have sufficient gas for a couple months (3 full 6-packs)
— each lasts for about 20 days
== Electronics
— nothing new for this week
== Software
— O+O production from Run21 has started (2 mag fields)
— SC calibrations
— discussed with Temple group (was change in personnel)
— work is transitioning to Richard Thrutchley
— will meet with them again in 2 weeks
— still have d+Au 200 calibration to do
— 3.85 GeV Run 21 FXT still needs SC calibration
— Yuri working on cleaning up dead FEEs for BES data
— looked at O+O production for PID
— some differences noticed but need to summarize
— no word from Irakli yet
== AOB
— nothing new reported this week
March 23, 2023
Present: Alexei, Flemming, Jim, Tommy, Prashanth, Yuri, Gene, and myself
== Hardware
— Working on lasers
— east alignment is finished
— both lasers are working and operational
— spare pump is in hand
— checked cathode today
— no shorts so far
— finishing structure to hold magnetic coils
— next week east poletip going in (on 28th)
— gas flow starting April 18th per operations meeting
— magnet polarity switching time about 3-5 hours (related to discussion last week)
— (Prashanth) now buying gas from Lindy (sp?)
— Prashanth ordered all needed gases
— AirGas actually supplying methane since Lindy couldn't deliver
— also ordered another 2 6-packs from different company
— Alexei suggested another possibility, Mathison (or Madison), Prashanth will follow-up
== Electronics
— summary in slides from yesterday
— just one RDO remains with some fuses to change
== Software
— information from Irakli
— will provide resolution vs. momentum for new and old alignment soon?
— update on O+O 200 GeV (RFF vs FF observed difference)
— revisited RFF O+O from August-September 2022
— see plots in agenda for today's meeting
— evidence from FF for an approximately 1 mrad rotation of TPC
— looked at vertices reconstructed from tracks in east only and west only in low lumi fixed target data
— see approximately 2 time bucket shift between east and west for fixed target (as reported earlier by Xiangli)
— see additional plot in meeting agenda
— Temple University transitioning TPC work from Babu to Richard Thrutchley
— will deal with Run 22 calibration
— good positioning for this work due to previous use of calibration in calorimeter for TPC calibration
== AOB
— Yuri updated RDO mask and dead FEE map for all BES data sets (fixed target runs only??)
— need to check if any issues remain for '20 and '21 sets
Friday: East side was finished
from Christian
Finished up around 2:30.
-14-4 RDO was removed, replaced with working alternate
-14-2 & 14-3 RDO cables had nylon braid put in over the splices and were put back in the cable tray
-17-1-3 FEE and it's cable were replaced (again), still failed; moved from -3 to -5 and it worked, Tonko will update mapping
Tonko checked all of sector 14 and RDO 17-1.
I looked at the other cable trays and didn't see any obvious problems with the cables and water lines.
We should be ok to insert the poletip whenever.
March 16, 2023
TPC meeting March 16,2023
Present: Gene, Tommy, Yuri, Alexei, Jim and Flemming
-Hardware
Alexei complete East laser alignment; Laser system is now ready for upcoming run
Next week will install ‘new’ magnetic sensors for additional monitoring.
Q: can these be interfaced to Slow Control (Monitoring)
- Electronics
- The TPX s8-3 RDO issue turned out to be a network card problem in the DAQ PC. West is ok a few FEEs are masked off for run
- East TPC should also be ready.
Gating grid tests
- Gene is proposing that we test the effectiveness (transparency) of the GG under different beam conditions.
- Aim to take short runs (<1 min) with 2,3,4,5kHz rate for MB data taking and similar for High lumi running later in the runs.
- Gene will talk to Jeff on setting up run configs so it can easily be run by crew. And with JG on beam conditions.
- The equest will be added to the TPC reafiness status
Pre run calibrations
Had long discussion on FF/RFF information that should be extracted. STAR magnet is currently wired for FF.
Yuri would like, now that Alexei has installed detector to monitor possible movement , that we switch a couple of times between FF , 0 , and RFF to see if a) there is a movement and b) if it is reproduceable. This does not need COSMIC data
It was not clear how this knowledge would translate into improved calibrations of TPC. Jim pointed out that (some) E-B mis alignment is already included in space charge distortions (static?). Gene commented that the main geometry calibration issue/uncertainties is related to the super sector to super sector alignment.
Yuri iterated that understanding if there are movements of TPC between FF and RFF will help for calibrations methods.
WWill bring the proposal up at readiness for TPC, but expect to get push back to the ‘cost’ (time, people,..) of doing multiple filed switches.
De/dx calibrations
Yuri pointed to the presentation at last S&C meetins that identified at FF/RFF difference between a correction that has been used previous for de/dx vs. position along wire attributed to wire to pad plane diff. See
https://drupal.star.bnl.gov/STAR/system/files/RunXXI%20OO200GeV.pdf
FV raised the issue why this shows up in OO at 200 GeV which has about equal positive and negative charge tracks with opposite curvatures.
+ Run 21 dAu200 SpaceCharge
- Babu continues to find essentially no asymmetry between east and west, despite historically seeing ~20% more in east
- Gene sees asymmetry in the lower luminosity Run 21 dAu data, but it disappears at high luminosity
- Recommendation from Gene was for Babu to process more high luminosity data to help investigate dependencies further
- Run 22 pp500 SpaceCharge
- Babu has plenty of SpaceCharge work to do even without Run 22, plus his physics analysis
- Gene has asked the PWGs to provide an additional helper to investigate possible fill-by-vill variations as seen in Run 17
- Good to educate more people about SpaceCharge anyhow, even if Babu does find time to work on it
+ New cluster finder
- Tonko expects it to be not just different, but "better"
- Tommy proposed a test with embedding to see if momentum resolution and acceptance improves as Tonko hopes
- Yuri suggests not to focus on momentum resolution, but rather efficiency
- Tommy will discuss with Tonko more
+ dE/dx adjustments by analyzers
- Tommy brought up artificial, empirical dE/dx nsigma shifting by analyzers for BES-I datasets
- Yuri says that's ok as a band-aid for older productions of iTPC era data, but that the new dE/dx model introduced last year should help avoid this
- Tommy is willing to work on a standard version of the empirical band-aid for people to use, and no one objected
March 9, 2023
Present: Flemming, Yuri, Gene, Tim, and myself
== Hardware
— SC3 very slow (controlling Gating Grid driver)
— several things have been tried but nothing successful yet
— may ask Wayne to reboot once more
== Electronics
— Discussion with Christian this morning
— east end work is done except for a few cable wraps
— problem since STGC installation
— fiber connection to one TPC sector 8 RDO 3 not working
— whole RDO is out
— will be investigated
— worst case would have to reopen poletip and fix connection
— but that should be a last resort and the decision would be based on size of dead area
== Software
— Babu working on d+Au SC and GL for Run 21
— Yuri showed slides on TPC23 cluster finder
— see https://www.star.bnl.gov/~fiscal/star/TPC/TPC23/
— differences in number of found clusters in outer sectors between online and TPC23
— different finders putting different bounds on found clusters resulting in more from TPC23
— efficiencies are lower for TPC23 at low-pt, high eta
— result is some track losses at high eta for TPC23 compared to online but losses are small and likely acceptable
— Guanan working on TpcRs
— still looking at differences in data width compared to simulation
— Yuri will send URL to TPC list
— Yuri still needs position of TPC with respect to magnet from survey
— Also waiting on comparison of momentum resolution from old and new alignment from Irakli
— also see https://drupal.star.bnl.gov/STAR/meetings/STAR-Collaboration-Meeting-Spring-2023/Pleanary-Session-I/iTPC-performance
== AOB
— Flemming will give an update to Operations meeting on status of TPC on March 22nd
February 23, 2023
Present: Alexei, Flemming, Yuri, Gene, Jim, Tommy, and myself
== Hardware
— East laser power supply had a leak
— pump was leaking
— have a spare and beginning repair today
— TPC water system has leak from spiral hose as well
— was repaired yesterday
— notified electronics folks that they may resume work
— some discussion about how to align with movement of TPC
== Electronics
— Nothing new reported this week
== Software
— Babu working on d+Au SC and GL for Run 21
— Run 21 O+O large calibration production is finishing today
— can provide to Yuri to look at dE/dx
— For O+O Yuri still has a puzzle from survey
— difference between FF and RFF
— factor 2 deviation was reduced but some residual still present
— looking at 2011 27 GeV FF data to see if rotation of TPC is there
— TPC23 cluster finder
— using same DAQ file for online and offline
— Yuri sees some difference in TPX outer sector(s)
— comparison of online and (TPC23) offline shows about 10% difference in clusters
— checking to see if difference is due to gain file
— Yuri says Irakli reported to have finished alignment with his new approach
— report is there is a big improvement in alignment, but need to hear from Irakli directly
— Yuri needs position of TPC with respect to magnet from survey
— Guanan has finished tune-up of TpcRs
— still some question about tails
— data slightly wider than simulation in time direction
— want to understand that
— next will be to check data for fixed target runs
== AOB
— Some discussion of plan for fixed target (with 3 new targets)
— we would like to see the drawings of the location(s) of new targets on east side
— Tonko back in Croatia
— software expected to allow us to start with ~4 kHz
— will get to 5 kHz a little later
February 16, 2023
Present: Yuri, Gene, Tommy, and myself (Richard)
== Hardware
— Nothing new reported this week
== Electronics
— Nothing new reported this week
== Software
— Babu working on O+O and d+Au SC and GL
— FF redone due to issue with tables
— high luminosity looks good
— low luimi shows some discrepencies
— will revisit once alignment is done
— can start large calibration production for O+O as early as tomorrow
— d+Au needs more attention once
— Yuri has some questions for Alexei on survey
— Guanan working on TpcRs
— investigating some issue with prompt hits
— Noticed Tonko has updated cluster finder
— some mismatch between inner and outer sectors
— misses last two padrows (71 and 72)
— believe there is problem with pad maps
February 9, 2023
Feb 9, 2023 TPC meeting
Present: Yuri, Prahsanth, Alexei, Flemming, Tommy
--hardware
Westpole installed. #d sensor installed before and can be viewed so we can observe movement when filed is turned on, changed polarity etc.
Water leak in East laser box. Alexei will investigate.
- After insertion 2 bad FFEs identified. Likely due to squeezed cable. Need to ensure better pre-closure inspection for future years.
Software
Tommy and Tonko identified one source of differences between online and offline clusters. Namely simulation of hardware asic that merged time sequences separated by just one empty timebin (below threshold) would be merged into one
Yuri reported that analysis of recent survey revealed that TPC is rotated relative to RFF.
Still needs to talk to survey group to understand coordinate systems.
Yuri reported (see meeting page) that the QA plots for pbar vs p vs pt for the period c (production nomenclature) ie. From after covid shutdown is different than before shutdown, Period “” and b .
January 25, 2023
Present: Alexei, Yuri, Gene, Flemming, Tommy, Prashanth, and myself (Richard)
== Hardware
— 3D sensor installed on west side
— glue is now dry, need to install wire
— expect a couple hundred microns accuracy
— poletip to be install Monday or Tuesday next week
— now shorts detected so far
== Electronics
— Tonko is done with checking west side electronics
— waiting for poletip installation for final check
— if check is okay will wait for run
— testing will occur at regular intervals
— all RDOs on east have been checked
— some FEEs remain to be checked and possibly replaced
— Tonko working on PC programming for DAQ speed-up work
== Software
— Gene found a workaround for SC and GL calibration jobs
— Babu paused dAu work to work on O+O
— RFF and FF OO calibrated as of Tuesday evening
— large calibration production will be ready to go shortly (once values are in dB)
— Richard will reach out to Irakli to ask about alignment work (CC Gene)
— Yuri working on understanding differences between data and simulation timing tails
— simulation tails are longer than in data
— using 2009 data (with no shaper)
— Also working on data from survey group
— Yuri may be out for a couple weeks
— Gene will be out week after next
— Tommy presented work on discrepancies between online and offline clusters
— shows comparison of clusters found by online and offline
— seems online CF is merging some clusters that offline finds separately
— one possibility mentioned is that dead pad mask may make a difference in how potential clusters are connected
January 11, 2023
Present: Alexei, Yuri, Mike, Gene, Flemming, Tommy, and myself
== Hardware
— survey finished with new pins
— will begin laser work once current measurements are done
— Tonko has been working with electronics since Monday
— still have not received documents from survey group
— will reach out to see what's happening with documents
== Electronics
— Tonko is presently at BNL
— going through electronics on both west and east ends
— just a couple RDOs have some problems
— hoping to have that work done by end of week
== Software
— Babu still facing some issues with SC and GL work
— O+O will still be higher priority than d+Au, so Babu will focus on that next
— Yuri says TpcRs tuning continues
— need to understand relation between actual chip parameters and those in the dB
— some question regarding signal shape on anodes wires and ALTRO chip tail cancellation
— Tommy working on online and offline cluster finding match
— trying to find mismatched clusters and recover pixel information
— difficult work, at text file level
— stay tuned
January 4, 2023
Present: Alexei, Yuri, Prashanth, Tommy, Gene, Flemming, and myself
== Hardware
— east side is finished from bake-out
— will start now fixing RDOs on east side
— also seems that survey is done on east side but Alexei has not received official word yet
== Electronics
— some delay in work waiting on beam pipe bake-out heat to dissipate
== Software
— Babu still facing some issues with SC and GL work
— O+O will still be higher priority than d+Au, so Babu will focus on that next
— final SC work should use final version of alignment from Irakli
— but should have the interim alignment results should
— 9.2 and 11.5 GeV dE/dx calibration finished
— checked with standard library, no diffs with dev
— dB timestamp should be taken from this year
— link to current status of work with new model (dN/dx)
— see https://drupal.star.bnl.gov/STAR/system/files/Revison%20STAR%20TPC%20dEdx%20Model_0.pdf
December 21, 2022
Present: Alexei, Yuri, Guannan, Tommy, Gene, Flemming, Irakli, and myself
== Hardware
— survey done on west but not east side
— Alexei (currently on vacation) trying to push a little to get it done
— found good way to put cameras for TPC movement
— Alexei will prepare short presentation upon return == Electronics
— inner sector RDOs on west side have been put backup by Alexei
— but on east side some RDOs still need to be returned to proper position — Alexei needs to talk to Tonko about east side before Tonko resumes work with RDOs on or after 1/1/23
== Software
— Gene mentions that Babu is still facing some issues on SC and GL
— PWGs now prioritizing O+O
— SC is ongoing for that but Babu needs some help from Gene
— once that’s done will move forward with TPC dE/dx etc.
— Irakli working on alignment, RFF seems to be converged
— FF does not seem to be in right place in X after RFF convergence (within 100 um)
— Yuri finished with dE/dx calibration (7.7 and 9.2 from 2020)
— have put calibration constants from new model in dB
— need final check with Standard Library
— Guannan is continuing work on deep tuning of TpcRS
— some problems observed
— Tommy continuing with offline/online cluster comparison
— 0.5% difference observed and must be understood
December 14, 2022
No meeting, but Yuri presented an update on dE/dx at the s&c meeting -
presentation
Electronics status presented by Tonko at analysis meeting -
presentation
December 7, 2022
Present: Alexei, Yuri, Gene, Flemming, Mike, and myself
== Hardware
— finished cleaning of all TPC except 12 points on east side
— interrupted by water leak
— expected that leak will be fully repaired this week
— Tonko nothing with TPC until Jan. 1st
— plenty of time for Alexei to finish work
== Electronics
— nothing new reported this week
== Software
— Yuri finished with dE/dx calibration (7.7 and 9.2 from 2020)
— will put calibration constant in dB and request production
— will prepare calibration for entire BES data set
— some other activities ongoing around combined PID (from all detectors)
— Guannan is continuing work on deep tuning of TpcRS
— Gene mentioned Babu has started working on SC and GL
== AOB
— Flemming mentioned minutes from QA board
— Run 20192001 shows anomalous drop in sector 1 in phi vs. eta
— not easily seen in QA plots (small)
— sector 1 had many auto-recoveries in that run
— seems that one RDO did not come back fully resulting in an inefficiency
— likely need a new QA plot to help identify this problem in the future
November 30,2022
Present: Alexei, Yuri, Irakli, Gene, Tommy, Guannan, Flemming, and myself
== Hardware
— Tonko finished yesterday
— much easier for Alexei to work on holes now
— expects to finish cleaning today or tomorrow
— needs to invite survey group to make extensive plan
— moving scaffolds, etc.
— need to make 3D tool to move fiber
— Flemming asked about water leak
— exact location has yet to be identified
— Robert Pak was notified (instead of Alexei?)
— CAD requested some parts to fix leak properly
— Alexei finished cleaning but would like to work on whole inner sector
— last 2 RDOs will shift a little bit (approximately 0.5 inch)
== Electronics
— talked to Christian on Thursday, some issues remain
— Tonko switched off all electronics yesterday
— however, this morning sector 15 (or 16 or 17 was found to be on)
== Software
— Irakli presents alignment work on '21 cosmics data
— previously kept outer sectors fixed and aligns inner sectors to them
— some issues found so now reversed procedure (fix inner and align outer)
— related to lack of knowledge about exact position of pad plane on outer sector
— we have a good survey of pad plane position on sector for inner (iTPC) sectors
— so, inner sectors are now being used as reference instead of outer
— deltaZ and deltaY converge quickly, deltaX is slower but seems to be converging with continued iterations
— iterations will continue
— supersectors still to come
— Gene on production priorities
— Run20 11.5 and 9.2, then 200GeV d+Au from Run21(SC and GL need to be finished)
— next comes 200 GeV O+O (has 2 field settings)
— need to understand static distortion and alignment issues beforehand
— working groups want a test production anyway
— will finish SC and GL for O+O
— then will move forward with preview production with whatever corrections state exists at the time
— Tommy working on automatic pull of histograms for QA Fast Offline analysis
— finishing work on differences in cluster finding results in simulation and production
— Yuri continuing iteration on constant dE/dx work (each needs a couple days)
— Guannan work on tuning TpcRS
— some discrepancy in clusters noticed by Xianglei
— needs to be understood
November 16, 2022
Present: Alexei, Yuri, Tommy, Geydar, Vinh, Gene, and myself
== Hardware
— checked almost all holes
— need to coordinate with Tonko now about non-interference with electronics work
— did not get to check 3D sensor fit yet due to activity on west side
== Electronics
— nothing new for this week
== Software
— presentation from Vinh on dE/dx QA from 7.7 GeV
— conclusion is that ToF m^2 cuts give, at best, only factor 10 improvement in reduction of misidentification (see talk)
— Gene asked if ToF group has studied the effect of tails on the distributions
— ultimately attempting to do combined PID with all detectors
— this is first step comparing TPC and ToF
— Yuri has frozen new modified dE/dx model
— calculating dE/dx from all BES data
— continuing iteration and work on methodology
— expect new dE/dx calibration for all BES II data soon, but not clear how soon
— Gene asked about choice of TFG22e library vs. SL22b
— only TFG offers KFParticle finder
November 09,2022
Present: Flemming, Alexei, Tommy, Mike, Gene, and myself
== Hardware
— continuing to clean TPC wheels for survey
— about 70% done
— Tonko is working inner sector electronics, so being careful not to interfere
— 3D sensor prototype has been built, looks okay
— want to put on TPC to check fit
— if okay will request manufacture of a support structure
== Electronics
— talked with Christian
— Christian has list of FEE cards to look at (about 10 in iTPC)
— few will need to be changed
— seems like mostly cable issues
— everything still moving forward
— Alexei needs some access to some areas being used
— need access once for testing and then again for mounting
— need to coordinate with Tonko to deconflict access
— will first finish with holes to which he currently has access
== Software
— reached out for space charge work
— project with Rice students on PID
— students should join TPC group for discussions
— Richard will check with Yuri to ensure the right names are added to the TPC list
— Gene mentioned the code updates to cluster finder from Tommy and Yuri look good
— some tuning still to be done
November 02, 2022
present:
Gene, Yuri, Tommy, Alexei, Chenlian Jin, Flemming
excused: Richard
Alexei; working on probes for survey.
Open questions cosmics for survey field A/B before run?
Gene: There is no progress on space charge for some BesII years: dAu, 17.6 GeV FXT
Also need for run 22
Will contact Temple.
Nhits issues solved. Will pay more attention to cluster status when selecting/counting cluster distributions
Yuri:
a) will wrap up de/dx model for higher Z. Couple of weeks.
Request that we have a presentations for model before presenting to collaboration.
b) There is interest in making common PID (de/dx,btof,etof,...) for BESII data set from Rice group. Will like to use tpc meetings and e-mail list for this activity.
Suggestions add and invite this group
October 26, 2022
Present: Flemming, Alexei, Tonko, Yuri, Tommy, Mike, Gene, and myself
== Hardware
— continuing to clean holes for survey
— building 3D sensor for TPC displacement measurement
— no measurement possible until March or April due to construction
== Electronics
— expectation is everything will be done, including debugging and verifying, by March, 2023
— includes rewrite of FPGA firmware, rewrite of DAQ framework, and new cluster finder
— note that verification of TPX will require tracking (deconvoluting stage)
— should be done within next 2 weeks
— cannot spend time on discrepancies in embedding right now, will be revisited later
— hardware should be done earlier, by end of January
— current hardware work (RDO repair, etc.) is proceeding slowly
— requests will be made regarding how to adjust the scheduling
== Software
— Yuri and Tommy investigating embedding
— checks have been done for Runs 18 and 19
— software commits have been made
— some issue with backward compatibility
— one line of code should fix
— similar problem to be addressed in Run 17
— work on dE/dx model continues
— Irakli continuing alignment work for Run 21
October 19,2022
Present: Flemming, Alexei, Yuri, Tommy, Mike, and myself
== Hardware
— determined 3D sensor to be used
— tools ordered to make extensions for CCD cameras
— need to order better scales (0.5 mm scales)
— working with survey targets
— will move some RDOs to have 4 points visible
— question to Yuri if 150 um accuracy is sufficient
== Electronics
— talked to Christian
— some small problems remain with the RDOs
— have water back now and some things taken to lab
— Tonko was notified that water has been restored
== Software
— Yuri and Tommy investigating embedding
— efficiency online and offline are different in Run 18
— due to gain table
— interface changes were made to fix loading of gain file
— some differences remain, investigation continuing
— need 1-2 more weeks
— work on dE/dx model continues
— calibration files generated for Run 20
— Irakli joined alignment work for Run 21
— results will be forthcoming
October 5, 2022
Present: Flemming, Alexei, Yuri, Gene, Tommy, and myself
== Hardware
— still working on two options (sets of readouts)
— these are for the 3D sensor
— need a non-magnetic 3D sensor but almost no options for that
— Bill is done with the survey device
— tested and has ~50 um accuracy
— various holes around TPC need to be cleaned (filled with corrosion or debris)
— work also proceeding on TPC electronics (power supply checks, etc)
== Electronics
— nothing new reported this week
== Software
— Two issues discussed
— embedding for Run18 was first
— offline cluster finder finds more clusters than online cluster finder
— was due to gain table
— issue has returned, Tommy is working on it
— Flemming agreed the problem looks to be related to the gain table based on plots shown in the software and computing meeting
— other issue is 7.7 GeV dE/dx
— Rice group has found some deviation
— shift is thought to be due to muons from pion decays
— Yuri working to improve dE/dx model
— need to use data to correct model
— ultimately would want to use integrated detector subsystem information to correct model
— Rice may have one or two more student that can contribute to this effort
— also 1 more student from Dubna who will work on PID issues
August 17, 2022
Present: Flemming, Alexei, Yuri, Mike, Tommy, and myself (Richard)
== Hardware
— methane leak is now something like 2 cc/min (very small)
— Alexei can now access scaffolds for lasers
— also need to access areas that are outside scaffold volume (for 8 and 10 o'clock laser boxes)
— will need an additional platform of some kind
— talked with Bill Strubele about repeating survey with new tool
— will report back any issues
== Electronics
— Tonko was waiting on feedback regarding energizing the electronics
— this is for remote operation of FEEs
— Tim will contact Tonko
— important for inner TPC sectors where replacements have been done
— Tonko believes he will be done with most work in programming FPGAs in about a month
— can give status update at collaboration meeting
== Software
— discussion of some disagreement on nSigma in 7.7 GeV ('21) at Software Group meeting
— some discrepancy with regard to
— in work on dE/dx for composites see ~3% shift between positives and negatives
— positives slightly higher than negatives
— same effect is also observed _in_simulations_ (puzzling)
Hardware update,
More on de/dx for 7.7 GeV auau
update from Alexei of TPC electronics readiness
About 2-3 weeks ago we had power dip and since I not paid attention to platform. I found some TPC VME crates and TPC FEE VME were OFF. I powered FEEs from platform(all PS have green LEDs) and control room, everything looks OK, but red LEDs on TPX PCs: 2, 24, 25-36 remained red.
August 10, 2022
minutes
July 27, 2022
Present: Alexei, Yuri, Gene, Tommy, and myself
== Software
— some slides on current state of dE/dx model work
— will be updated as work progresses
— will post slides with current status (keeping in mind there is more to do)
-- see
https://drupal.star.bnl.gov/STAR/system/files/Revison%20STAR%20TPC%20dEdx%20Model.pdf
July 7, 2022
Hardware update. Survey done, Short repaired,
Software de/dx modle update
minutes
June 29, 2022
hardware update. Prepare for survey. Concern for Ar availability
software Tommy,Yuri have been comparing cluster finders offline/online
minutes
June 22, 2022
Hardware update, survey. TPC
electronic speedupgrade, repair status
software update
minutes
June 15, 2022
Updates on survey plans
minutes
June 8, 2022
Updates on old vs. new cluster finder, simulated charge distribution from fixed target
minutes
June 1, 2022
Updates on dE/dx work, old vs. new cluster finder, simulated charge distribution from fixed target
minutes
May 18, 2022
TPC survey delay, inner sector wires, electronics update, 7.7 dE/dx work
minutes
May 11, 2022
gap measurments, 3D sensor prep work, inner sector wires, electronics update, 7.7 dE/dx work
minutes
April 27, 2022
nitrogen switchover, 3D sensor prep work, spare inner sectors, space charge corr., 7.7 dE/dx work
minutes
April 20, 2022
survey results, electronics status end of run, 7.7 de/dx calib done
minutes
April 7, 2022
prep for FF/RFF survey, space charge corr, updated manuals
minutes
February 2, 2022
discussion on added CF4 to TPC, methane shortage, run19 FEE status tables complete
minutes
January 12, 2022
to from run22 submitted, many RDO failures, look at skipping alt row for reco (pp500)
minutes
December 1, 2021
Analysis of shorts, laser response, tpc blower fixed
minutes
November 24, 2021
Some results from short measurements, Open issues ahead of run, missing Vdrift for a day.
minutes
November 17, 2021
Magnetic field settings reading GG slow control layout, short discussion, variable vdriftd
minutes
November 10, 2021
Plan for measurements for field cage short,
minutes
November 3, 2021
West field cage short; run 19 space charge; upcoming calibration issues.
minutes
October 27, 2021
TPC electronics status (Tonko), Laser West repaired, 19.2 GeV space charge nearly complete.GG slow control.
minutes
October 20,2021
hardware status, GG driver, calibration update(Yuri) see
slides
minutes
October 13, 2021
hardware status, cosmic request for run22 startup
minutes
September 22,2021
9.2 TPC space charge cal completed,
Embedding issue for FXT Xianglei discussed.
minutes
September
September 8, 2021
brief meeting ; hardware cathode control
minutes
September 1, 2021
minutes
August 25, 2021
NMR status, laser progress
de/dx short term time dependence, helpers for calibration
minutes
August 18 no meeting
August 11, 2021meeting link
agenda: hardware, calibration and software update
minutes
August 4, 2021 meeting link
agenda:
- hardware status
-- gating grid
- calibrations
- TPC tasks for calibrations, software maintenance
-- presentations on meeting link
minutes -
December 9, 2020
Agenda:
-hardware status
- software
--- alignment progress
---
https://drupal.star.bnl.gov/STAR/system/files/he34embedding4th.pdf
--- AOB
meeting link: https://drupal.star.bnl.gov/STAR/event/2020/12/09/tpc-weekly
December 2, 2020
agenda hardware status
meeting link and minutes : https://drupal.star.bnl.gov/STAR/event/2020/12/09/tpc-weekly
November 18, 2020
agenda:
hardware - SF4 tests; laser system
software; 3He efficeincies, track splitting - see talk on meeting event page
aignment progress
meeting place: https://drupal.star.bnl.gov/STAR/event/2020/11/18/tpc-weekly
November 6, 2020
Discussion points:
TPC power cables
Installation of Gating Grid reinstallation
Presentation on 3He efficiencies
Clusterfinder offline vs online
meeting place https://drupal.star.bnl.gov/STAR/event/2020/11/04/tpc-weekly
October 28, 2020
Discussion points:
hardware: TPC gas investigation; electronics repair
software: GG turnon effects
meeting place https://drupal.star.bnl.gov/STAR/event/2020/10/28/tpc-weekly
October 21, 2020
Discussion points:
hardware: gating grid driver
software: Super sector alignment procedure
meeting page https://drupal.star.bnl.gov/STAR/event/2020/10/21/tpc-weekly
October 14, 2020
Discussion points
Hardware: TPX sector 13,14 powersupply cable repairs
Software: Super sector alignment procedures
meeting page https://drupal.star.bnl.gov/STAR/event/2020/10/14/tpc-meeting
minutes available on that page
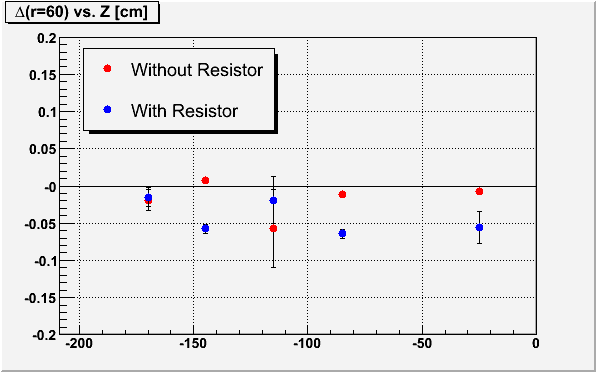
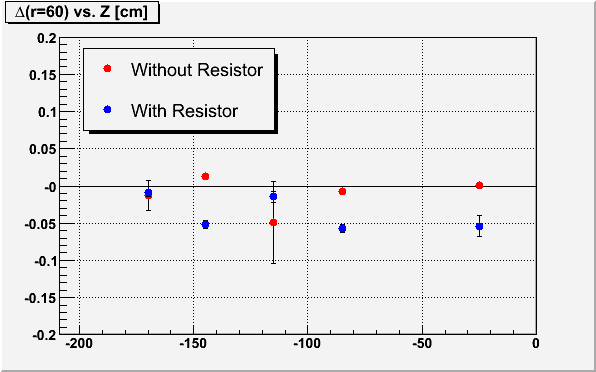
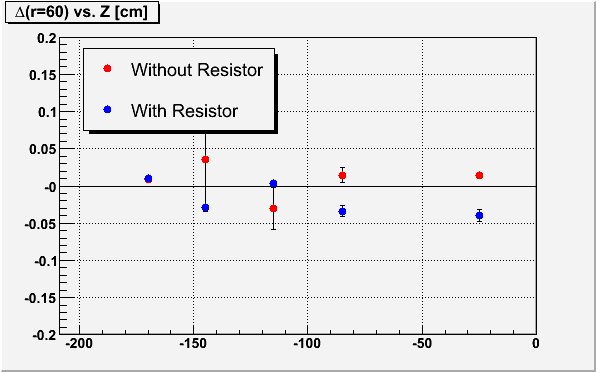


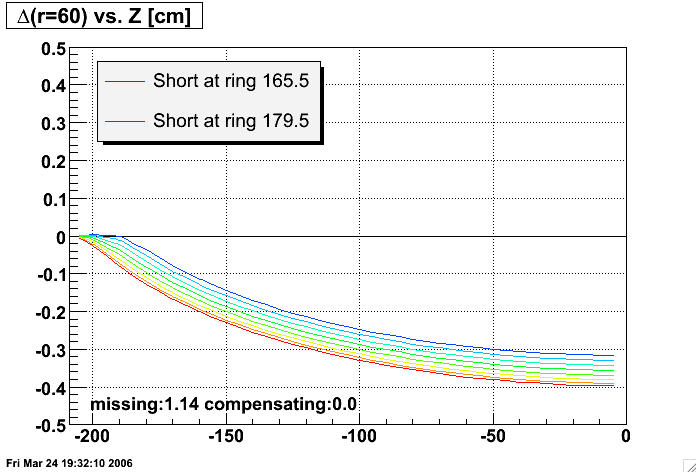
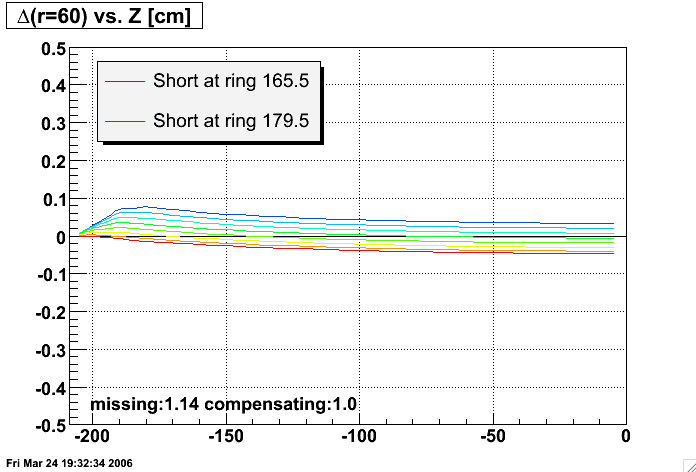
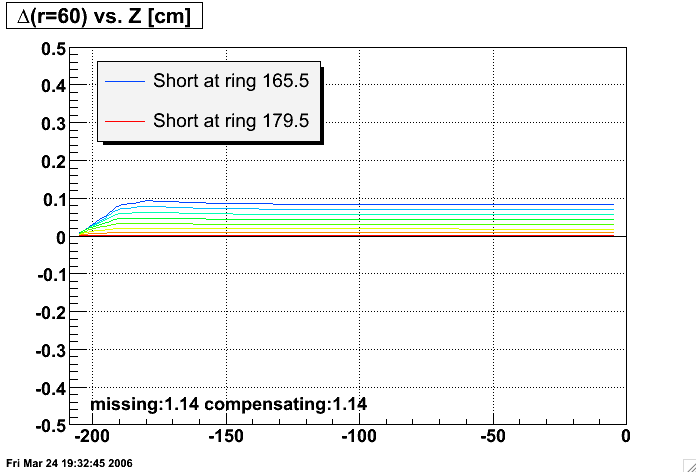
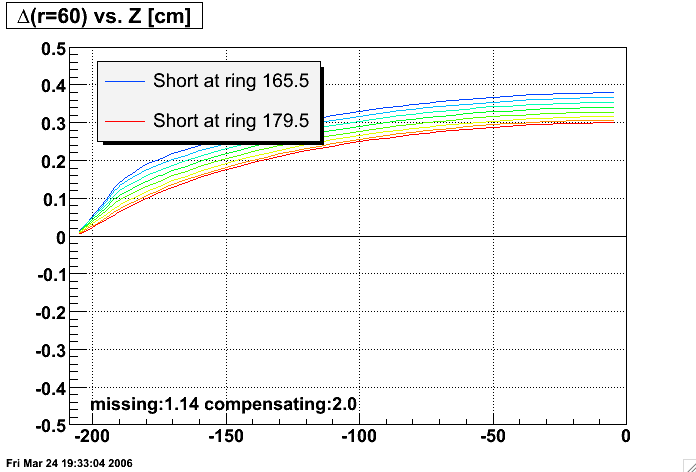
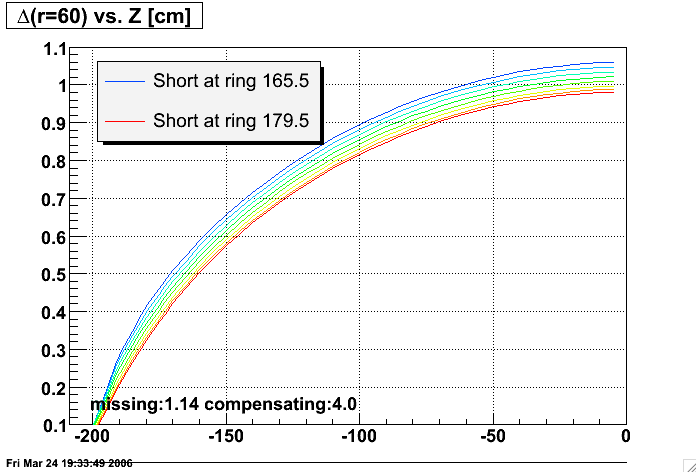
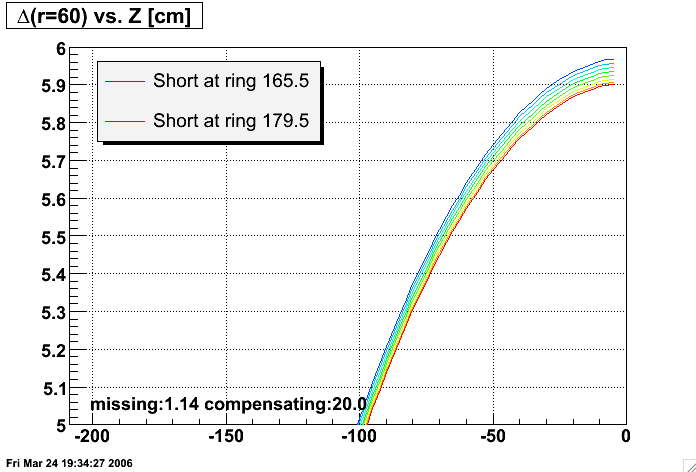
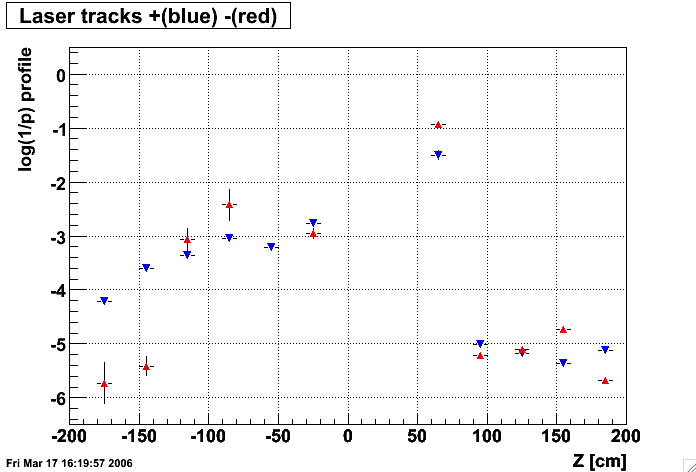
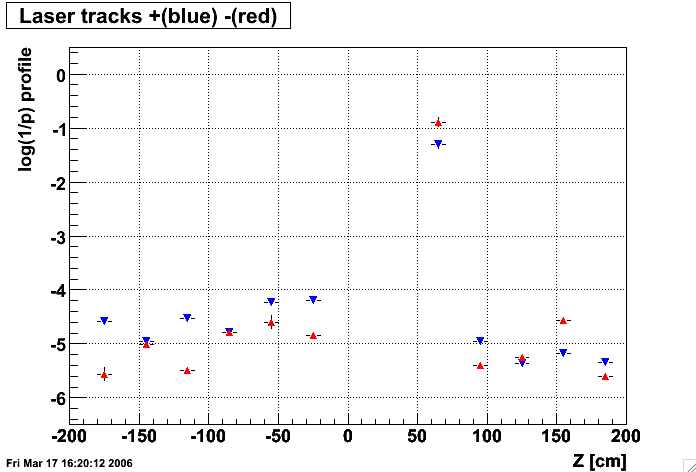
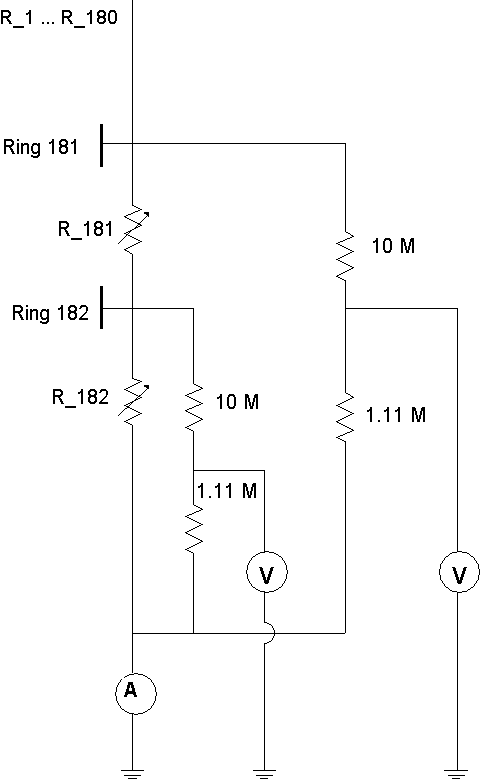
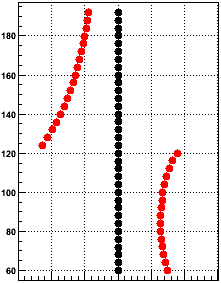
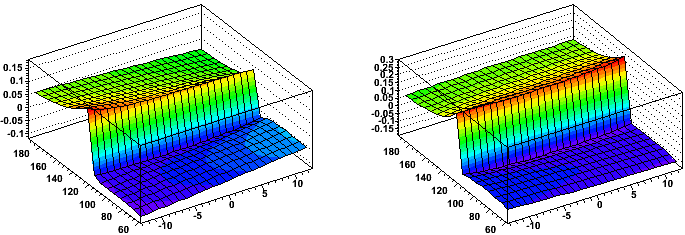
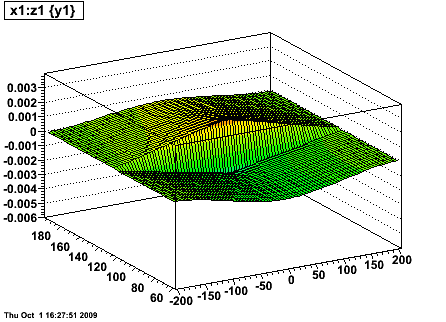


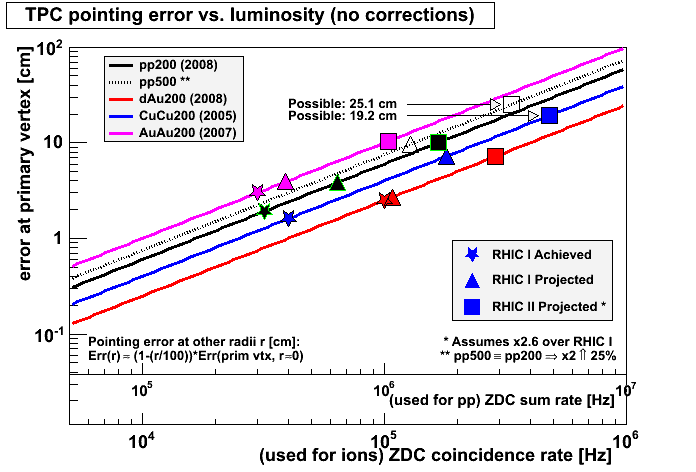
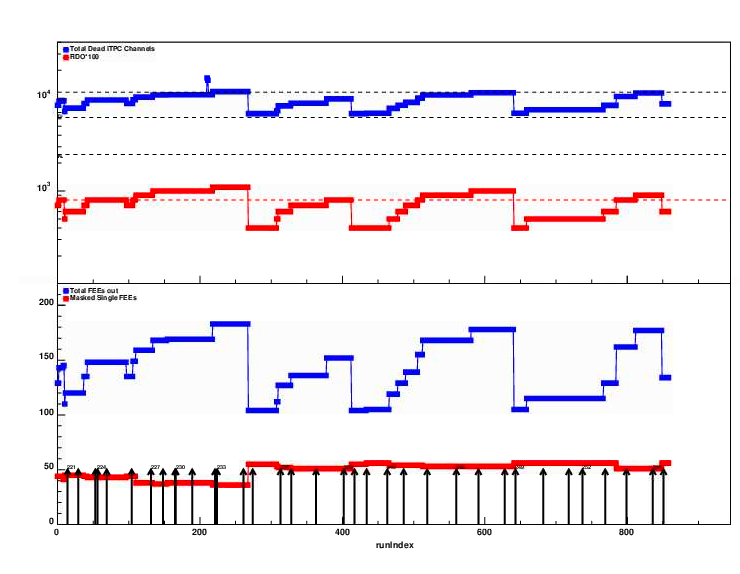
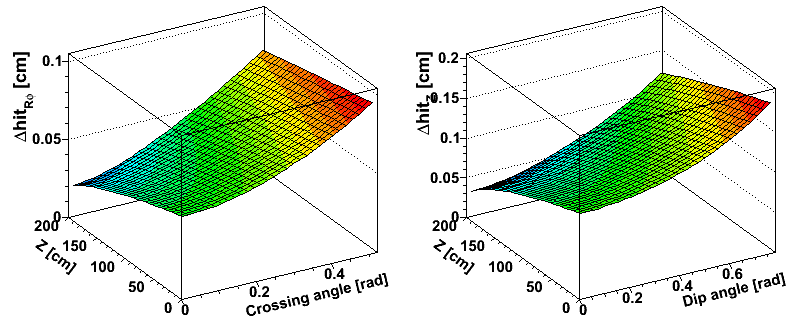
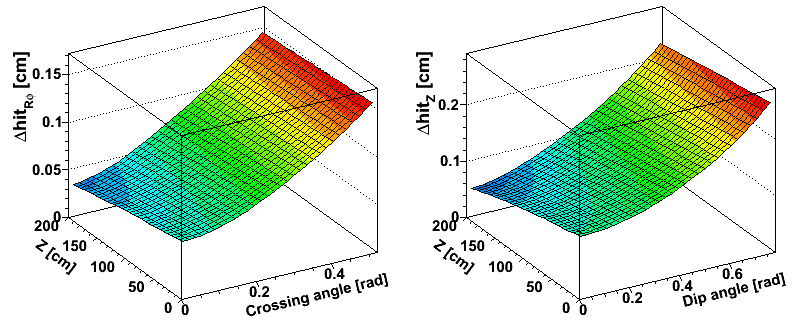
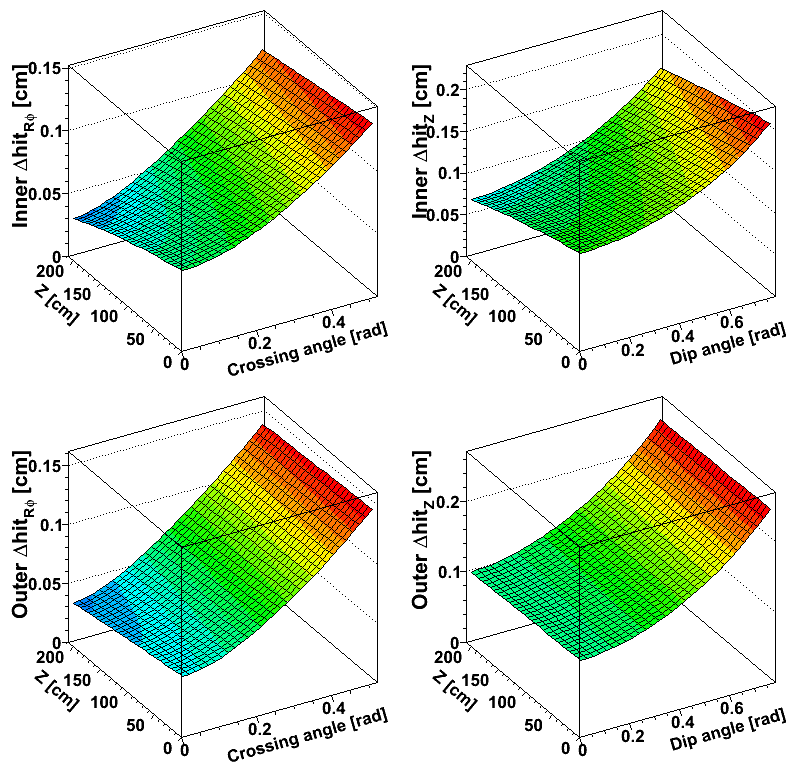
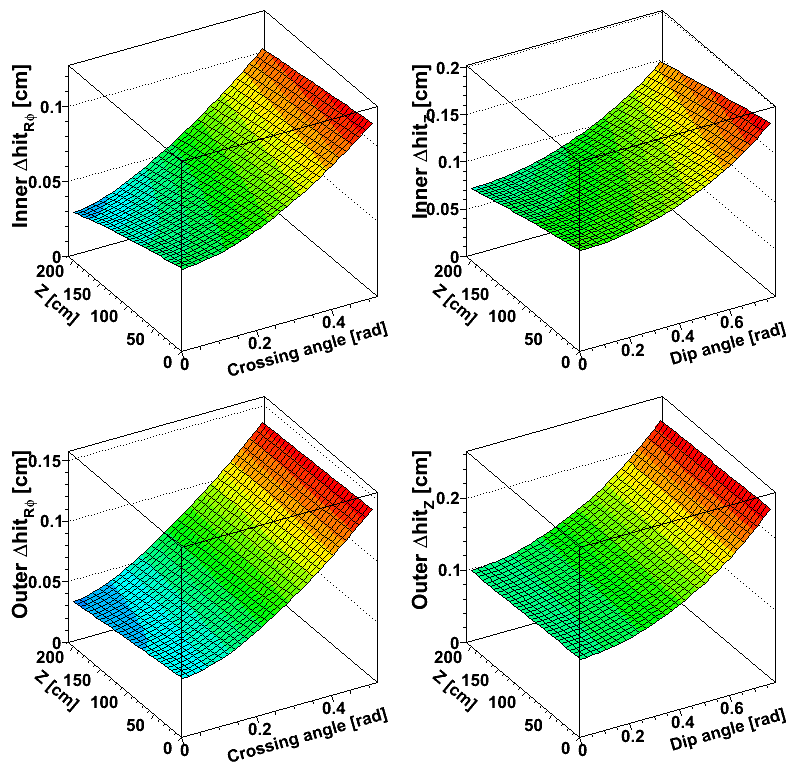
.gif)
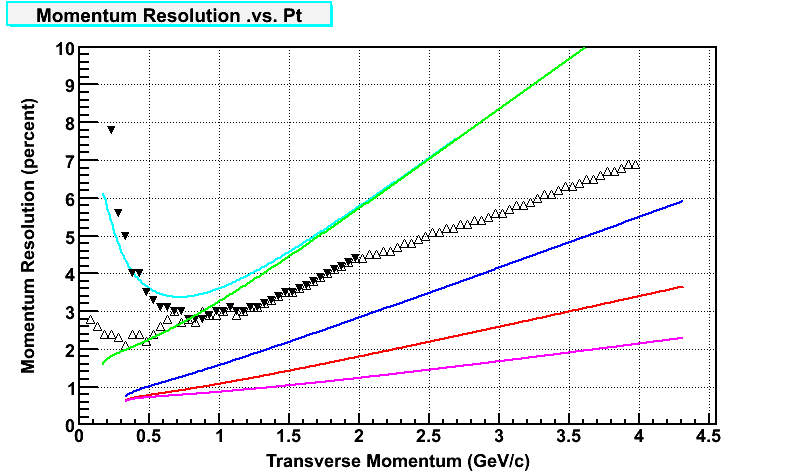
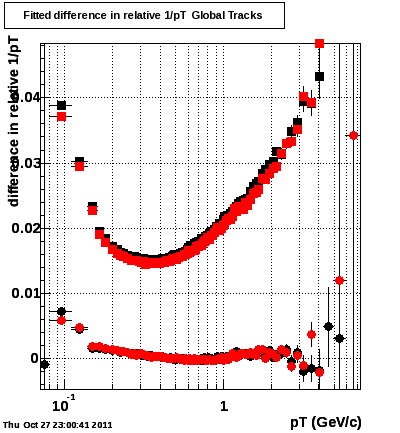
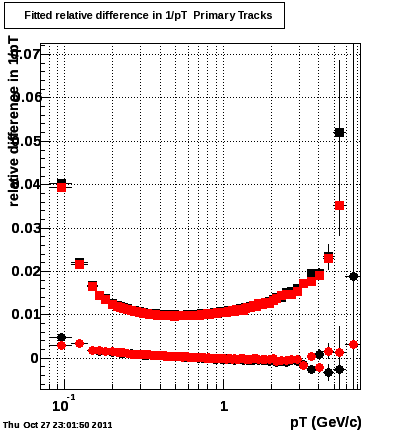
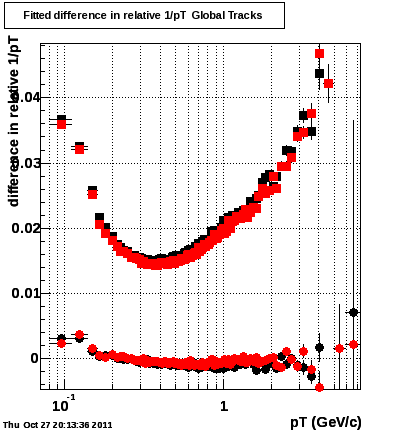
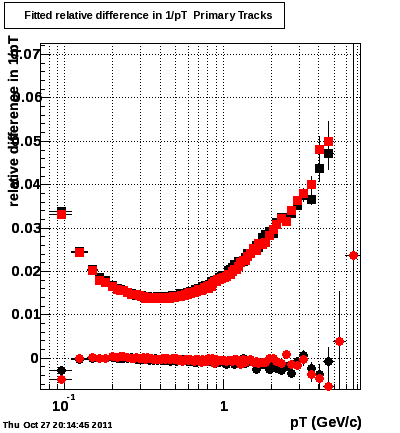
.gif)
