- BEMC
- BEMC Detector Operator Manual
- Calibrations
- BPRS
- BSMD
- BTOW - Calibration Procedure
- Run 12 BTOW Calibration
- Run 3 BTOW Calibration
- Run 4 BTOW Calibration
- Run 5 BTOW Calibration
- Run 6 BTOW Calibration
- Run 7 BTOW Calibration
- Run 8 BTOW Calibration (2008)
- 01 statistical analysis of 2008 HV
- 02 BTOW swaps ver=1.3
- 03 MIP peak analysis (TPC tracks, 2008 pp data)
- 04 relative tower gains based on MIPs (gain correction 1)
- 05 Absolute Calibration from Electrons
- 06 Calculating 2009 HV from Electron Calibrations
- 07 BTOW absolute gains 'ab initio'
- 08 Completed Calibration and Uncertainty
- Run 9 BTOW Calibration
- Database
- Hardware
- Mapping
- Service Tasks
- Software
- Useful Documents
- BTOF
- DAQ
- Detector Upgrades
- EEMC
- EPD
- ETOF
- FCS
- FGT
- FPD & FMS & FPS
- FTPC
- FTT
- HFT
- HLT
- L3
- MTD
- MTD NPS Maps
- PMD
- PP2PP
- RICH
- Roman Pot Phase II*
- Run-18 calibrations
- SSD
- SVT
- Slow Controls
- TPC
- TRG
- Trigger Detectors
- VPD
- test
03 MIP peak analysis (TPC tracks, 2008 pp data)
Updated on Tue, 2009-09-15 13:58 by mattheww. Originally created by balewski on 2009-02-16 12:39.
Under:
I examined runs from 2008 pp (list attached below) to create calibration trees (using StRoot/StEmcPool/StEmcOfflineCalibrationMaker). The code loops over the primary tracks in the event and selects the global track associated with it, if available. If the track can be associated to a tower and has outermomentum > 1 GeV, it is saved.
I then loop over those tracks and choose ones that fall within a certain criteria:
- p > 1
- adc - ped > 1.5 * ped_rms
- tower_entrance_id = tower_exit_id
- only a single track points to the tower
- neighoring towers have small amounts of energy
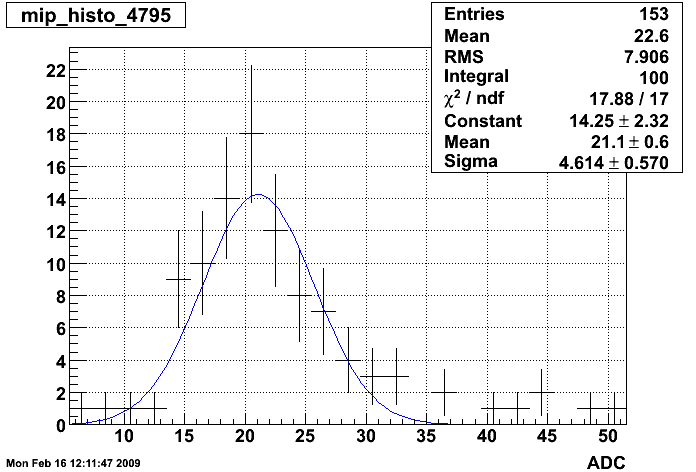
We can sum over all runs to produce MIP spectrum in 4445 towers. Of those, 4350 pass current QA requirements. An example MIP spectrum with fit is shown below. All MIP peaks can be seen in the attached PDF. It's important to note that the uncertainty on the MIP peak location with these statistics is on average 5%. This number is a lower limit on the calibration coefficient uncertainty that can only be improved with statistics.
Fig 1. Typical MIP peak. Plots like this for all 4800 towers are in attachment 1.

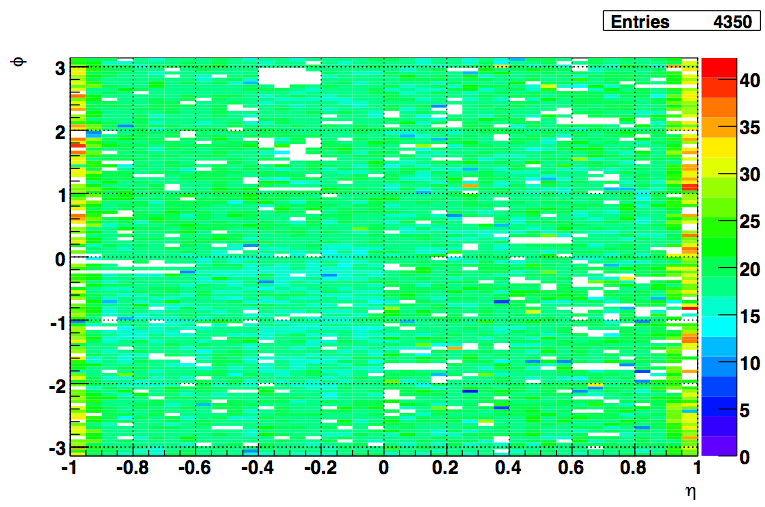
The following plot shows MIP peak location in ADCs (in eta, phi space) of all of towers where such a peak could be found.
Fig 2. MIP Peak (Z-axis) for all towers

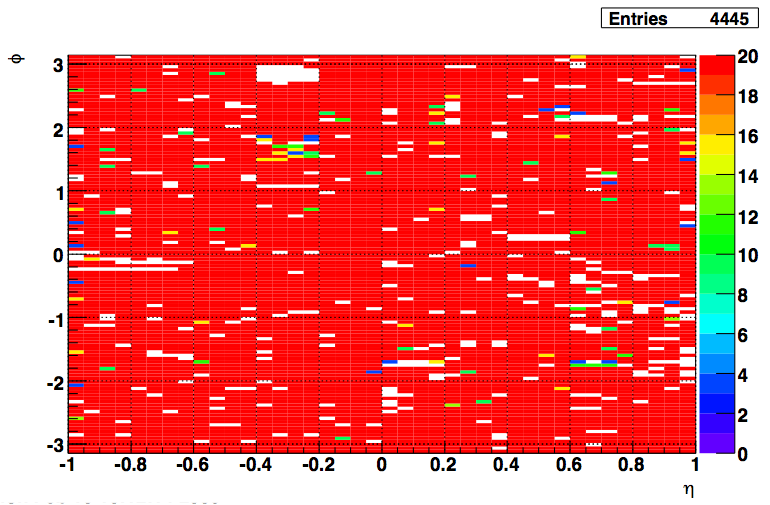
This plot shows the status codes of the towers. White are the towers that had 0 entries in their histograms. Red are the good towers (pushed them off scale to see the rest of the entries). Towers in the outermost eta bin received different treatment. The fit range was between [6,100] for those towers (vs [6,50] for the rest). The cuts applied for QA were slightly loosened. The rest of the codes follow this scheme:
- bit 1: entries in histogram > 0
- bit 2: sigma of fit below threshold (15,20)
- bit 4: mean of fit above 5 ADCs
- bit 8: difference of fit mean and MPV in fit range below threshold (5,10)
Fig 3. status of towers

Spectra of towers rejected by rudimentary automatic QA were manually inspected and 91 were found to contain reasonable MIP peak and have bin re-qualified as good. PLots for those towers are in attachment 2.
»
- Printer-friendly version
- Login or register to post comments
