Sort by:[Date]
Upsilons in U+U - paper status (report #18)
Updated on Thu, 2015-06-11 08:47. Originally created by rvertesi on 2015-06-11 08:47.Upsilons in U+U paper status report.
HF PWG report #18b, corresponding to paper version v3
Corresponding documents are here:
RHIC & AGS Meeting 2015 Talk on Anisotropy Measurement in Small Colliding System
Updated on Wed, 2015-06-10 21:01. Originally created by yili on 2015-06-10 21:01.
First Look at AN for p-Al (Day160)
Updated on Fri, 2015-06-12 09:51. Originally created by heppel on 2015-06-10 10:49.
We have downloaded and analyzed about 5 to 6 hours of data from Day160 (first p-Al data).
The runs are:
16160039
16160040
2015 RHIC & AGS Annual Users' Meeting talk
Updated on Tue, 2015-06-09 15:14. Originally created by mriganka on 2015-06-09 15:14.TPC Ion Backflow Study
Updated on Mon, 2015-06-15 12:11. Originally created by genevb on 2015-06-09 11:17. PAs of the study: J. Thomas (LBNL), G. Van Buren (BNL), with significant contributions from T. Ljubicic (BNL)
Grid Leak between Inner and Outer TPC sectors estimations based on garfield++
Updated on Thu, 2015-06-11 14:53. Originally created by fisyak on 2015-06-09 09:19.
Second Settings for Day 155
Updated on Tue, 2015-06-09 02:03. Originally created by heppel on 2015-06-09 02:03. After further analysis of Day 155 runs from the last post, an imporved set of gain corrections is available.
It is attached to this page.
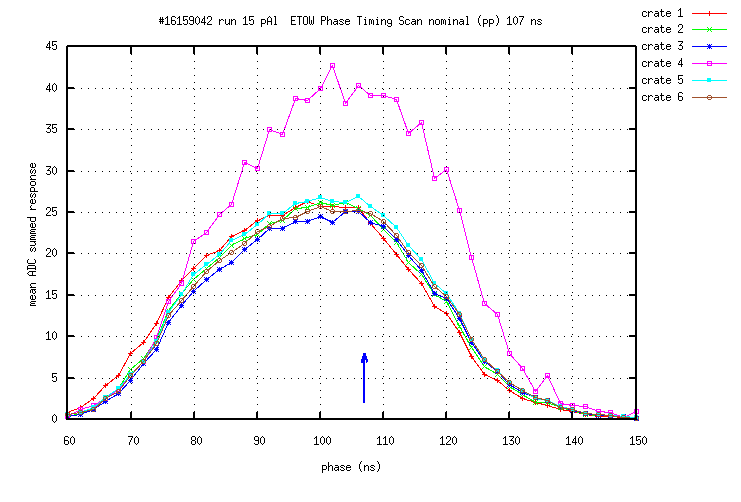
run 15 pAl timing scan
Updated on Mon, 2015-06-08 23:49. Originally created by skoby on 2015-06-08 23:33.